Statistics and Probability: Assessment 2 Assignment Solution

Verified

Added on  2023/04/24

|3
|449
|300
Homework Assignment
AI Summary
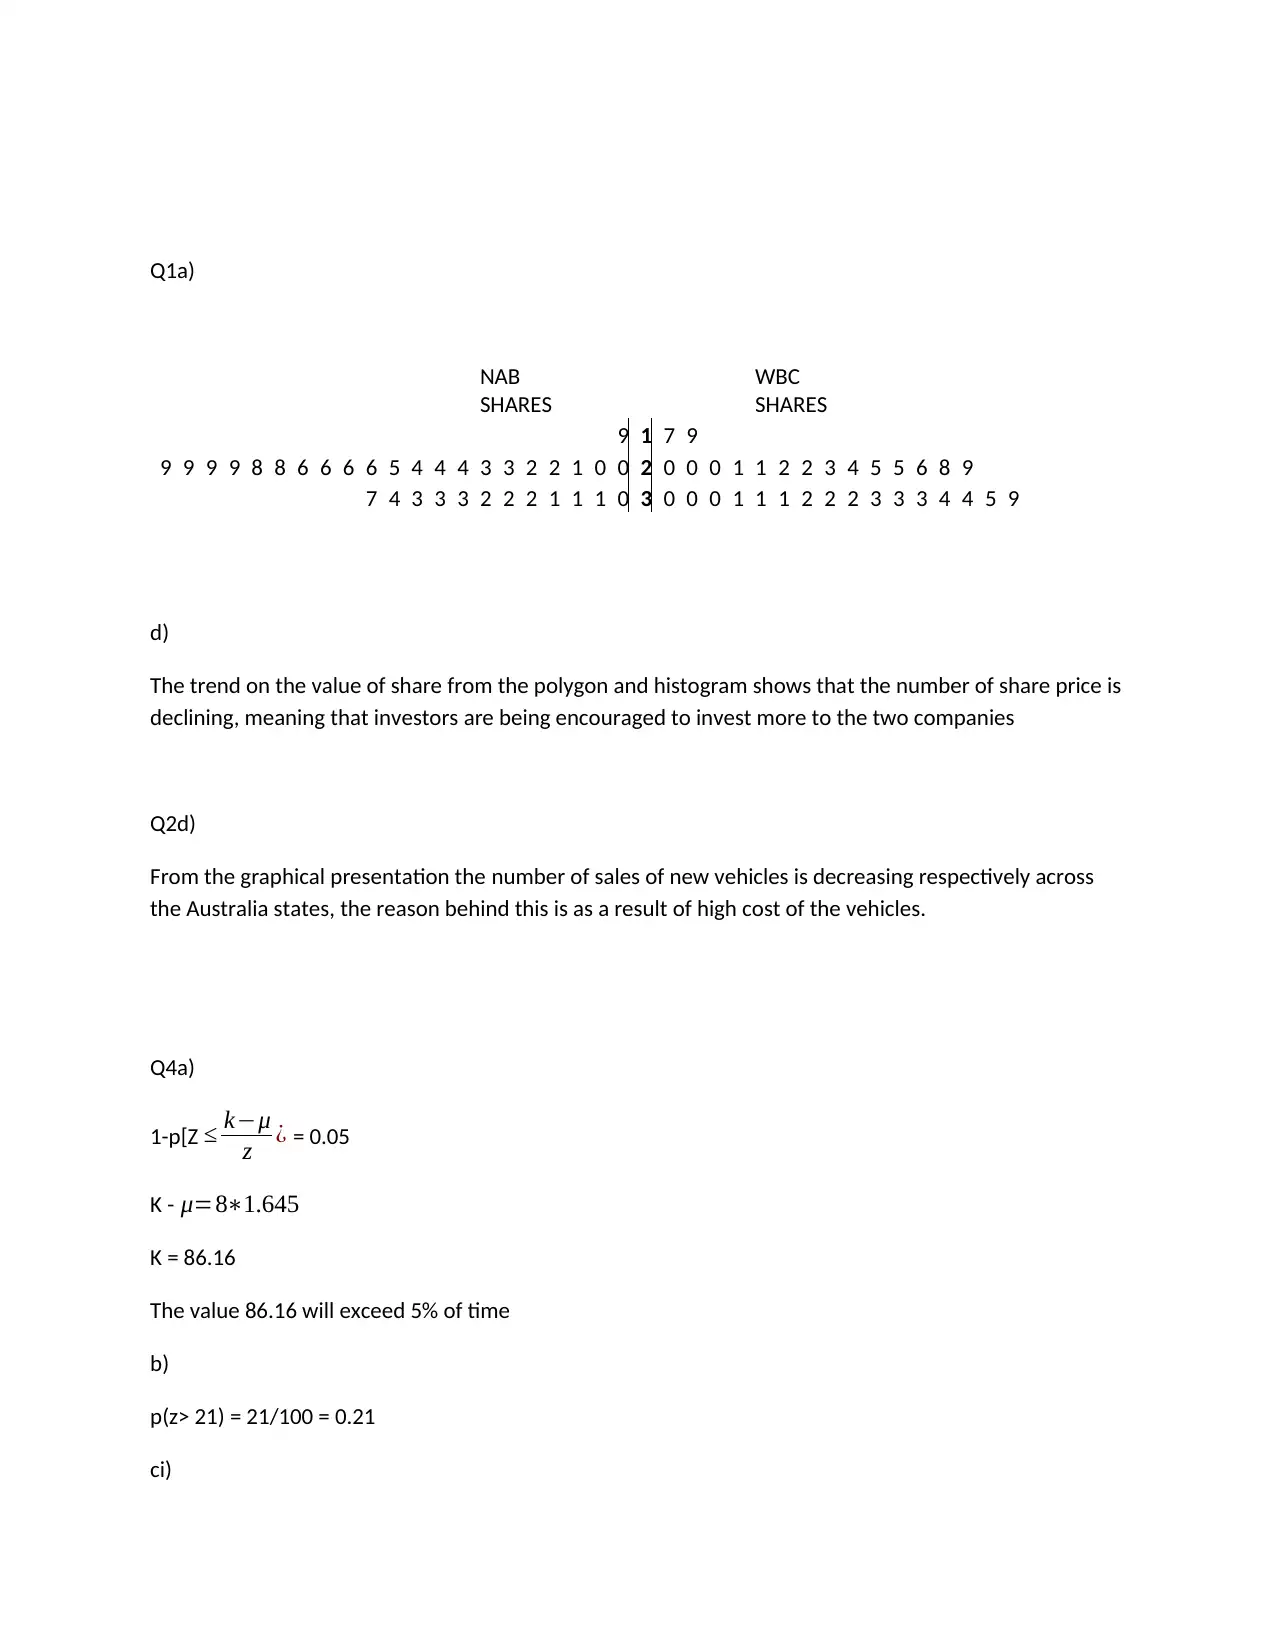
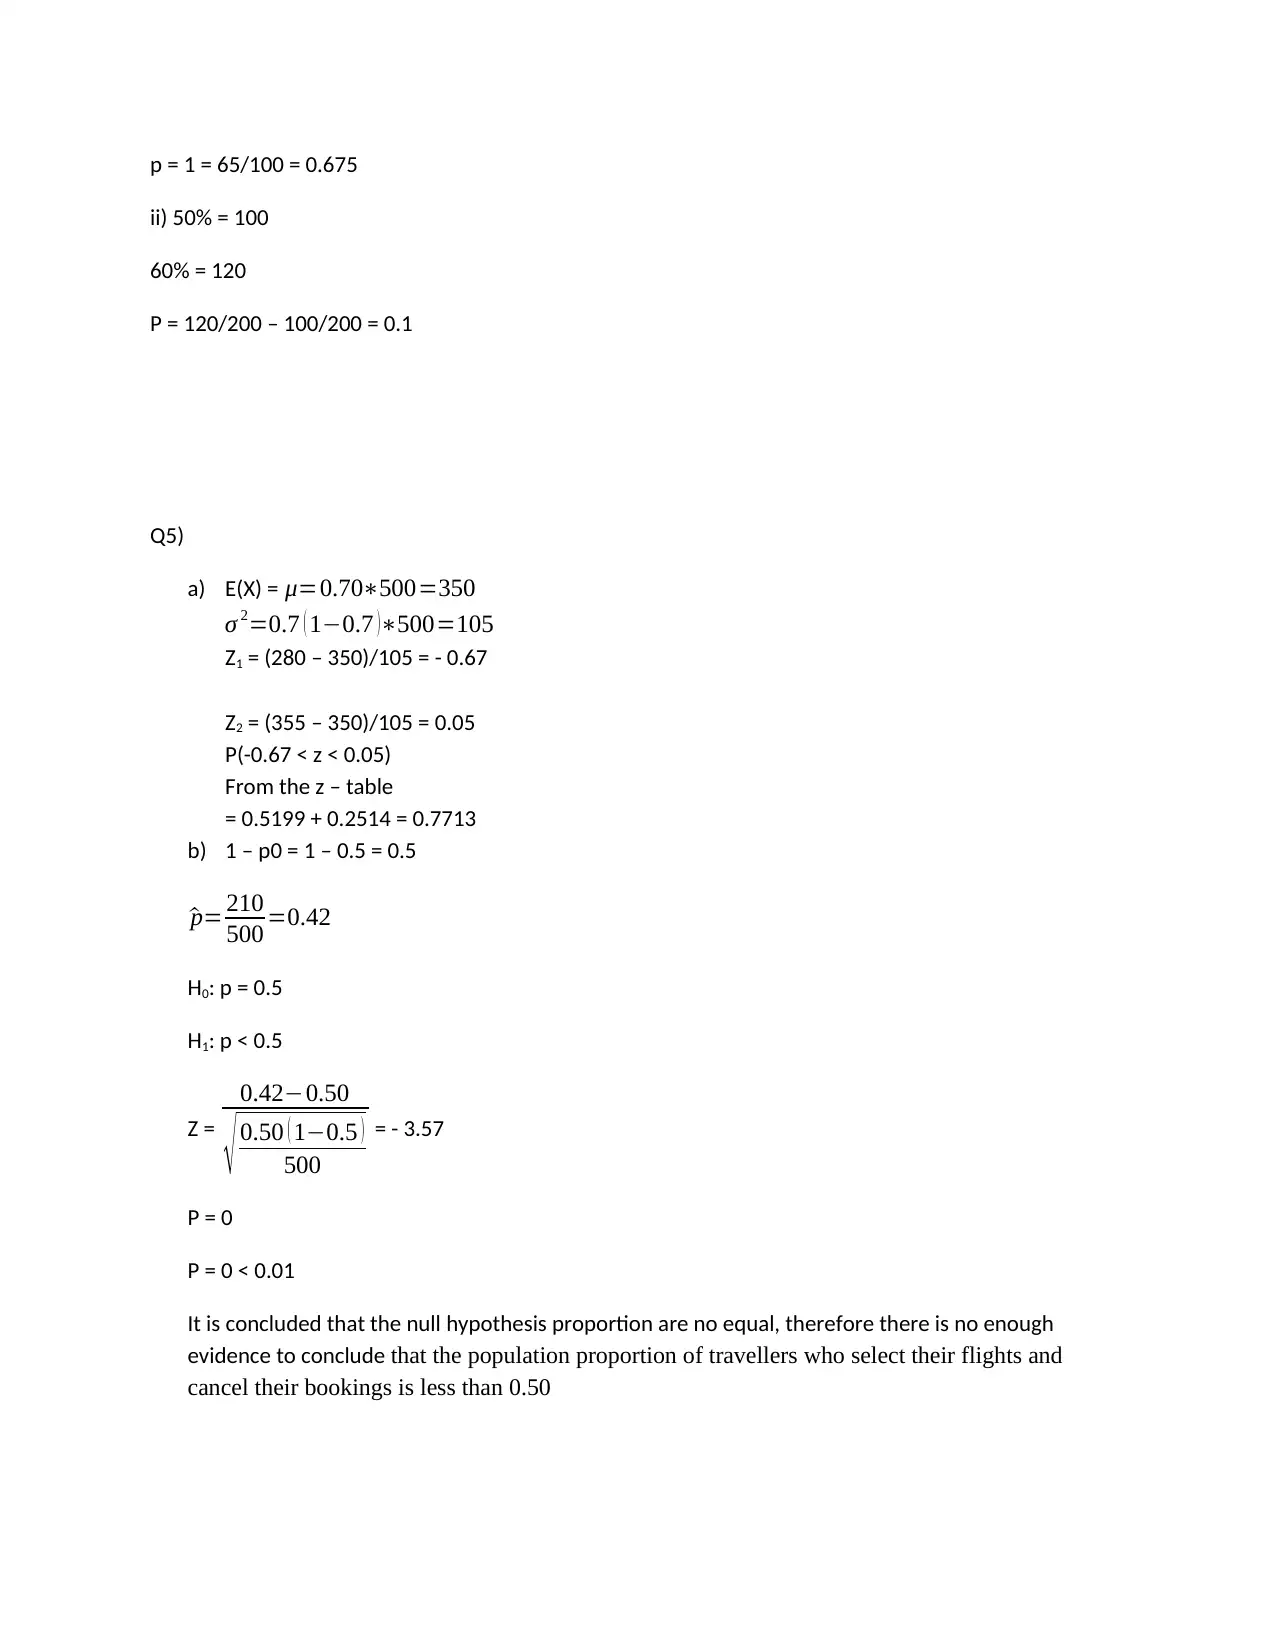
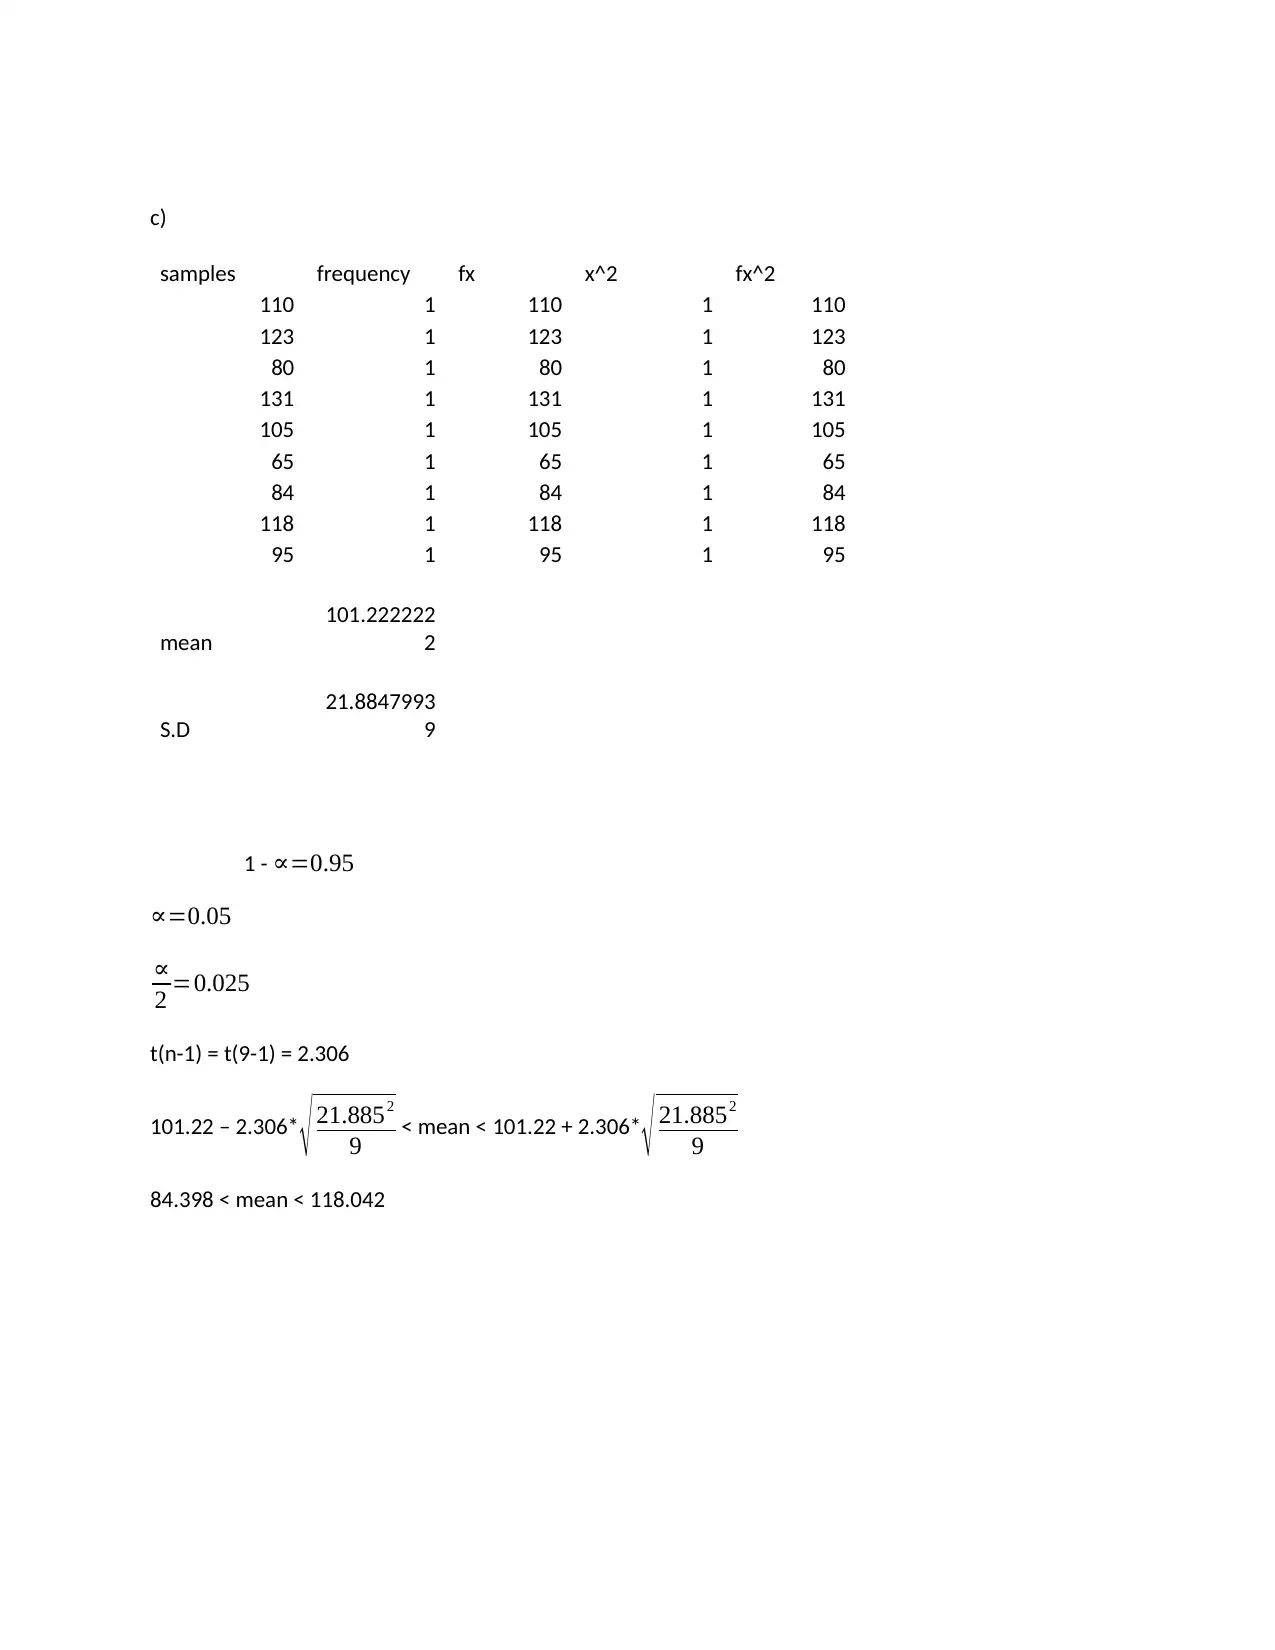
This document provides a comprehensive solution to a statistics assignment, addressing several key areas. It begins with analyzing share values using polygon and histogram trends, exploring declining share prices. The solution then examines vehicle sales trends across Australian states, attributing the decrease to high vehicle costs. Statistical calculations include z-scores, probability distributions, and hypothesis testing. The assignment covers calculating probabilities, determining critical values, and performing hypothesis tests for proportions. Furthermore, it includes calculations for confidence intervals, and calculations for the mean and standard deviation using sample data. The document includes detailed workings and explanations for each problem, ensuring a thorough understanding of the statistical concepts involved.
Document Page
Q1a)
NAB
SHARES
WBC
SHARES
9 1 7 9
9 9 9 9 8 8 6 6 6 6 5 4 4 4 3 3 2 2 1 0 0 2 0 0 0 1 1 2 2 3 4 5 5 6 8 9
7 4 3 3 3 2 2 2 1 1 1 0 3 0 0 0 1 1 1 2 2 2 3 3 3 4 4 5 9
d)
The trend on the value of share from the polygon and histogram shows that the number of share price is
declining, meaning that investors are being encouraged to invest more to the two companies
Q2d)
From the graphical presentation the number of sales of new vehicles is decreasing respectively across
the Australia states, the reason behind this is as a result of high cost of the vehicles.
Q4a)
1-p[Z kμ
z ¿ = 0.05
K - μ=81.645
K = 86.16
The value 86.16 will exceed 5% of time
b)
p(z> 21) = 21/100 = 0.21
ci)
tabler-icon-diamond-filled.svg

Paraphrase This Document

Need a fresh take? Get an instant paraphrase of this document with our AI Paraphraser
Document Page
p = 1 = 65/100 = 0.675
ii) 50% = 100
60% = 120
P = 120/200 – 100/200 = 0.1
Q5)
a) E(X) = μ=0.70500=350
σ 2=0.7 ( 10.7 )500=105
Z1 = (280 – 350)/105 = - 0.67
Z2 = (355 – 350)/105 = 0.05
P(-0.67 < z < 0.05)
From the z – table
= 0.5199 + 0.2514 = 0.7713
b) 1 – p0 = 1 – 0.5 = 0.5
^p= 210
500 =0.42
H0: p = 0.5
H1: p < 0.5
Z =
0.420.50
0.50 ( 10.5 )
500
= - 3.57
P = 0
P = 0 < 0.01
It is concluded that the null hypothesis proportion are no equal, therefore there is no enough
evidence to conclude that the population proportion of travellers who select their flights and
cancel their bookings is less than 0.50
Document Page
c)
samples frequency fx x^2 fx^2
110 1 110 1 110
123 1 123 1 123
80 1 80 1 80
131 1 131 1 131
105 1 105 1 105
65 1 65 1 65
84 1 84 1 84
118 1 118 1 118
95 1 95 1 95
mean
101.222222
2
S.D
21.8847993
9
1 - =0.95
=0.05

2 =0.025
t(n-1) = t(9-1) = 2.306
101.22 – 2.306* 21.8852
9 < mean < 101.22 + 2.306* 21.8852
9
84.398 < mean < 118.042
chevron_up_icon
1 out of 3
circle_padding
hide_on_mobile
zoom_out_icon
[object Object]