Statistics Assignment: Z-Scores, Regression, and Hypothesis Testing
VerifiedAdded on 2022/09/06
|6
|980
|18
Homework Assignment
AI Summary
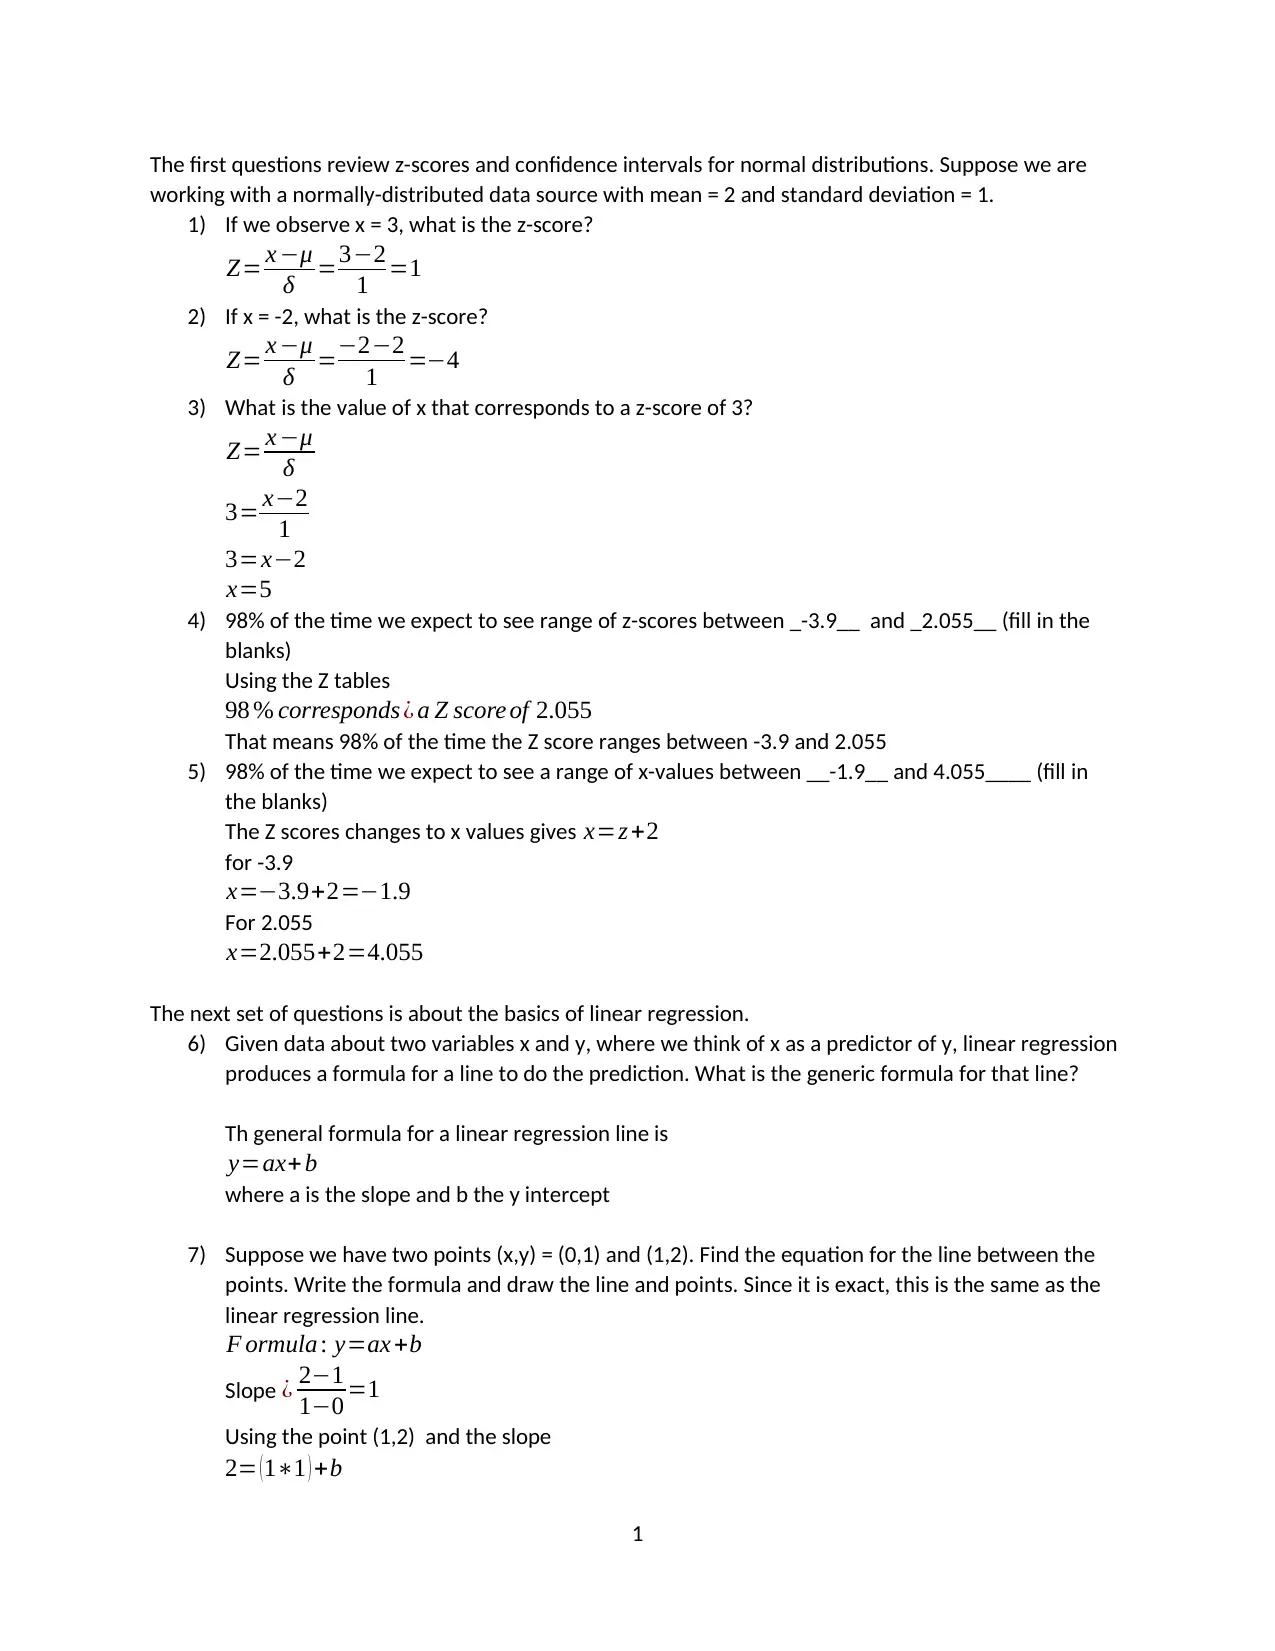
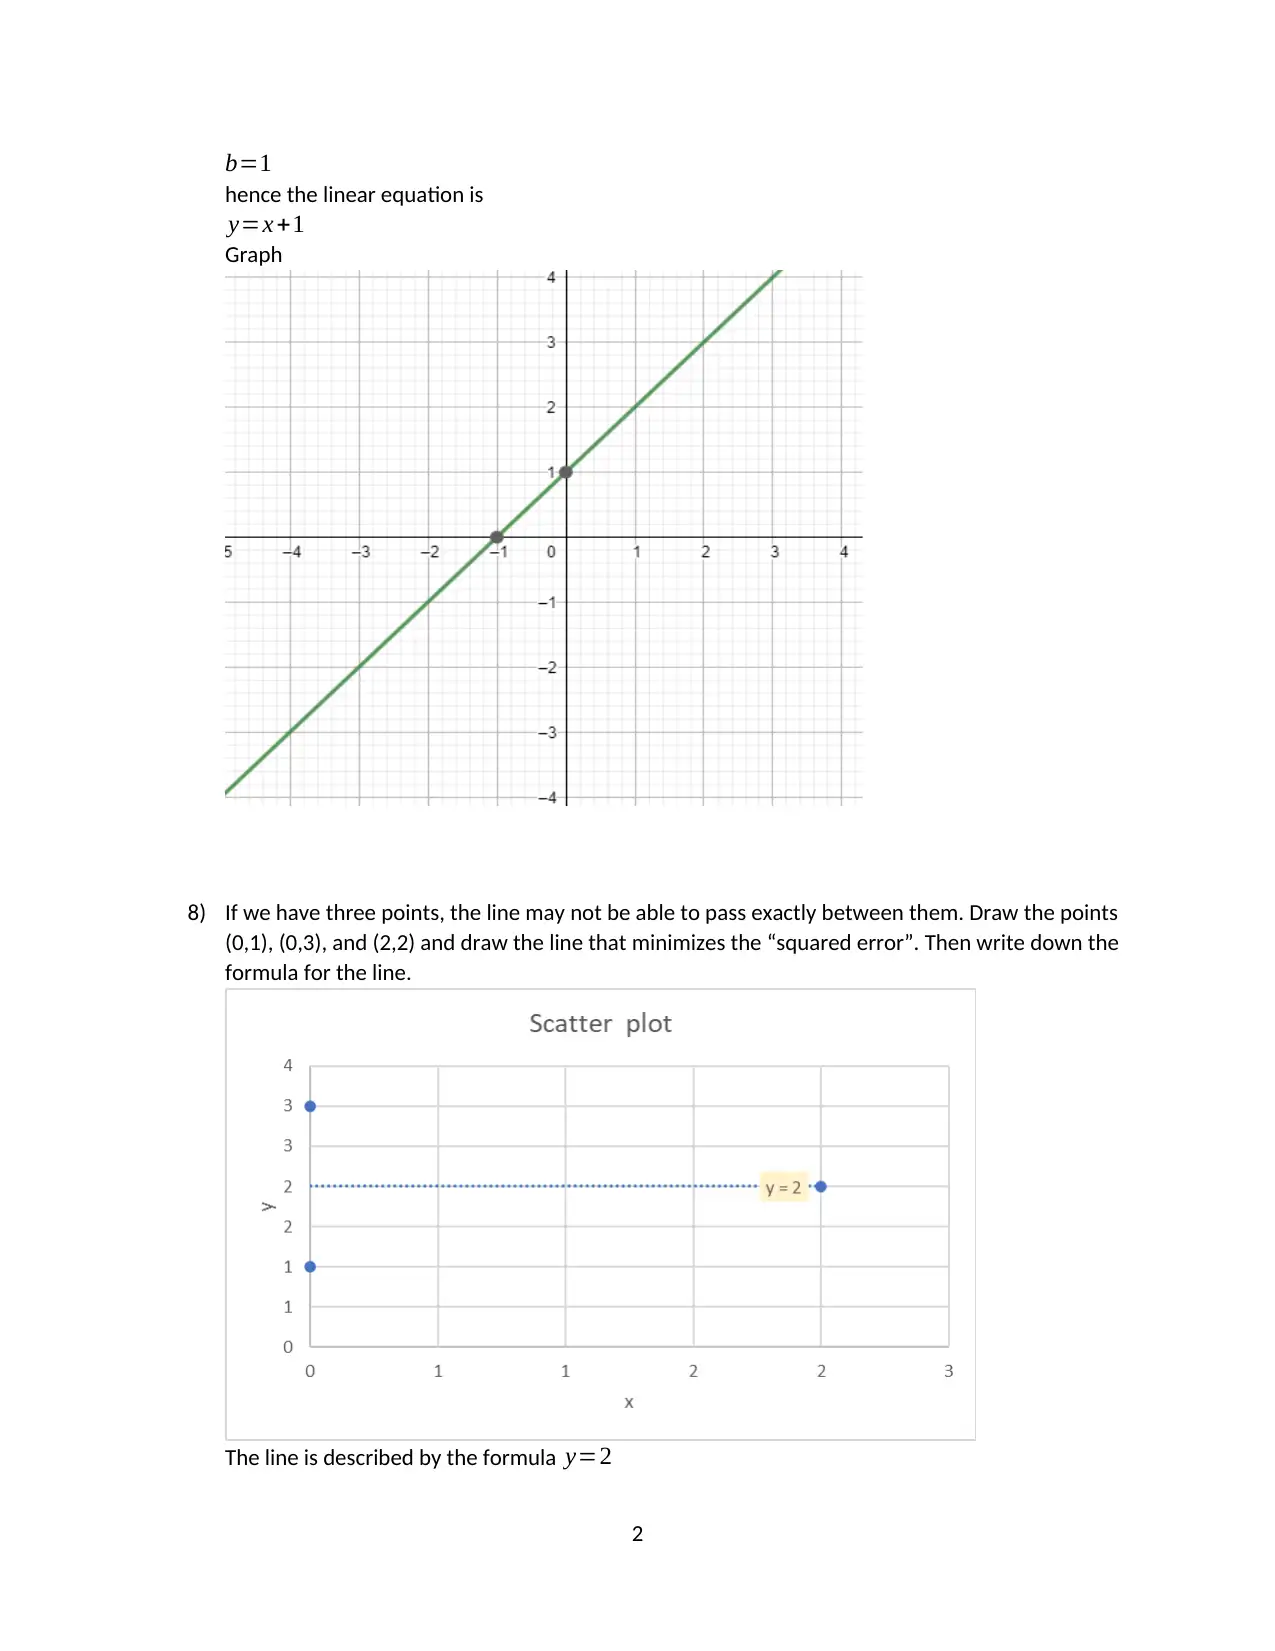
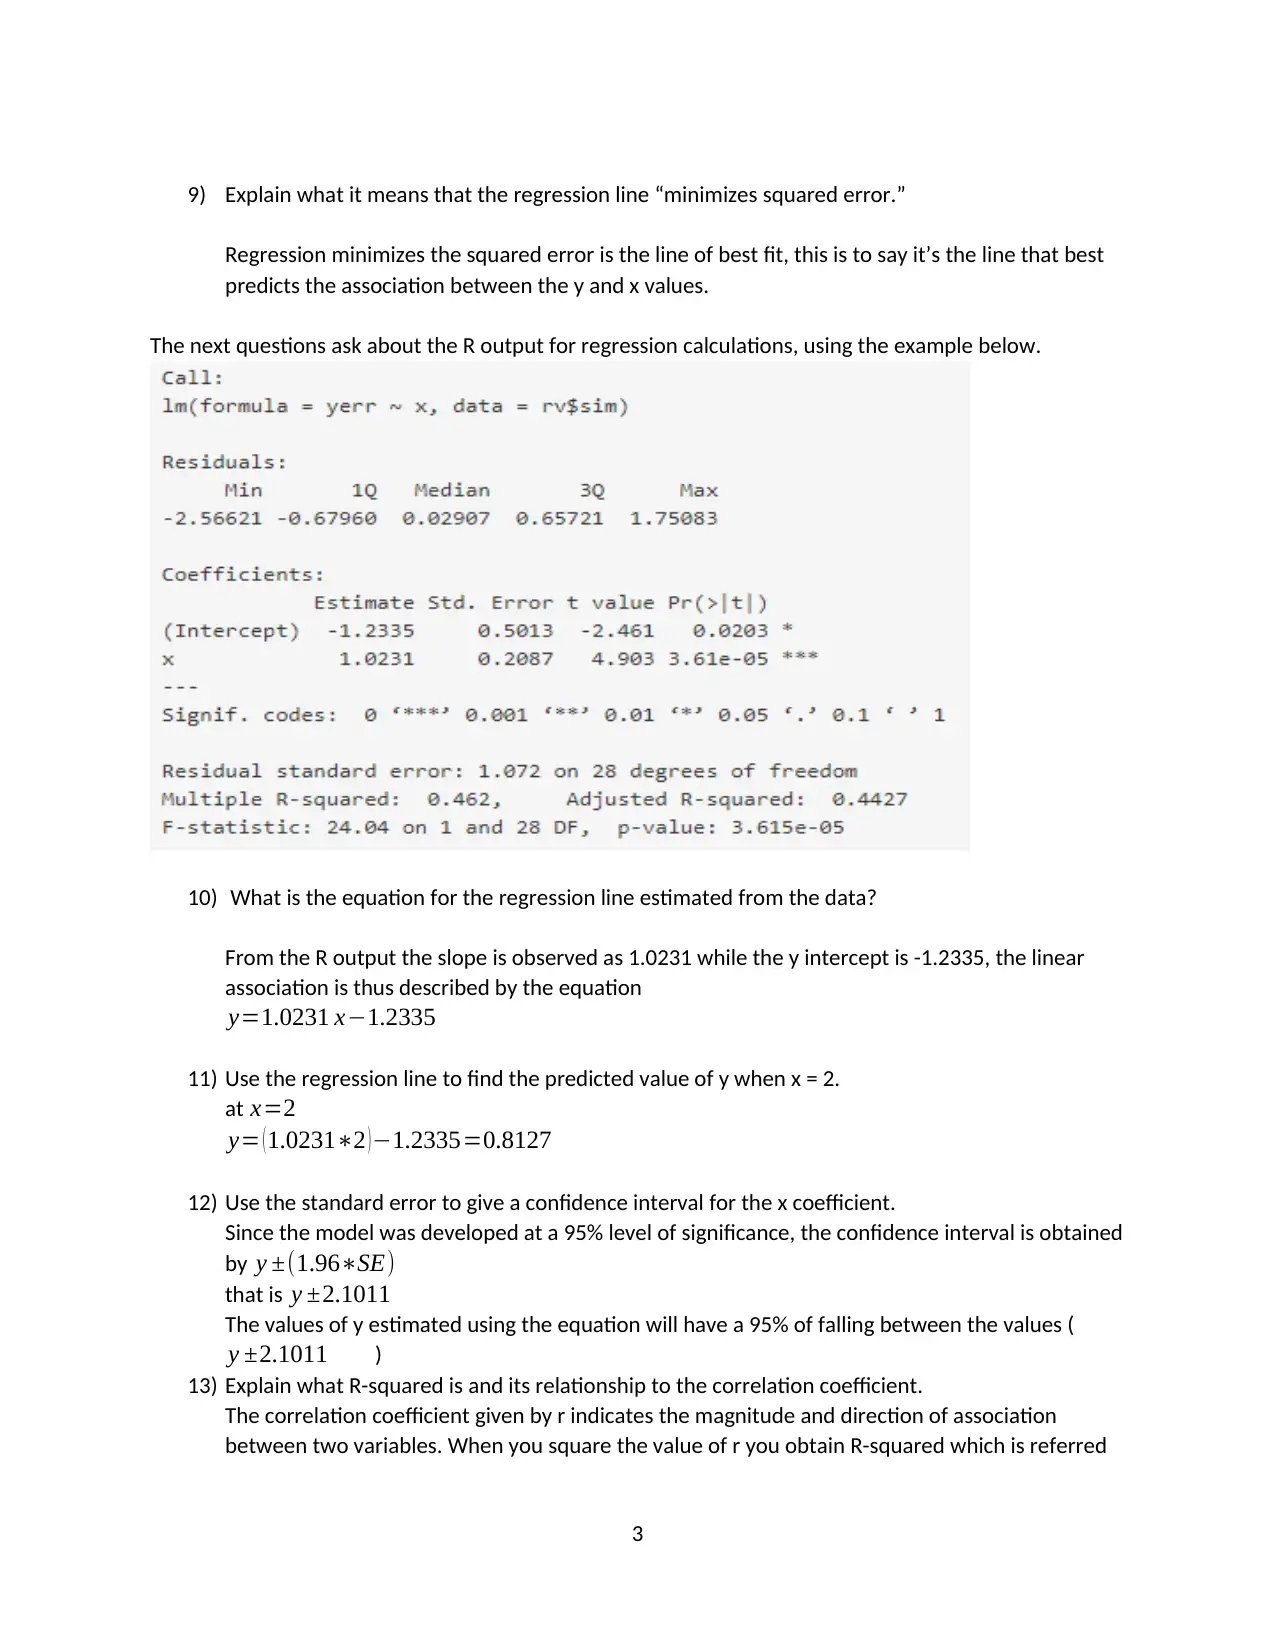
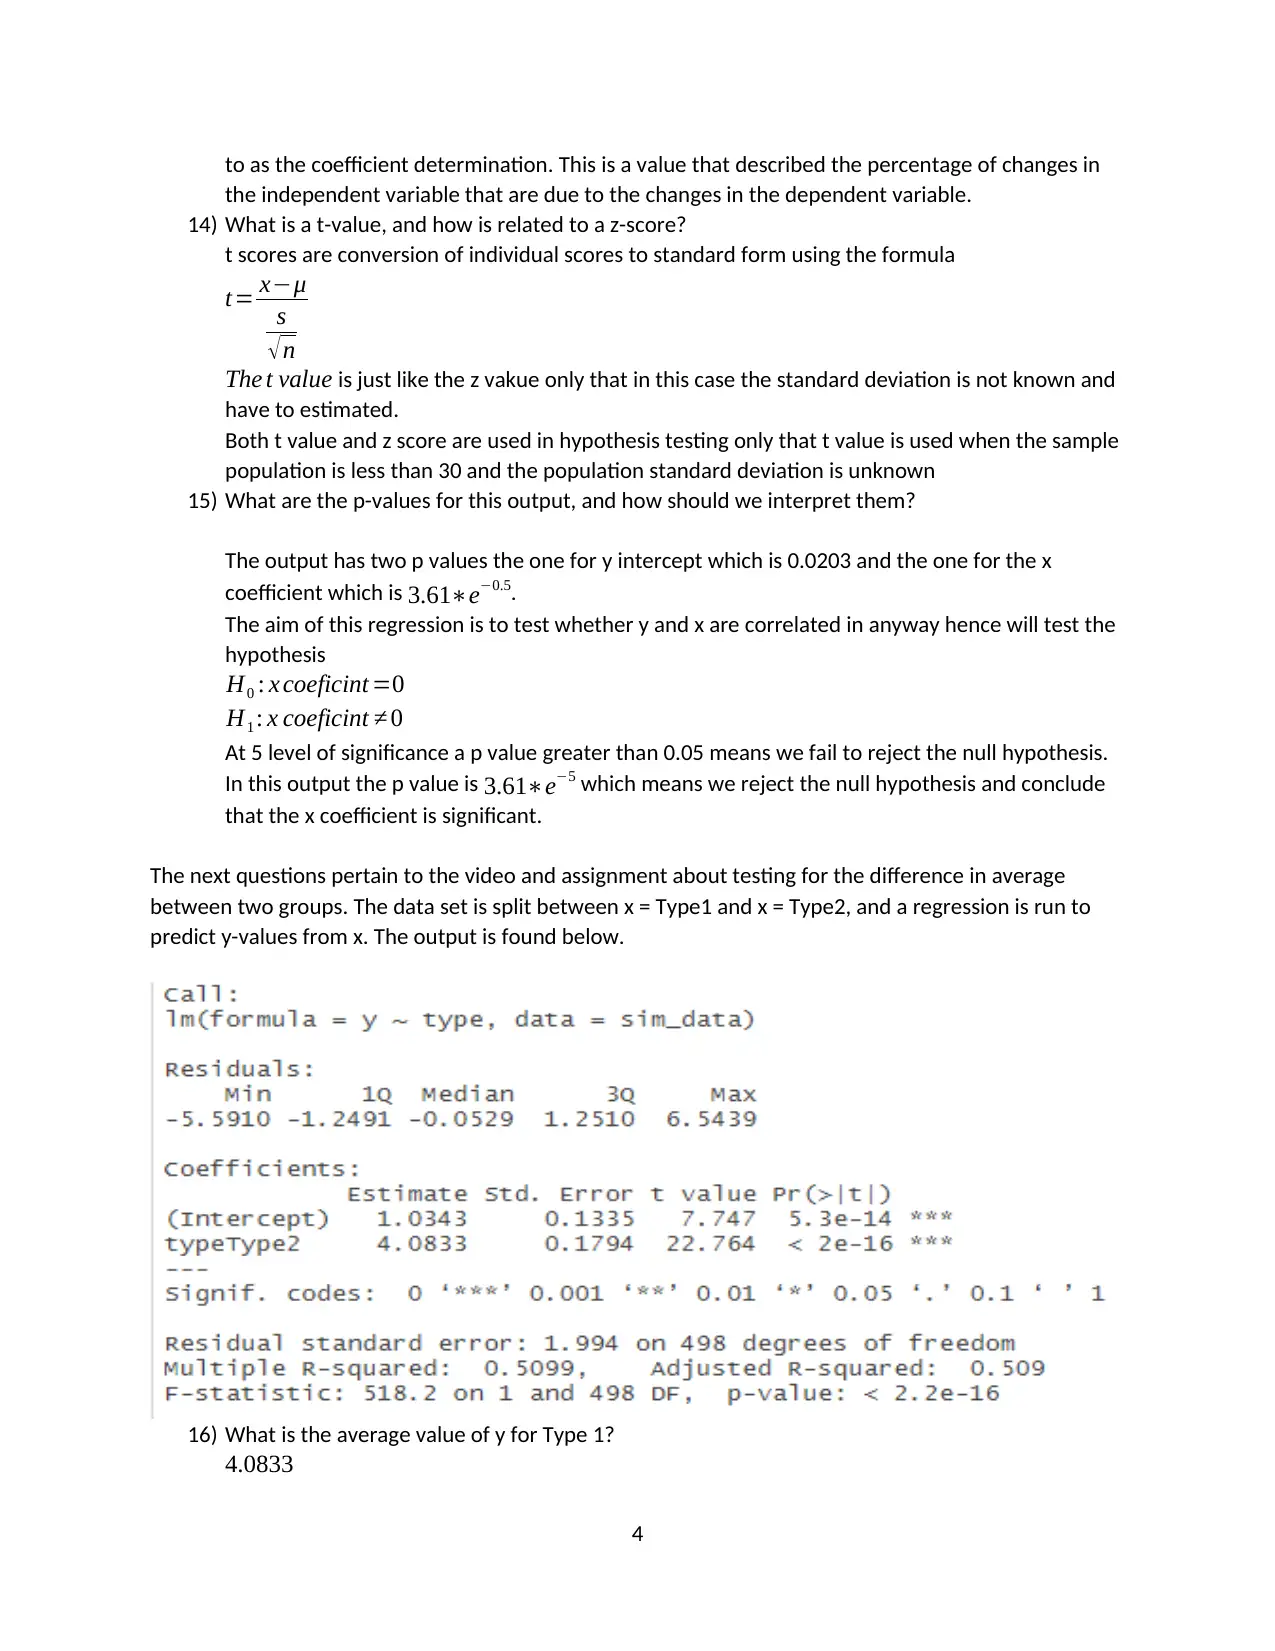
This assignment solution covers fundamental statistical concepts including Z-scores, confidence intervals, and linear regression. It begins with calculating Z-scores for given data points and determining corresponding x-values. The solution then explores linear regression, deriving the formula for a regression line and finding the equation for a line given two points. The assignment further delves into interpreting regression output, including the meaning of R-squared, t-values, and p-values, and how to perform hypothesis testing. The solution also addresses the comparison of average values between two groups using regression analysis and matching graphs to regression outputs. The solution provides detailed explanations and calculations for each question, offering a comprehensive understanding of the statistical concepts covered.

The first questions review z-scores and confidence intervals for normal distributions. Suppose we are
working with a normally-distributed data source with mean = 2 and standard deviation = 1.
1) If we observe x = 3, what is the z-score?
Z= x −μ
δ =3−2
1 =1
2) If x = -2, what is the z-score?
Z= x −μ
δ =−2−2
1 =−4
3) What is the value of x that corresponds to a z-score of 3?
Z= x −μ
δ
3= x−2
1
3=x−2
x=5
4) 98% of the time we expect to see range of z-scores between _-3.9__ and _2.055__ (fill in the
blanks)
Using the Z tables
98 % corresponds ¿ a Z score of 2.055
That means 98% of the time the Z score ranges between -3.9 and 2.055
5) 98% of the time we expect to see a range of x-values between __-1.9__ and 4.055____ (fill in
the blanks)
The Z scores changes to x values gives x=z +2
for -3.9
x=−3.9+2=−1.9
For 2.055
x=2.055+2=4.055
The next set of questions is about the basics of linear regression.
6) Given data about two variables x and y, where we think of x as a predictor of y, linear regression
produces a formula for a line to do the prediction. What is the generic formula for that line?
Th general formula for a linear regression line is
y=ax+ b
where a is the slope and b the y intercept
7) Suppose we have two points (x,y) = (0,1) and (1,2). Find the equation for the line between the
points. Write the formula and draw the line and points. Since it is exact, this is the same as the
linear regression line.
F ormula : y=ax +b
Slope ¿ 2−1
1−0 =1
Using the point (1,2) and the slope
2= (1∗1 ) +b
1
Paraphrase This Document
Need a fresh take? Get an instant paraphrase of this document with our AI Paraphraser

b=1
hence the linear equation is
y=x +1
Graph
8) If we have three points, the line may not be able to pass exactly between them. Draw the points
(0,1), (0,3), and (2,2) and draw the line that minimizes the “squared error”. Then write down the
formula for the line.
The line is described by the formula y=2
2

9) Explain what it means that the regression line “minimizes squared error.”
Regression minimizes the squared error is the line of best fit, this is to say it’s the line that best
predicts the association between the y and x values.
The next questions ask about the R output for regression calculations, using the example below.
10) What is the equation for the regression line estimated from the data?
From the R output the slope is observed as 1.0231 while the y intercept is -1.2335, the linear
association is thus described by the equation
y=1.0231 x−1.2335
11) Use the regression line to find the predicted value of y when x = 2.
at x=2
y= ( 1.0231∗2 ) −1.2335=0.8127
12) Use the standard error to give a confidence interval for the x coefficient.
Since the model was developed at a 95% level of significance, the confidence interval is obtained
by y ±(1.96∗SE)
that is y ±2.1011
The values of y estimated using the equation will have a 95% of falling between the values (
y ±2.1011 )
13) Explain what R-squared is and its relationship to the correlation coefficient.
The correlation coefficient given by r indicates the magnitude and direction of association
between two variables. When you square the value of r you obtain R-squared which is referred
3
⊘ This is a preview!⊘
Do you want full access?
Subscribe today to unlock all pages.

Trusted by 1+ million students worldwide

to as the coefficient determination. This is a value that described the percentage of changes in
the independent variable that are due to the changes in the dependent variable.
14) What is a t-value, and how is related to a z-score?
t scores are conversion of individual scores to standard form using the formula
t= x−μ
s
√ n
The t value is just like the z vakue only that in this case the standard deviation is not known and
have to estimated.
Both t value and z score are used in hypothesis testing only that t value is used when the sample
population is less than 30 and the population standard deviation is unknown
15) What are the p-values for this output, and how should we interpret them?
The output has two p values the one for y intercept which is 0.0203 and the one for the x
coefficient which is 3.61∗e−0.5.
The aim of this regression is to test whether y and x are correlated in anyway hence will test the
hypothesis
H0 : x coeficint =0
H1 : x coeficint ≠ 0
At 5 level of significance a p value greater than 0.05 means we fail to reject the null hypothesis.
In this output the p value is 3.61∗e−5 which means we reject the null hypothesis and conclude
that the x coefficient is significant.
The next questions pertain to the video and assignment about testing for the difference in average
between two groups. The data set is split between x = Type1 and x = Type2, and a regression is run to
predict y-values from x. The output is found below.
16) What is the average value of y for Type 1?
4.0833
4
Paraphrase This Document
Need a fresh take? Get an instant paraphrase of this document with our AI Paraphraser

17) What is the average value of y for Type 2?
¿ 4.0833+1.0343=5.1176
18) How convincing is the difference in y-average between the two types? Use the standard error to
support your answer.
The difference in average between types 1 and 2 are 4.0833, since the standard error are very
small (0.1794), the average difference is very convincing.
For the next questions, match the graphs to the regression outputs on the page following by filling in the
blanks. Use T or B for top or bottom, L or R for left or right, e.g. TR means top right.
The top left graph goes with output __TL__
The top right graph goes with output _BL___
The bottom left graph goes with output ___TR_
The bottom right graph goes with output __BR__
5

6
⊘ This is a preview!⊘
Do you want full access?
Subscribe today to unlock all pages.

Trusted by 1+ million students worldwide
1 out of 6
Related Documents

Your All-in-One AI-Powered Toolkit for Academic Success.
+13062052269
info@desklib.com
Available 24*7 on WhatsApp / Email
Unlock your academic potential
Copyright © 2020–2025 A2Z Services. All Rights Reserved. Developed and managed by ZUCOL.