Statistics Assignment: Analyzing Startup Costs and Sales Data
VerifiedAdded on 2020/03/16
|12
|1620
|76
Homework Assignment
AI Summary
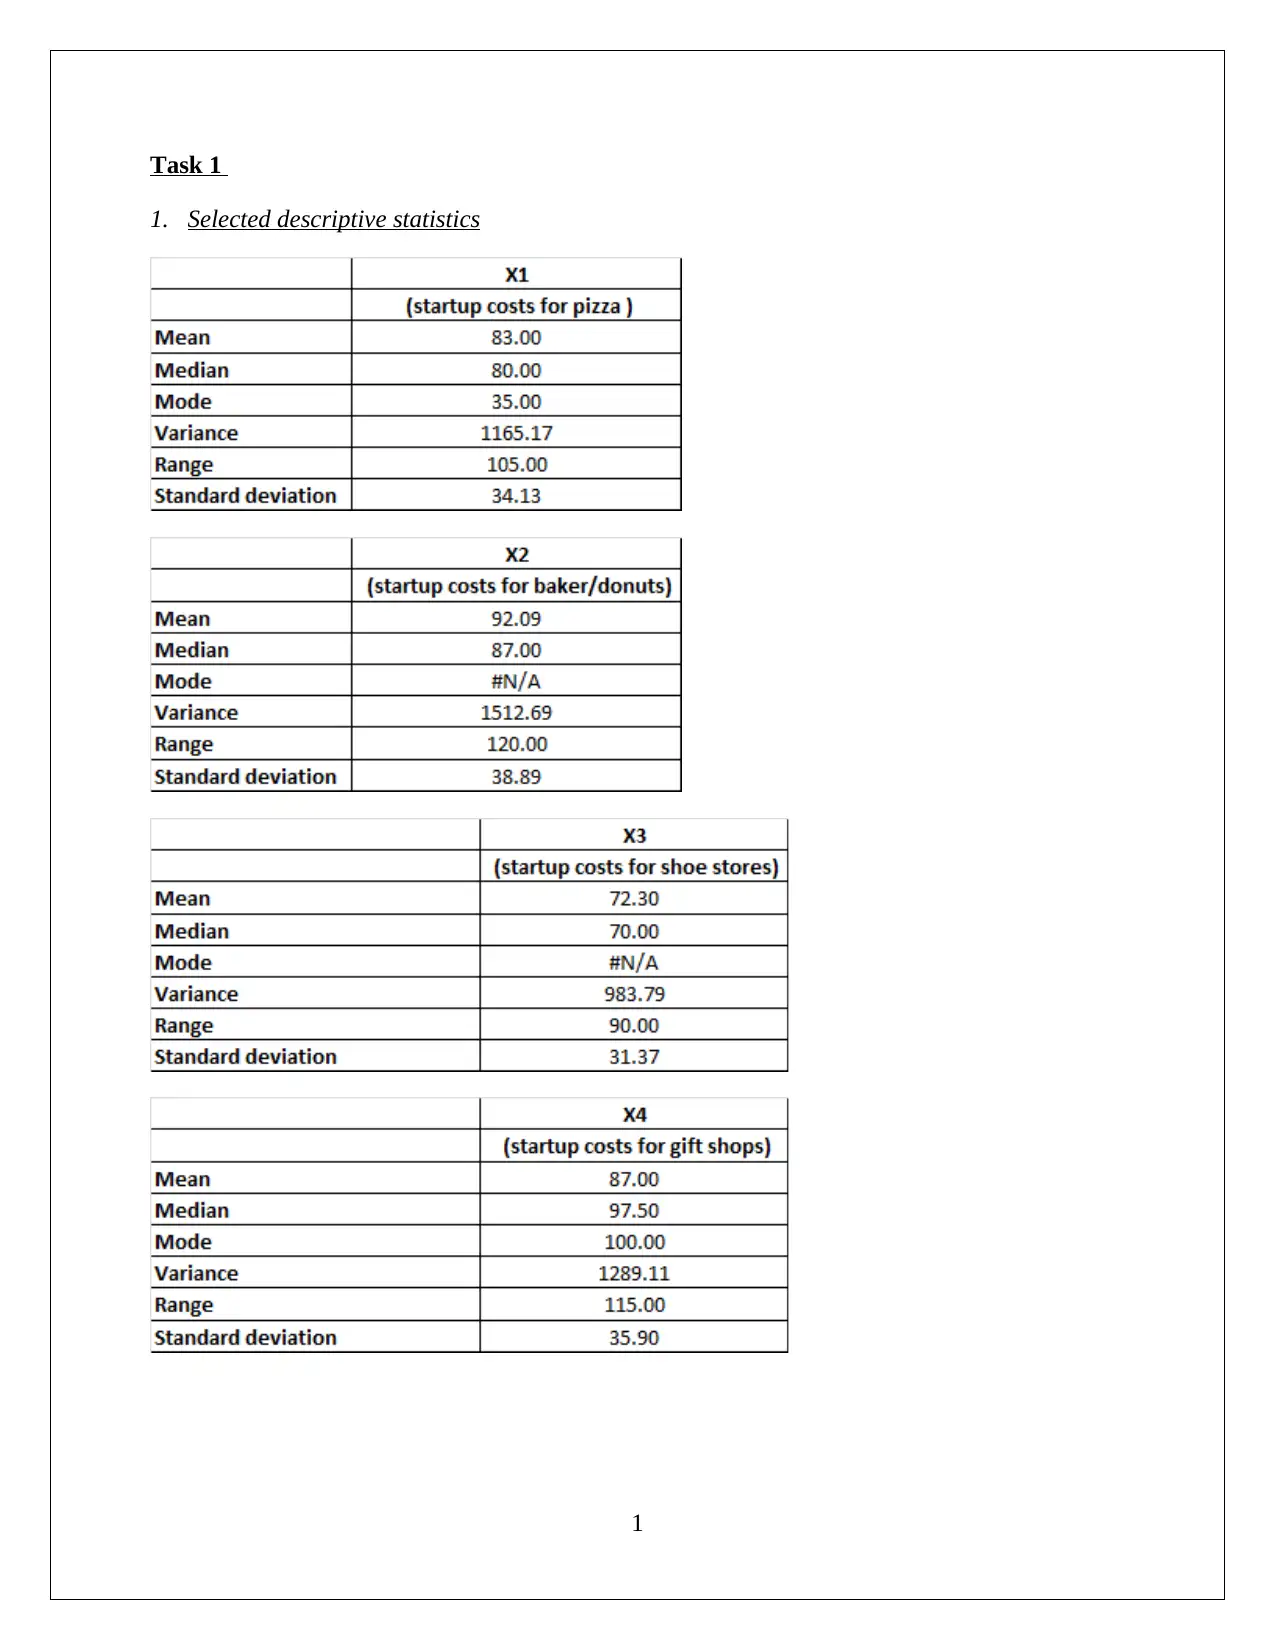
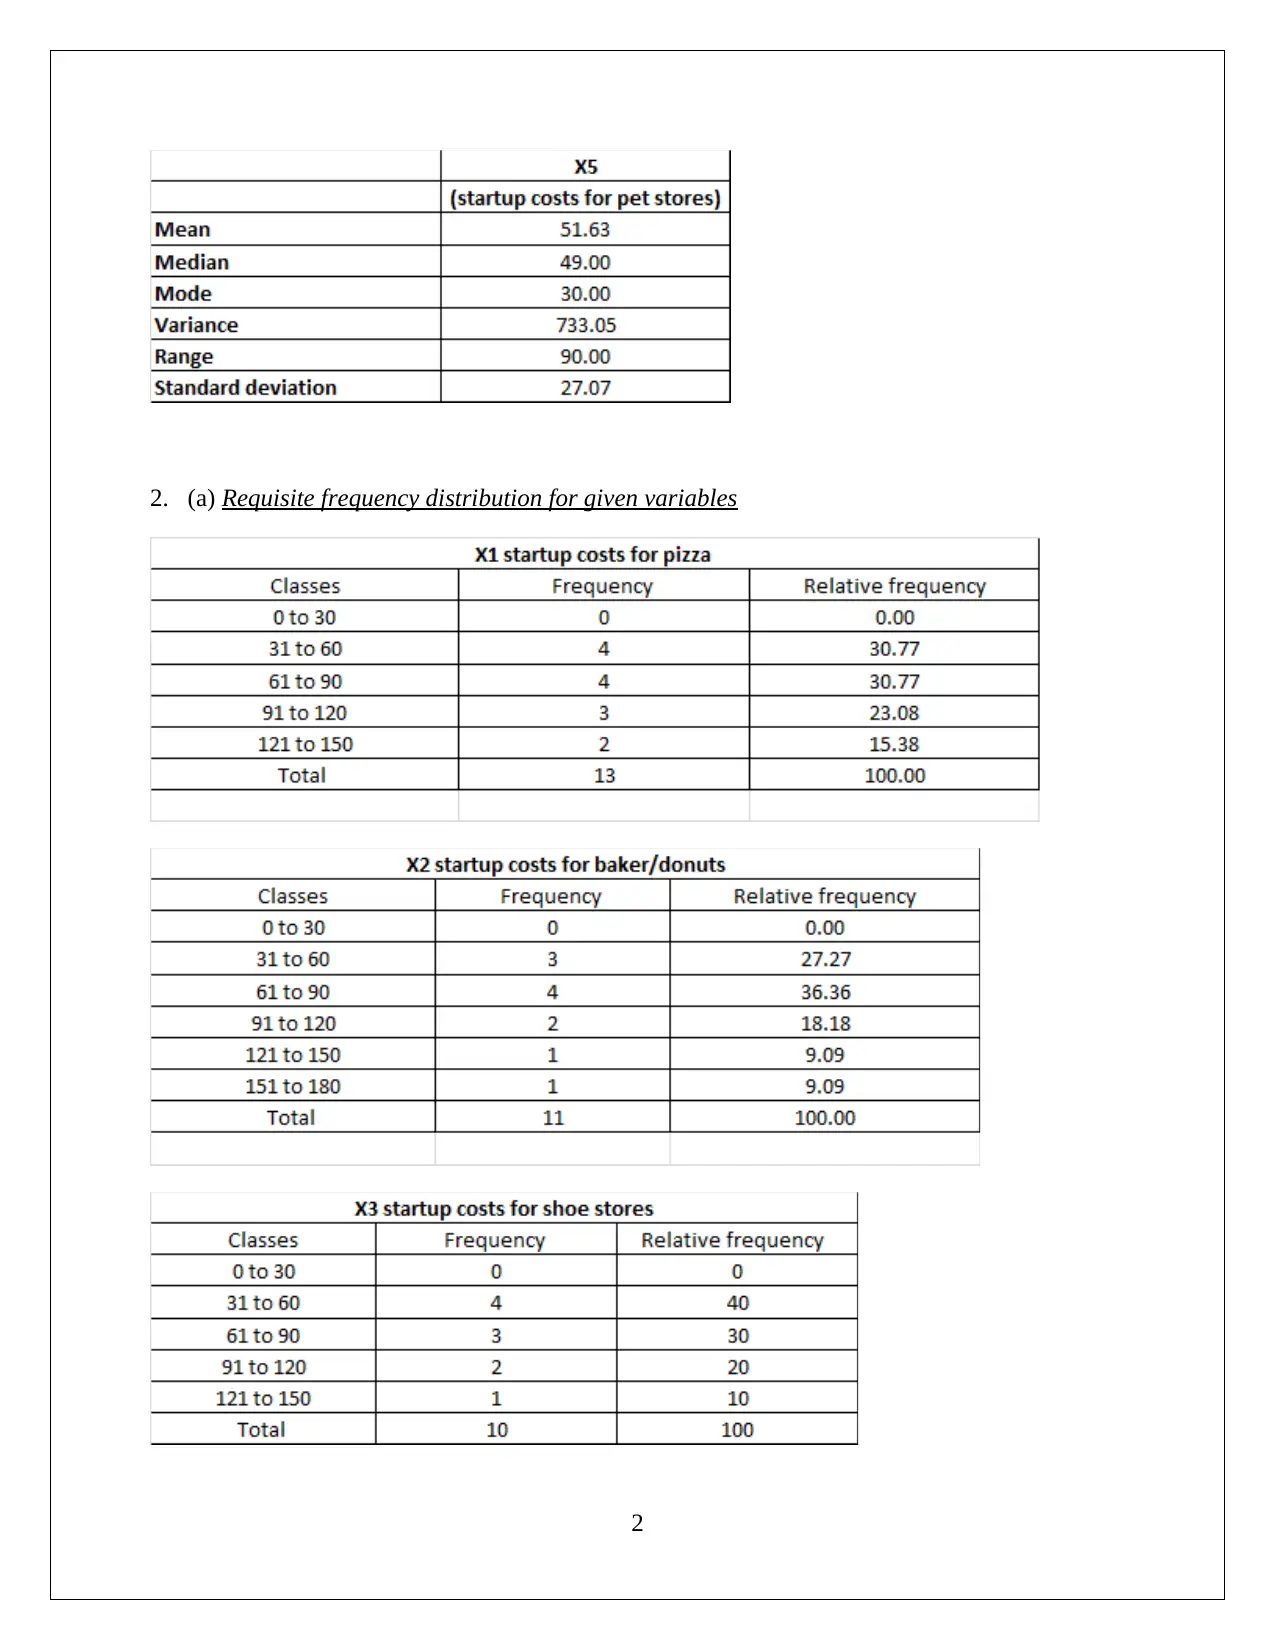
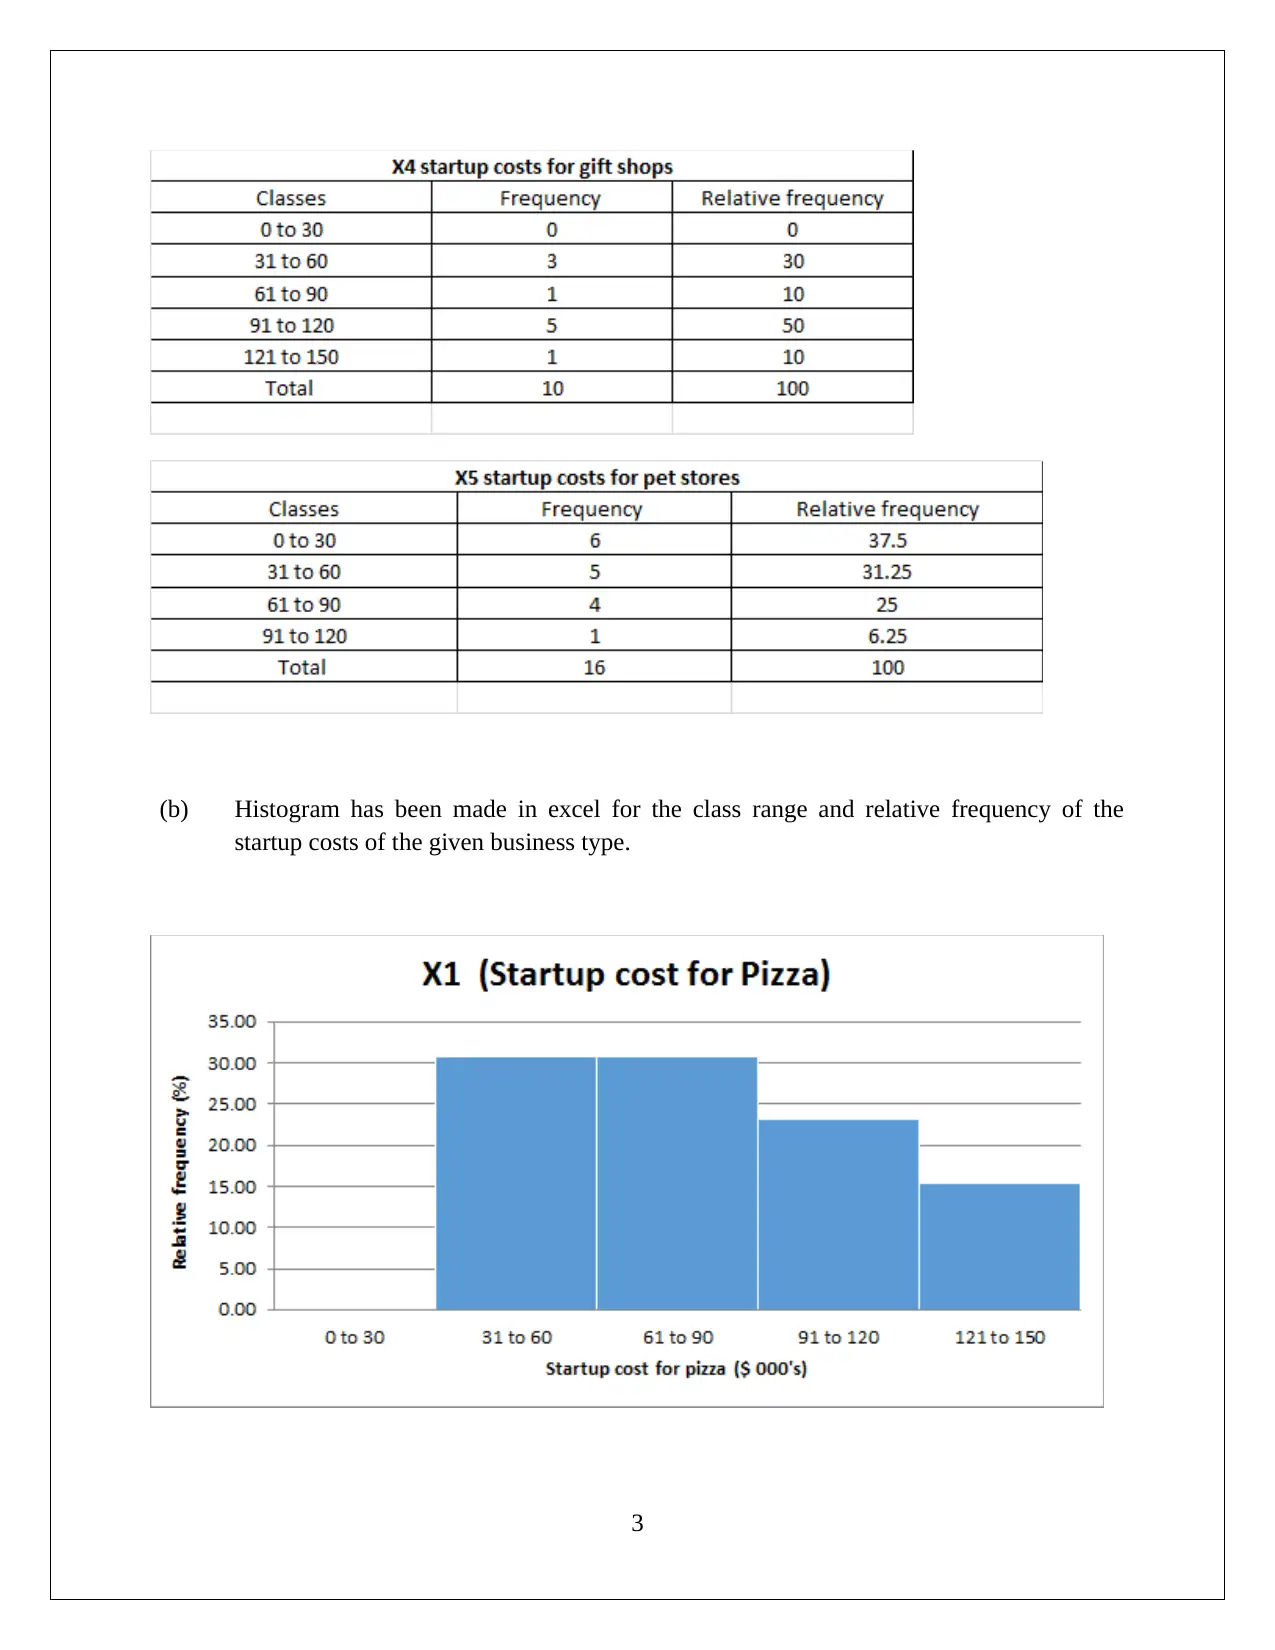
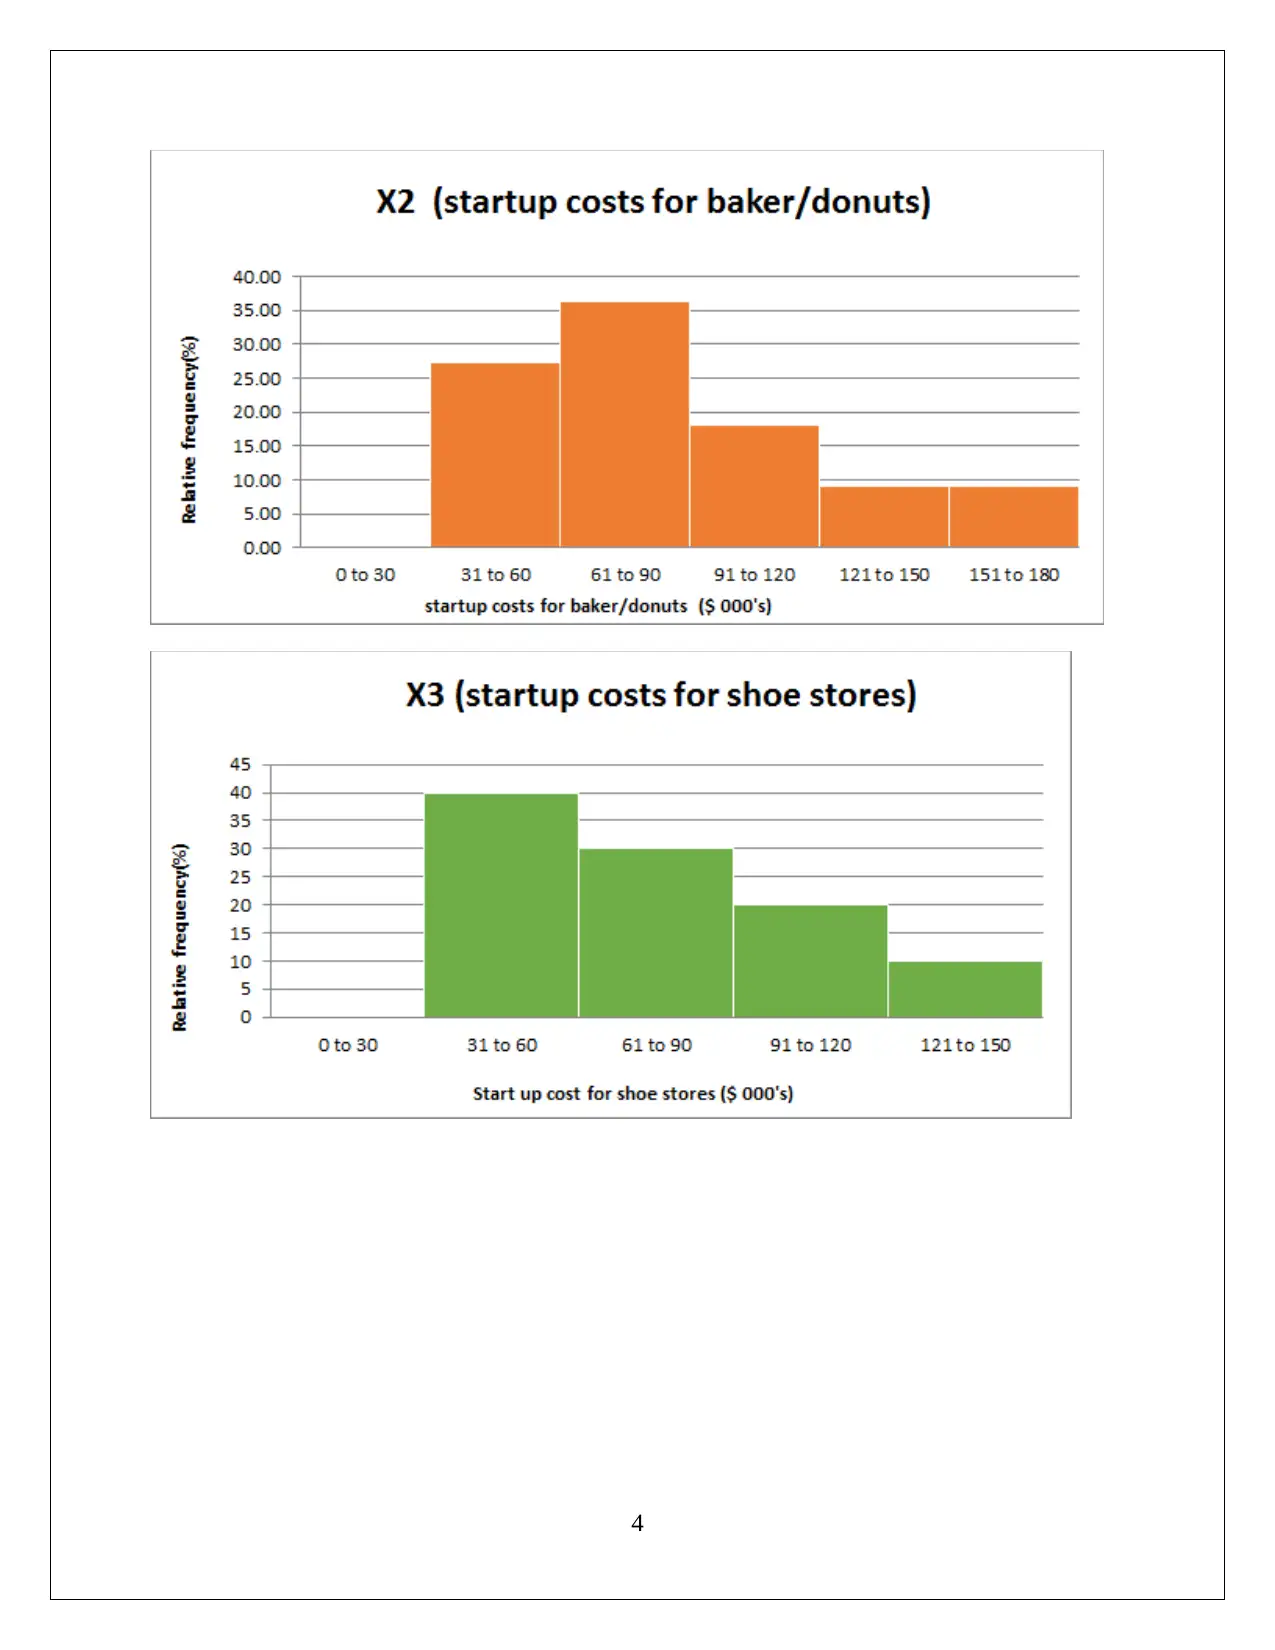
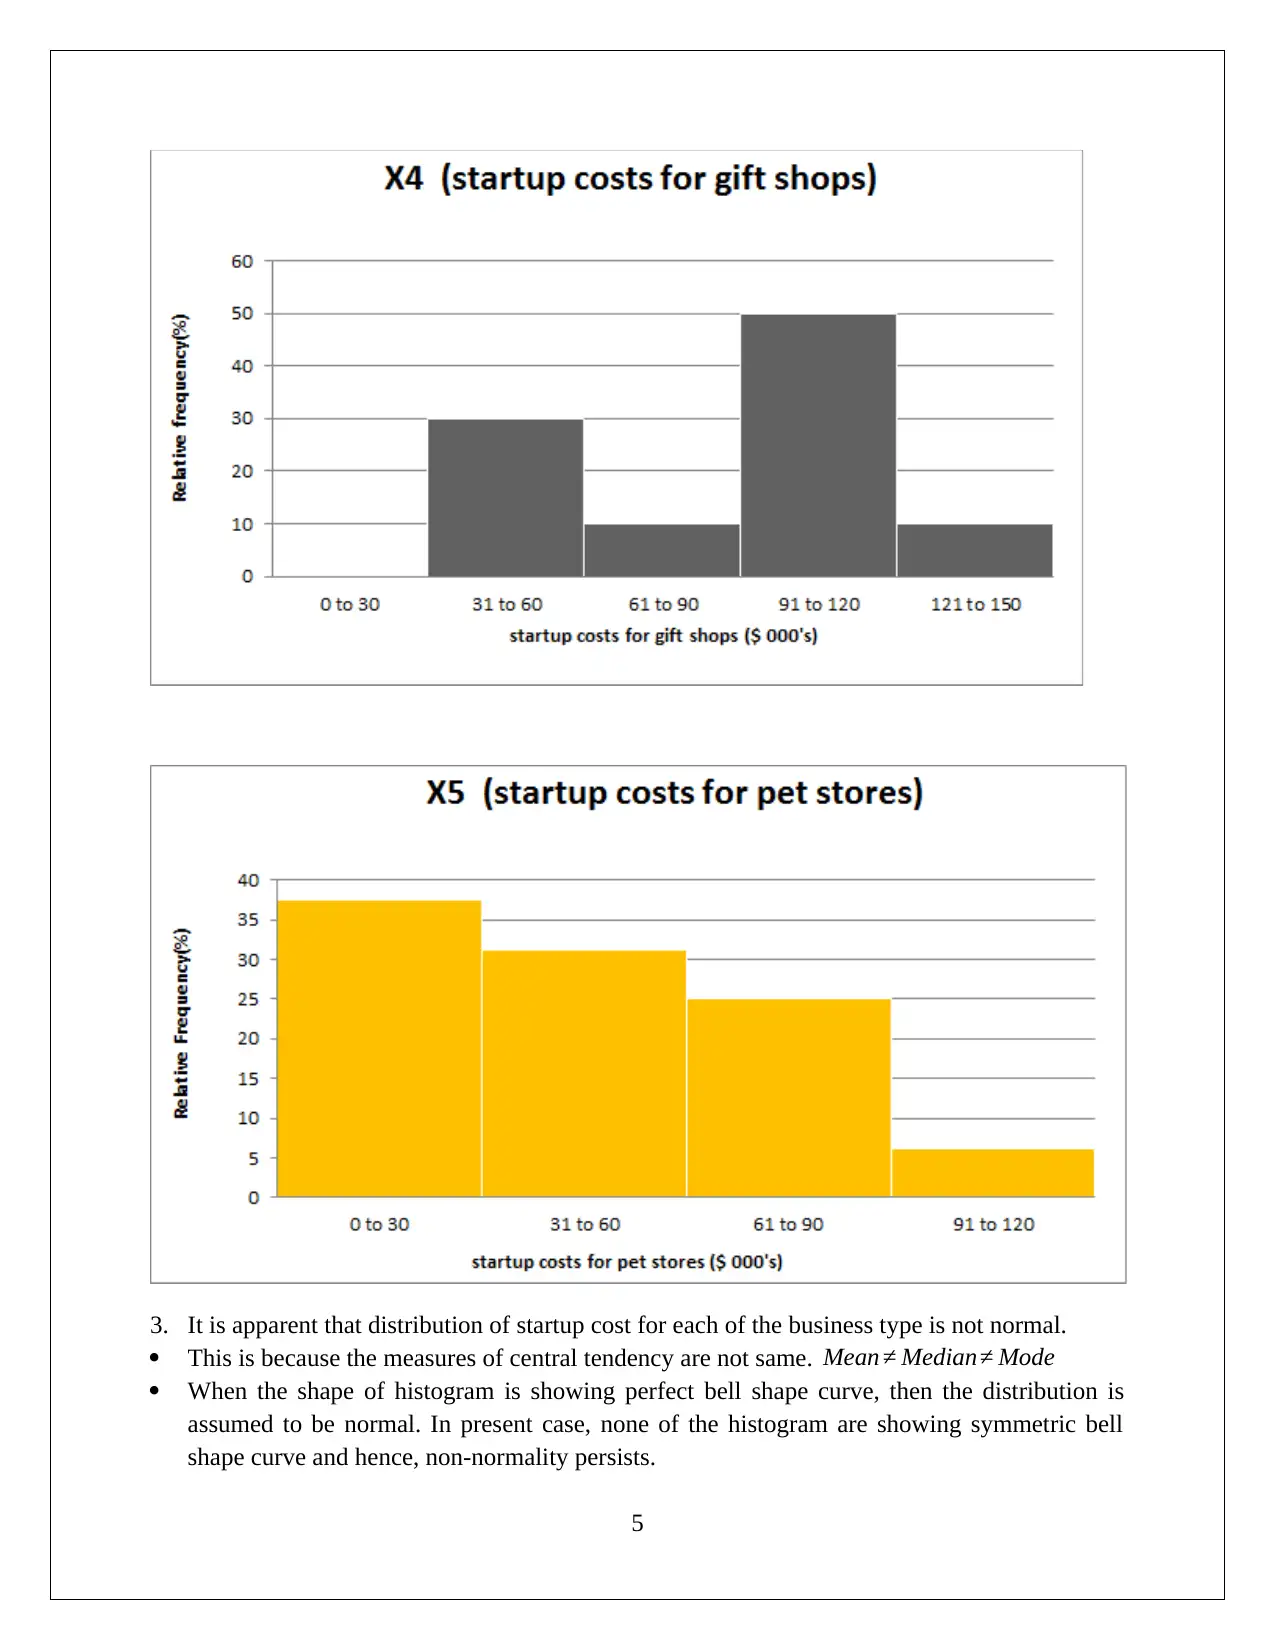
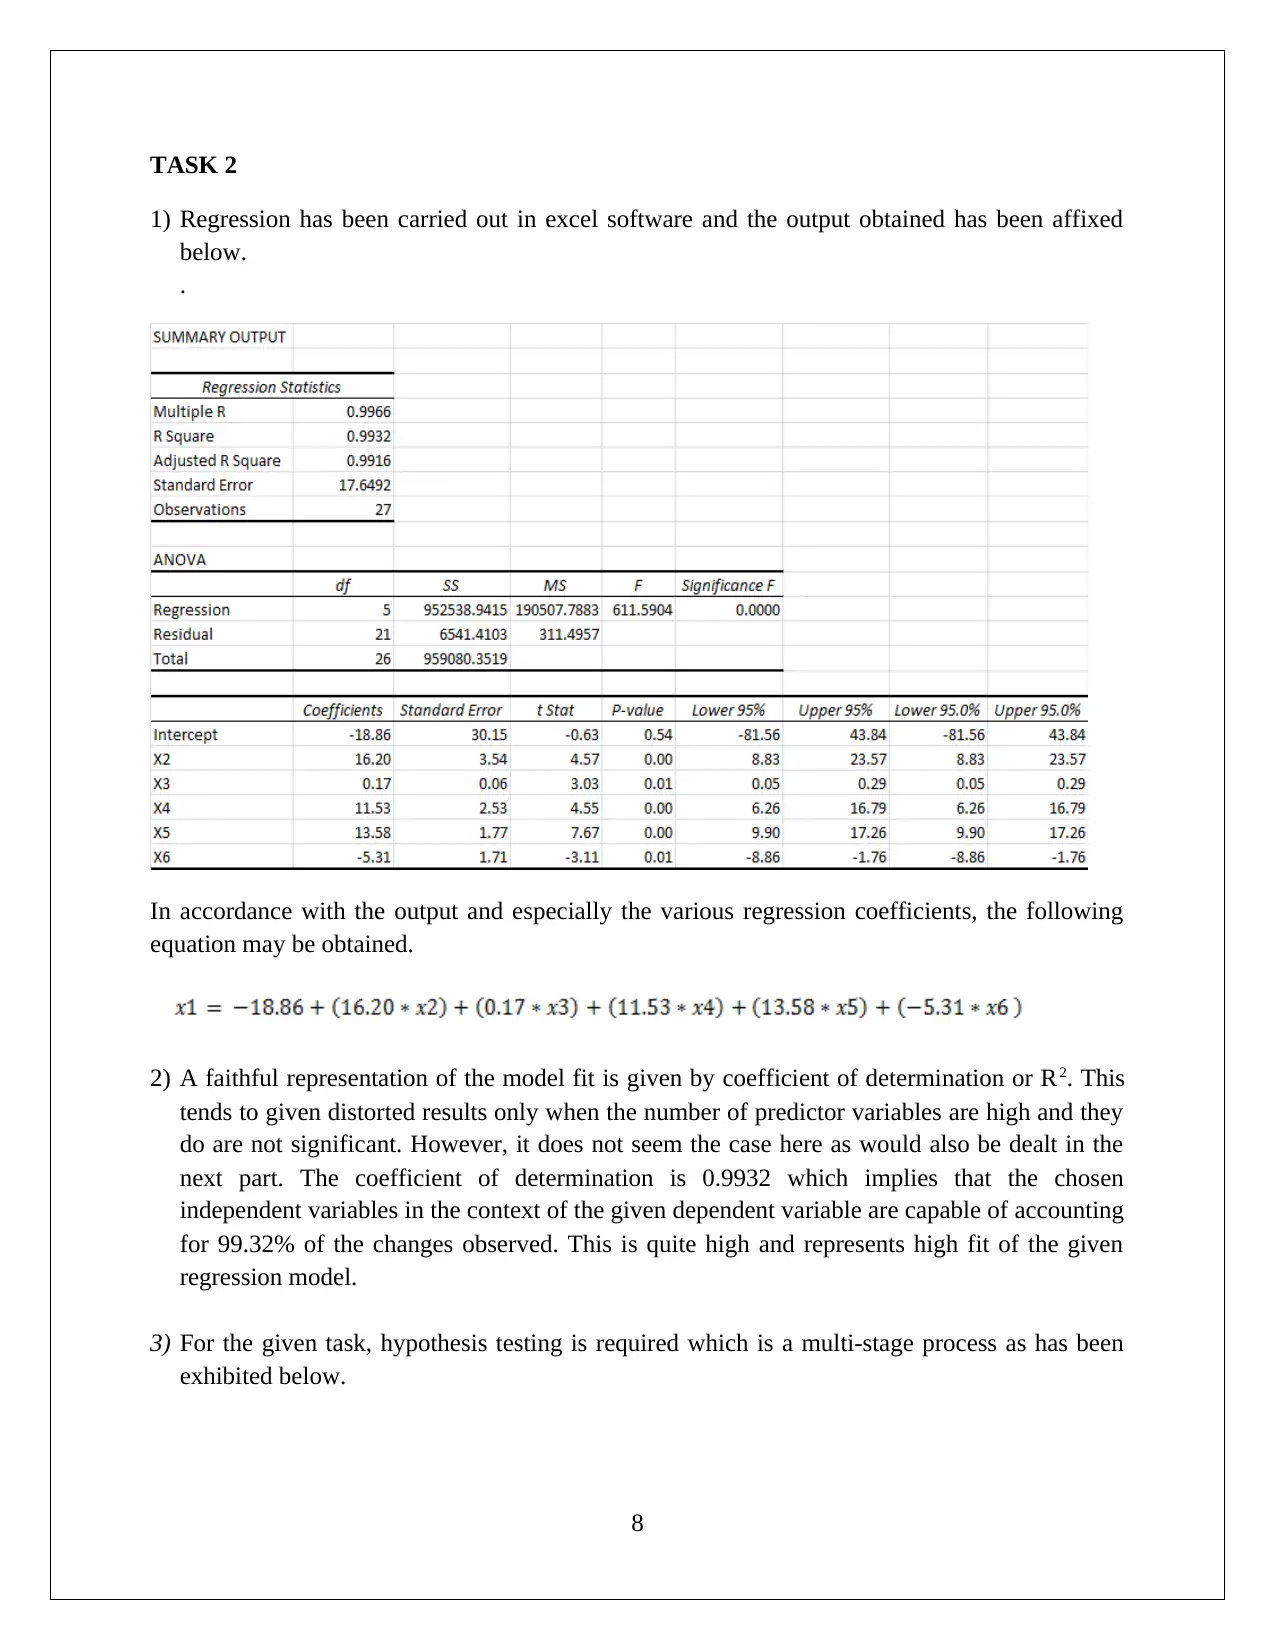
This statistics assignment solution provides a detailed analysis of startup costs and sales data. Task 1 focuses on descriptive statistics, including frequency distributions and histograms to assess the normality of the data for different business types. The solution includes hypothesis testing using ANOVA to compare average startup costs. Task 2 involves regression analysis, detailing the regression equation, coefficient of determination (R²), and hypothesis testing for the overall model and individual regression coefficients. The analysis interprets the coefficients, confidence intervals, and significance levels to determine the impact of various factors (franchise area, inventory levels, advertising spending, coverage families, and competing stores) on sales. The solution concludes with the validation of the regression model and the interpretation of the significant parameters.

STATISTICS
Student Id
[Pick the date]
Student Id
[Pick the date]
Paraphrase This Document
Need a fresh take? Get an instant paraphrase of this document with our AI Paraphraser

Task 1
1. Selected descriptive statistics
1
1. Selected descriptive statistics
1

2. (a) Requisite frequency distribution for given variables
2
2
⊘ This is a preview!⊘
Do you want full access?
Subscribe today to unlock all pages.

Trusted by 1+ million students worldwide

(b) Histogram has been made in excel for the class range and relative frequency of the
startup costs of the given business type.
3
startup costs of the given business type.
3
Paraphrase This Document
Need a fresh take? Get an instant paraphrase of this document with our AI Paraphraser

4

3. It is apparent that distribution of startup cost for each of the business type is not normal.
 This is because the measures of central tendency are not same. Mean ≠ Median≠ Mode
 When the shape of histogram is showing perfect bell shape curve, then the distribution is
assumed to be normal. In present case, none of the histogram are showing symmetric bell
shape curve and hence, non-normality persists.
5
⊘ This is a preview!⊘
Do you want full access?
Subscribe today to unlock all pages.

Trusted by 1+ million students worldwide

 Histograms are also representing long tail in either of the side which is the indication of
presence of skew in the data and hence, non-normal distribution. In both case of skew the
distribution of the data is assumed to be non-normal. In all the above highlighted histograms,
positive skew can be seen and hence, non-normal distribution of startup costs of the business
type. This is indicative of certain startup businesses that tend to have huge costs.
Also, the startup cost for the business is not same. This is because the frequency distribution is
different for different business type of the same class range. Based on the given histograms, it
seems that one of the lowest costs for store opening seems to be true for a pet shop which seems
viable at a cost of less than $ 30,000 whereas other given businesses cannot be opened for this
amount of money.
4. Hypothesis testing
Step 1
Hypotheses are highlighted below:
Step 2
For the given set of variables, the applied test is ANOVA single factor test. The excel output is
represented below:
ANOVA SINGLE FACTOR
6
Paraphrase This Document
Need a fresh take? Get an instant paraphrase of this document with our AI Paraphraser

Step 3
The value of F statistics = 3.2463
Corresponding p value = 0.0184
Significance level = 5% (0.05)
Step 4
Decision rule
According to the decision rule followed in hypothesis testing, it can be said that null hypothesis
would not be rejected when the p value corresponding to the test statistics is higher than level of
significance. Further, the case where the p value is lower than the level of significance, then
statistically evidence would be present to reject the null hypothesis. As a result of rejection of
null hypothesis, alternative hypothesis would be accepted. This decision rule is mainly based on
the level of significance because the rejection of null hypothesis is based on the level of
significance only.
Step 5
Result
It can be said that p value is not higher than significance level (p value < alpha) i.e. (0.0184 <
0.05) and therefore, sufficient evidence seems present to cause the rejection of null hypothesis.
Hence, alternative hypothesis would be accepted and thus, “the average startup cost for the
business type is not showing similar kind of pattern.”
7

TASK 2
1) Regression has been carried out in excel software and the output obtained has been affixed
below.
.
In accordance with the output and especially the various regression coefficients, the following
equation may be obtained.
2) A faithful representation of the model fit is given by coefficient of determination or R2. This
tends to given distorted results only when the number of predictor variables are high and they
do are not significant. However, it does not seem the case here as would also be dealt in the
next part. The coefficient of determination is 0.9932 which implies that the chosen
independent variables in the context of the given dependent variable are capable of accounting
for 99.32% of the changes observed. This is quite high and represents high fit of the given
regression model.
3) For the given task, hypothesis testing is required which is a multi-stage process as has been
exhibited below.
8
⊘ This is a preview!⊘
Do you want full access?
Subscribe today to unlock all pages.

Trusted by 1+ million students worldwide

Step 1: Formation of Hypothesis
Ho: The various slopes in the regression model lack significance and thereby there is zero
H1: All the slopes in the regression model do not lack significance and hence there is minimum
one predictor variable whose slope is non-zero.
Step 2: Significance Level
The level of significance for the hypothesis testing is assumed to be 5%.
Step 3: Test output
The approrpaite test for this hypothesis testing is ANOVA which has been outlined in the
regression output aleady and pasted as follows.
Step 4: Findings
The significance F has attained a value of 0.000. For the ANOVA, this is also called as p value.
If one compares the p value obtained above along with the significance level, it becomes
apparent that the lower value tends to be p value. Hence, in accordance with the p value method
of hypothesis testing, present evidence suggests rejection of H0 and acceptance of H1.
Step 5: Conclusion
The alternative hypothesis has been proved to be valid which hints at the given regression model
proving the underlying significance in statistical terms.
4) The various slope coefficients that have been indicated in the regression model need to be
interpreted which is carried out as follows.
 X2– For any franchise store of the company, an increase in the sales on annual basis to
the tune of $ 16.20 is expected to be experienced provided the area of the chosen
franchise is incremented by 1 square feet.
9
Paraphrase This Document
Need a fresh take? Get an instant paraphrase of this document with our AI Paraphraser

 X3- For any franchise store of the company, an increase in the sales on annual basis to
the tune of $ 0.17 is expected to be experienced provided the inventory levels of the
chosen franchise is incremented by $1.
 X4- For any franchise store of the company, an increase in the sales on annual basis to
the tune of $ 11.53 is expected to be experienced provided the advertising spending of the
chosen franchise is incremented by $1
 X5- For any franchise store of the company, an increase in the sales on annual basis to
the tune of $ 13..58 is expected to be experienced provided the coverage families of the
chosen franchise is incremented by 1 family.
 X6- For any franchise store of the company, an increase in the sales on annual basis to
the tune of $ 5,310 is expected to be experienced provided the competing stores of the
chosen franchise are decreased by one store.
5) The confidence interval for the regression coefficients have been derived from the regression
output and presented in the following table. They lower and higher limits of the interval have
been highlighted.
6) For the given task, hypothesis testing is required which is a multi-stage process as has been
exhibited below.
Step 1: Formation of Hypothesis
Ho: The slope for the given coefficient in the regression model lacks significance and thereby
there is zero
H1: The slope for the given coefficient in the regression model does not lack significance and
thereby it is not zero
Step 2: Significance Level
The level of significance for the hypothesis testing is assumed to be 5%.
Step 3: Test output
The relevant output for facilitating the hypothesis testing is shown below.
10

Step 4: Findings
X2 slope - If one compares the p value obtained above along with the significance level, it
becomes apparent that the lower value tends to be p value. Hence, in accordance with the p value
method of hypothesis testing, present evidence suggests rejection of H0 and acceptance of H1.
X3 slope - If one compares the p value obtained above along with the significance level, it
becomes apparent that the lower value tends to be p value. Hence, in accordance with the p value
method of hypothesis testing, present evidence suggests rejection of H0 and acceptance of H1.
X4 slope - If one compares the p value obtained above along with the significance level, it
becomes apparent that the lower value tends to be p value. Hence, in accordance with the p value
method of hypothesis testing, present evidence suggests rejection of H0 and acceptance of H1.
X5 slope - If one compares the p value obtained above along with the significance level, it
becomes apparent that the lower value tends to be p value. Hence, in accordance with the p value
method of hypothesis testing, present evidence suggests rejection of H0 and acceptance of H1.
X6 slope - If one compares the p value obtained above along with the significance level, it
becomes apparent that the lower value tends to be p value. Hence, in accordance with the p value
method of hypothesis testing, present evidence suggests rejection of H0 and acceptance of H1.
Step 5: Conclusion
The alternative hypothesis has been proved to be valid which hints at the given regression model
slopes proving the underlying significance in statistical terms.
7) There would have been a case to introduce modifications in the model if any of the slopes
would have proved to be insignificant. Hence, in wake of the significance of all parameters,
no alternation is suggested and the same model as predicted earlier is retained.
8) The computation of the sales for the given inputs is carried out as follows.
11
⊘ This is a preview!⊘
Do you want full access?
Subscribe today to unlock all pages.

Trusted by 1+ million students worldwide
1 out of 12
Related Documents

Your All-in-One AI-Powered Toolkit for Academic Success.
+13062052269
info@desklib.com
Available 24*7 on WhatsApp / Email
Unlock your academic potential
Copyright © 2020–2025 A2Z Services. All Rights Reserved. Developed and managed by ZUCOL.


