Statistics for Business 161.101: Assignment 3 Analysis

Verified

Added on  2022/08/21

|8
|1142
|21
Homework Assignment
AI Summary
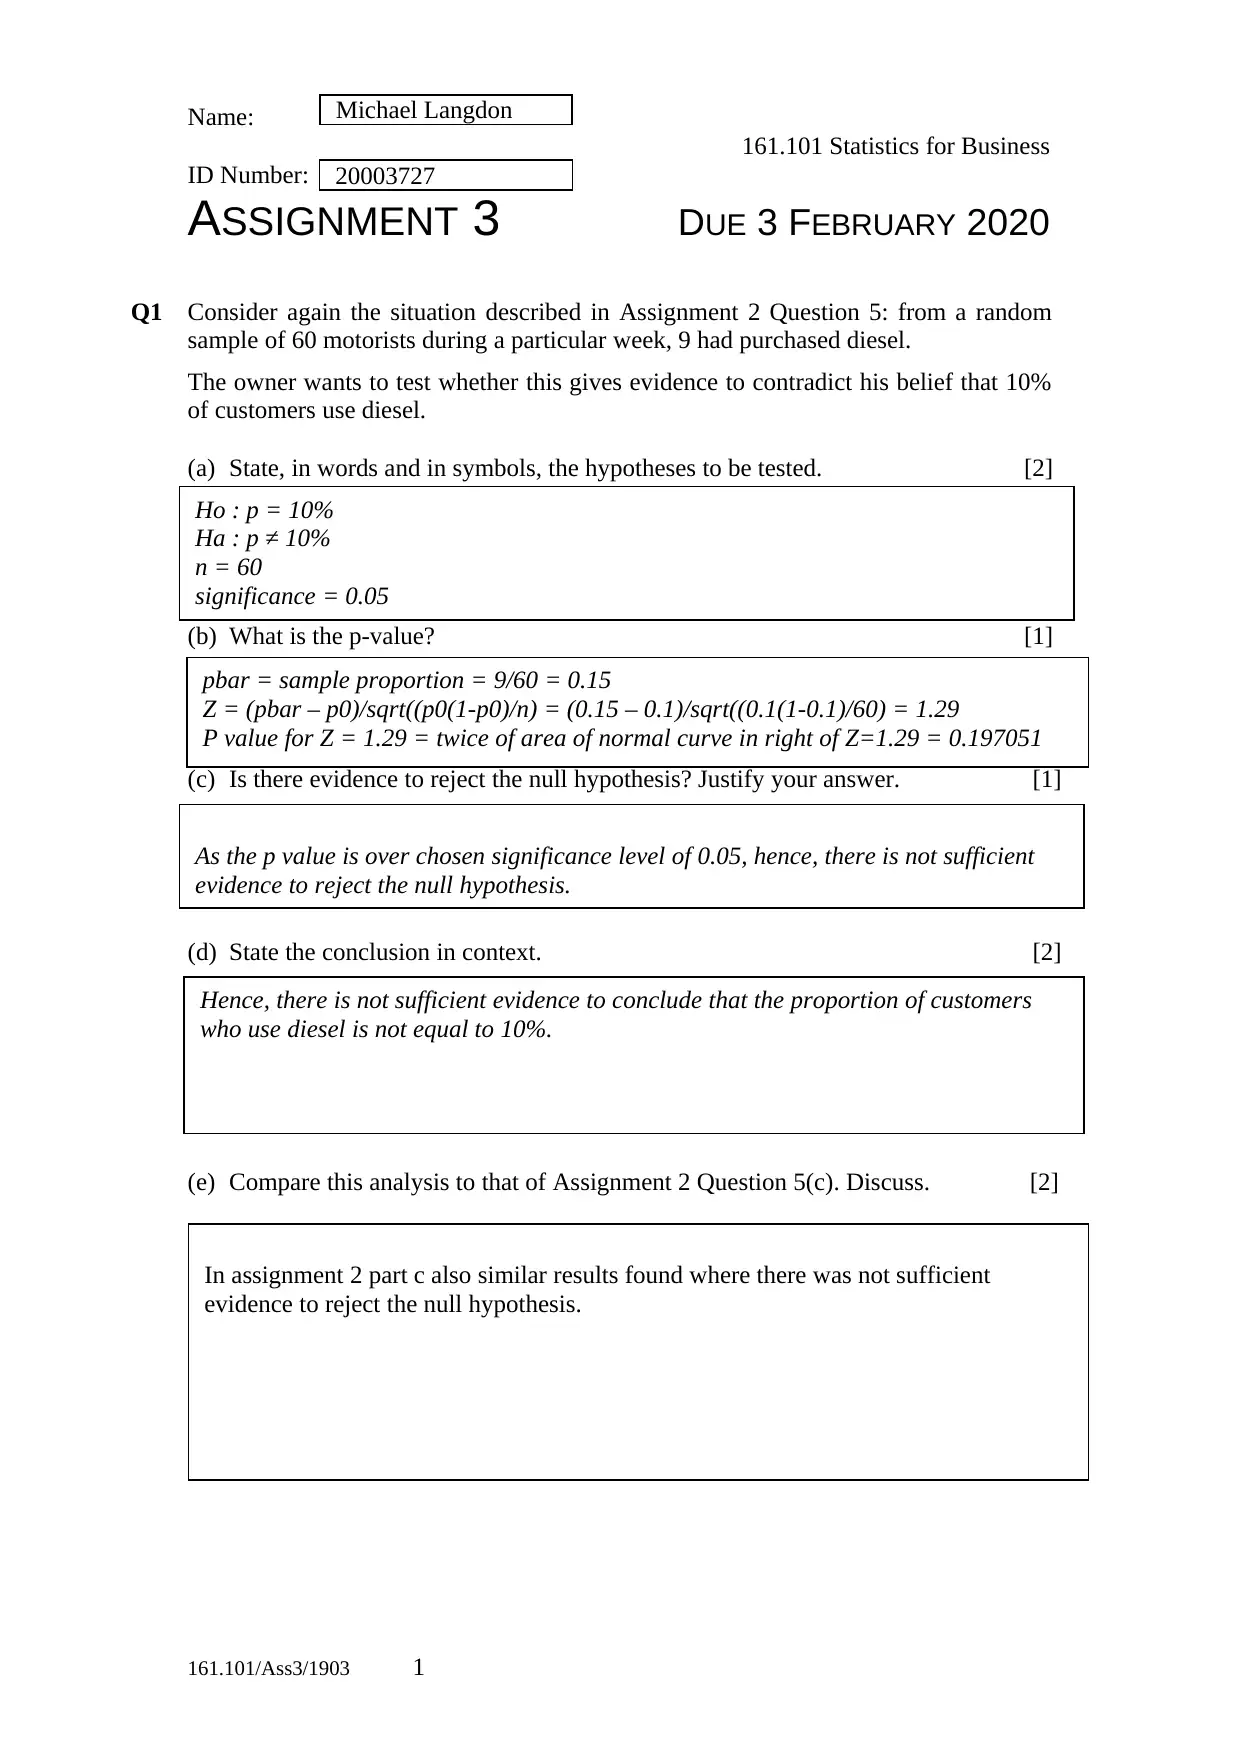
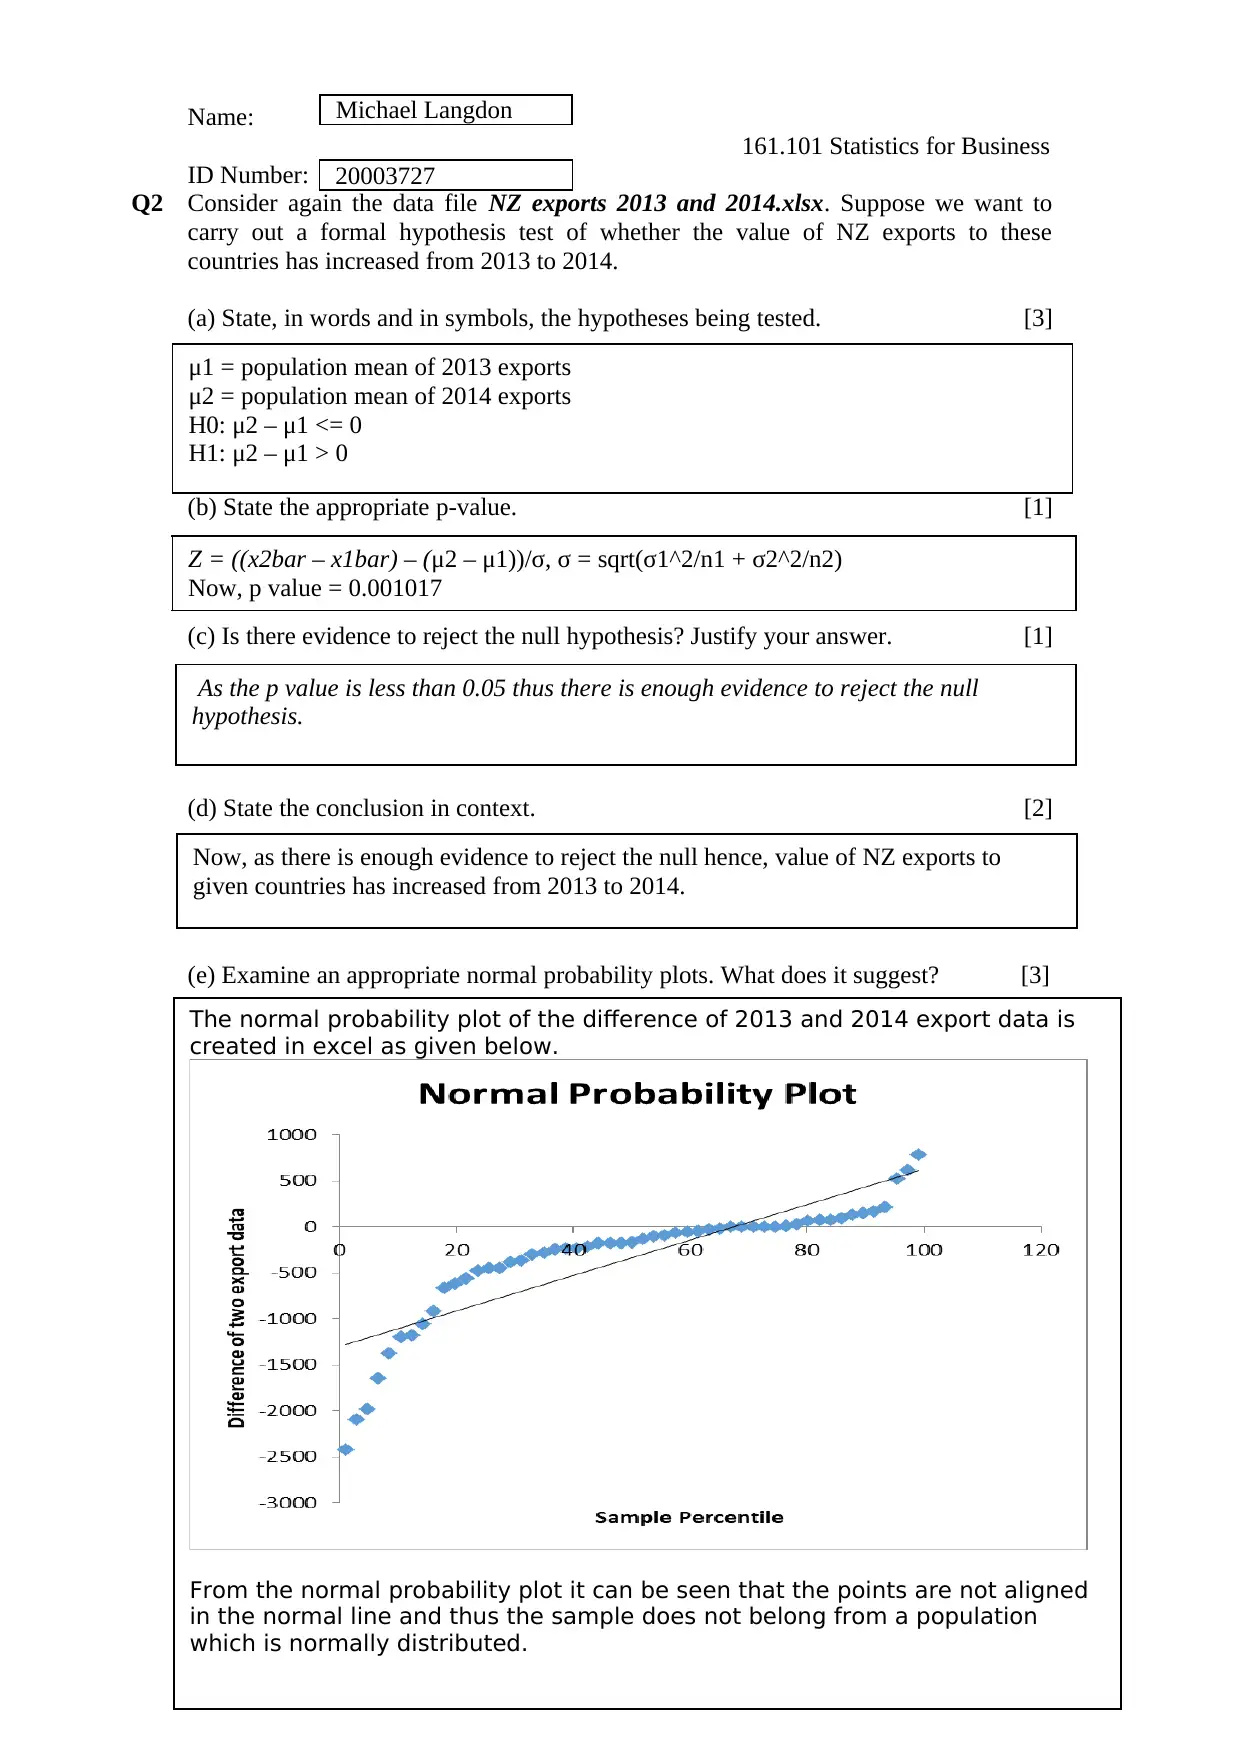
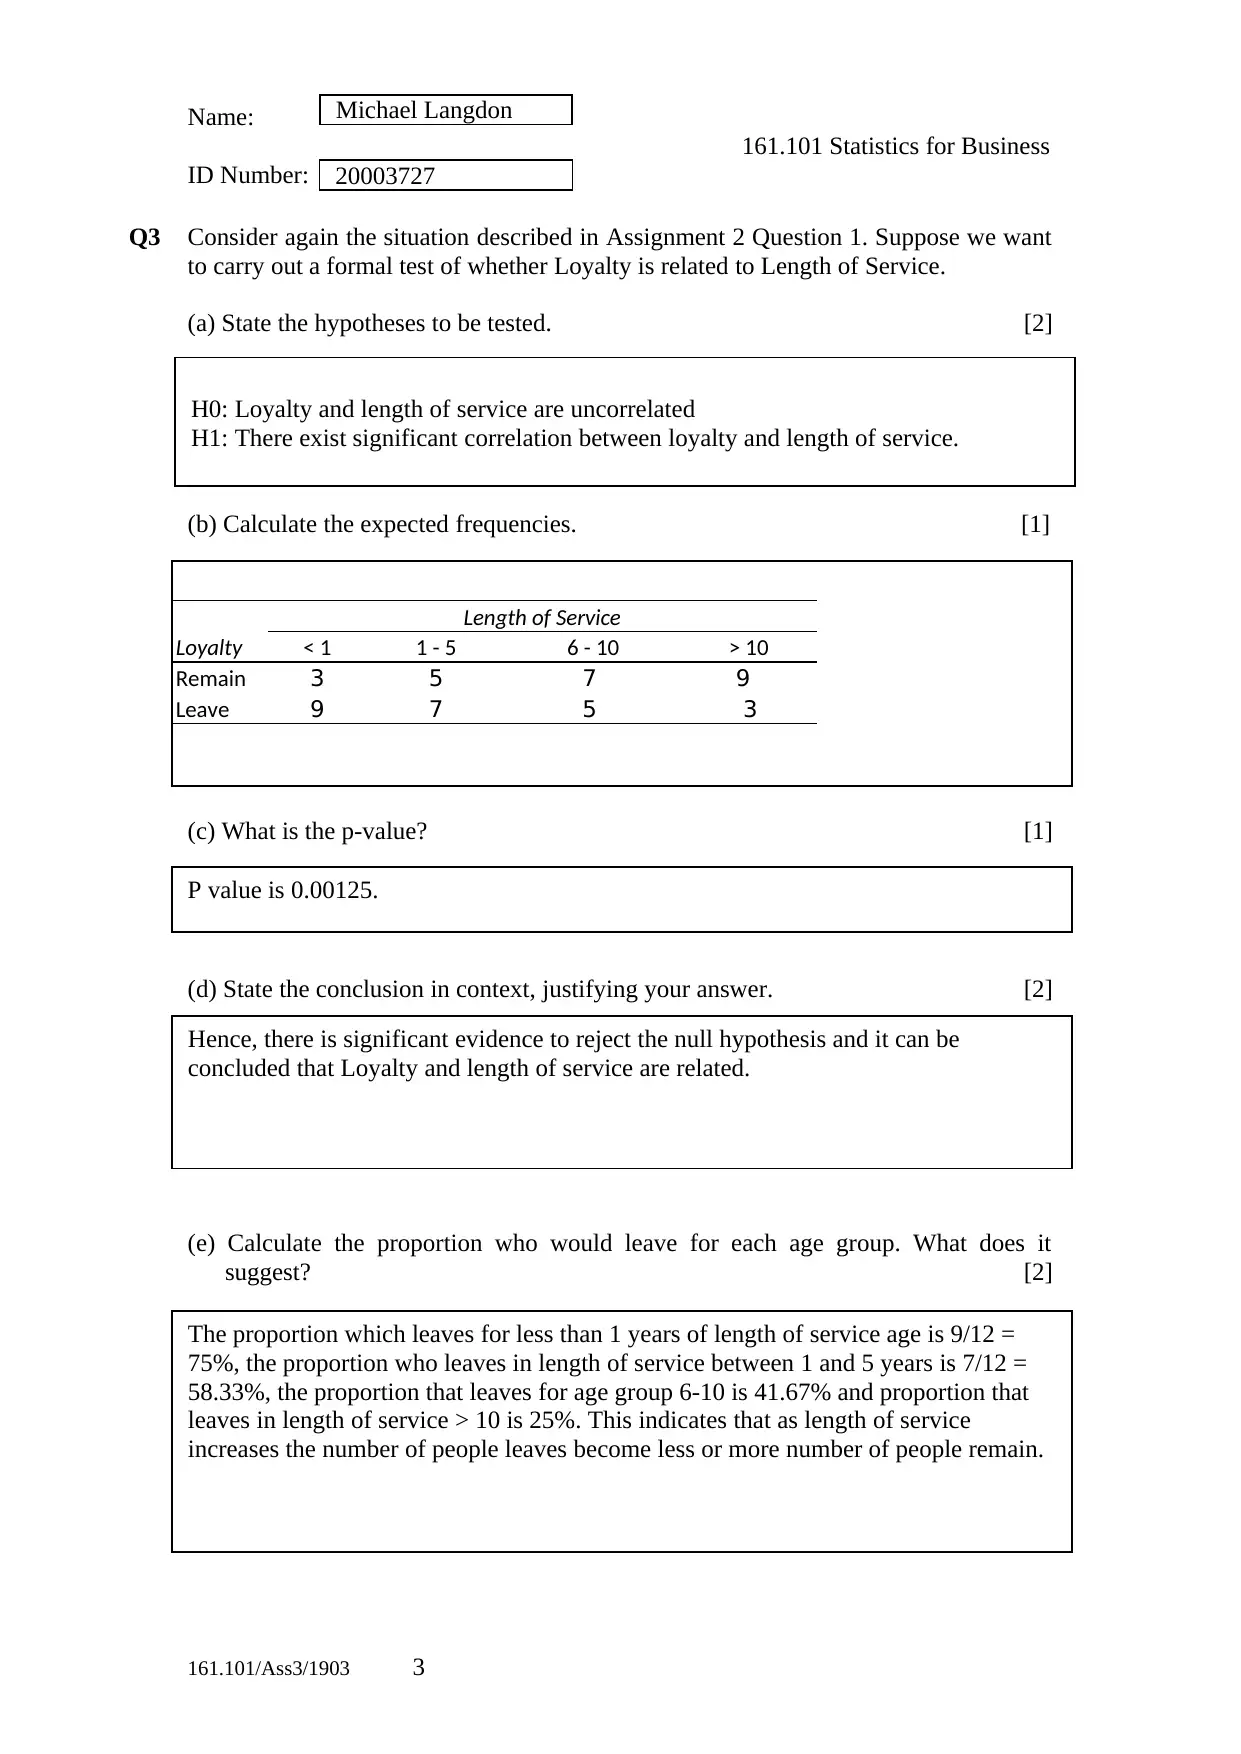
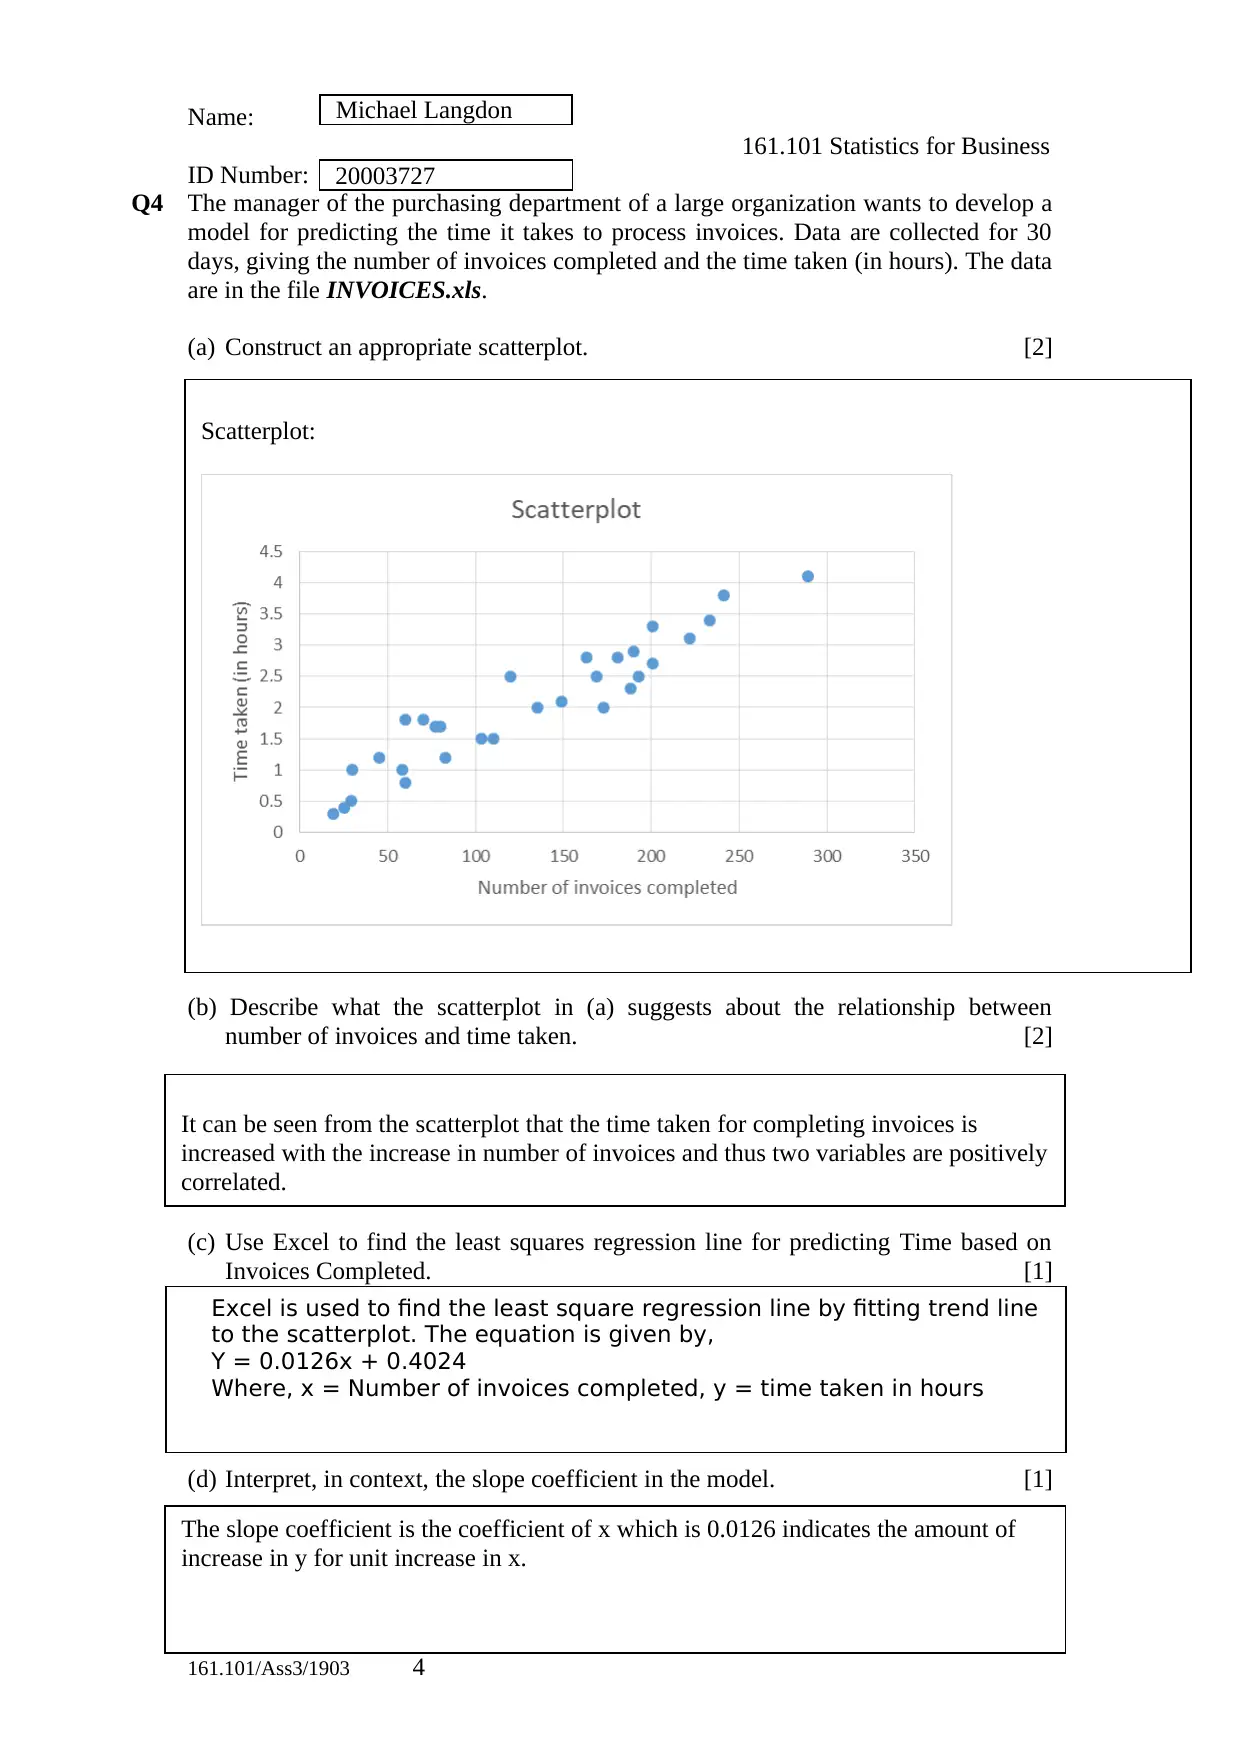
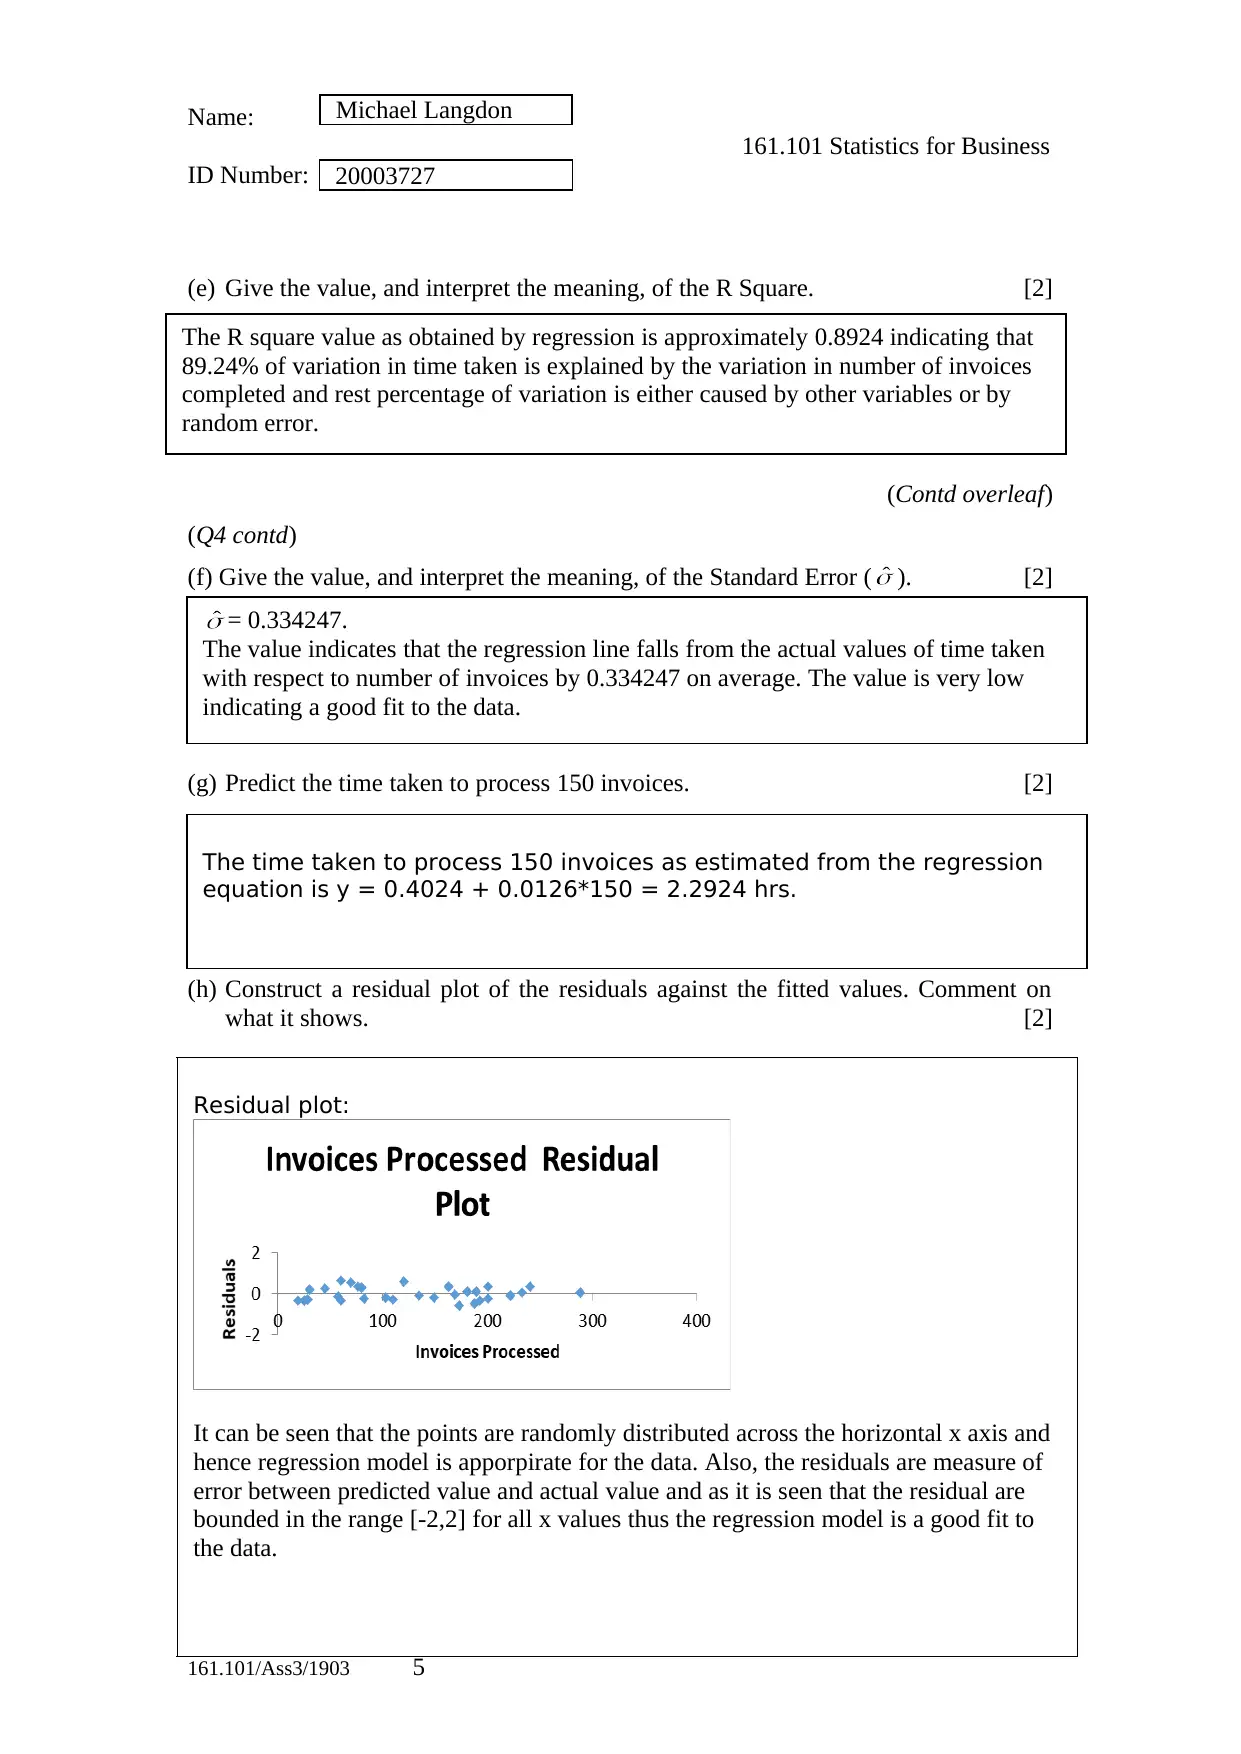
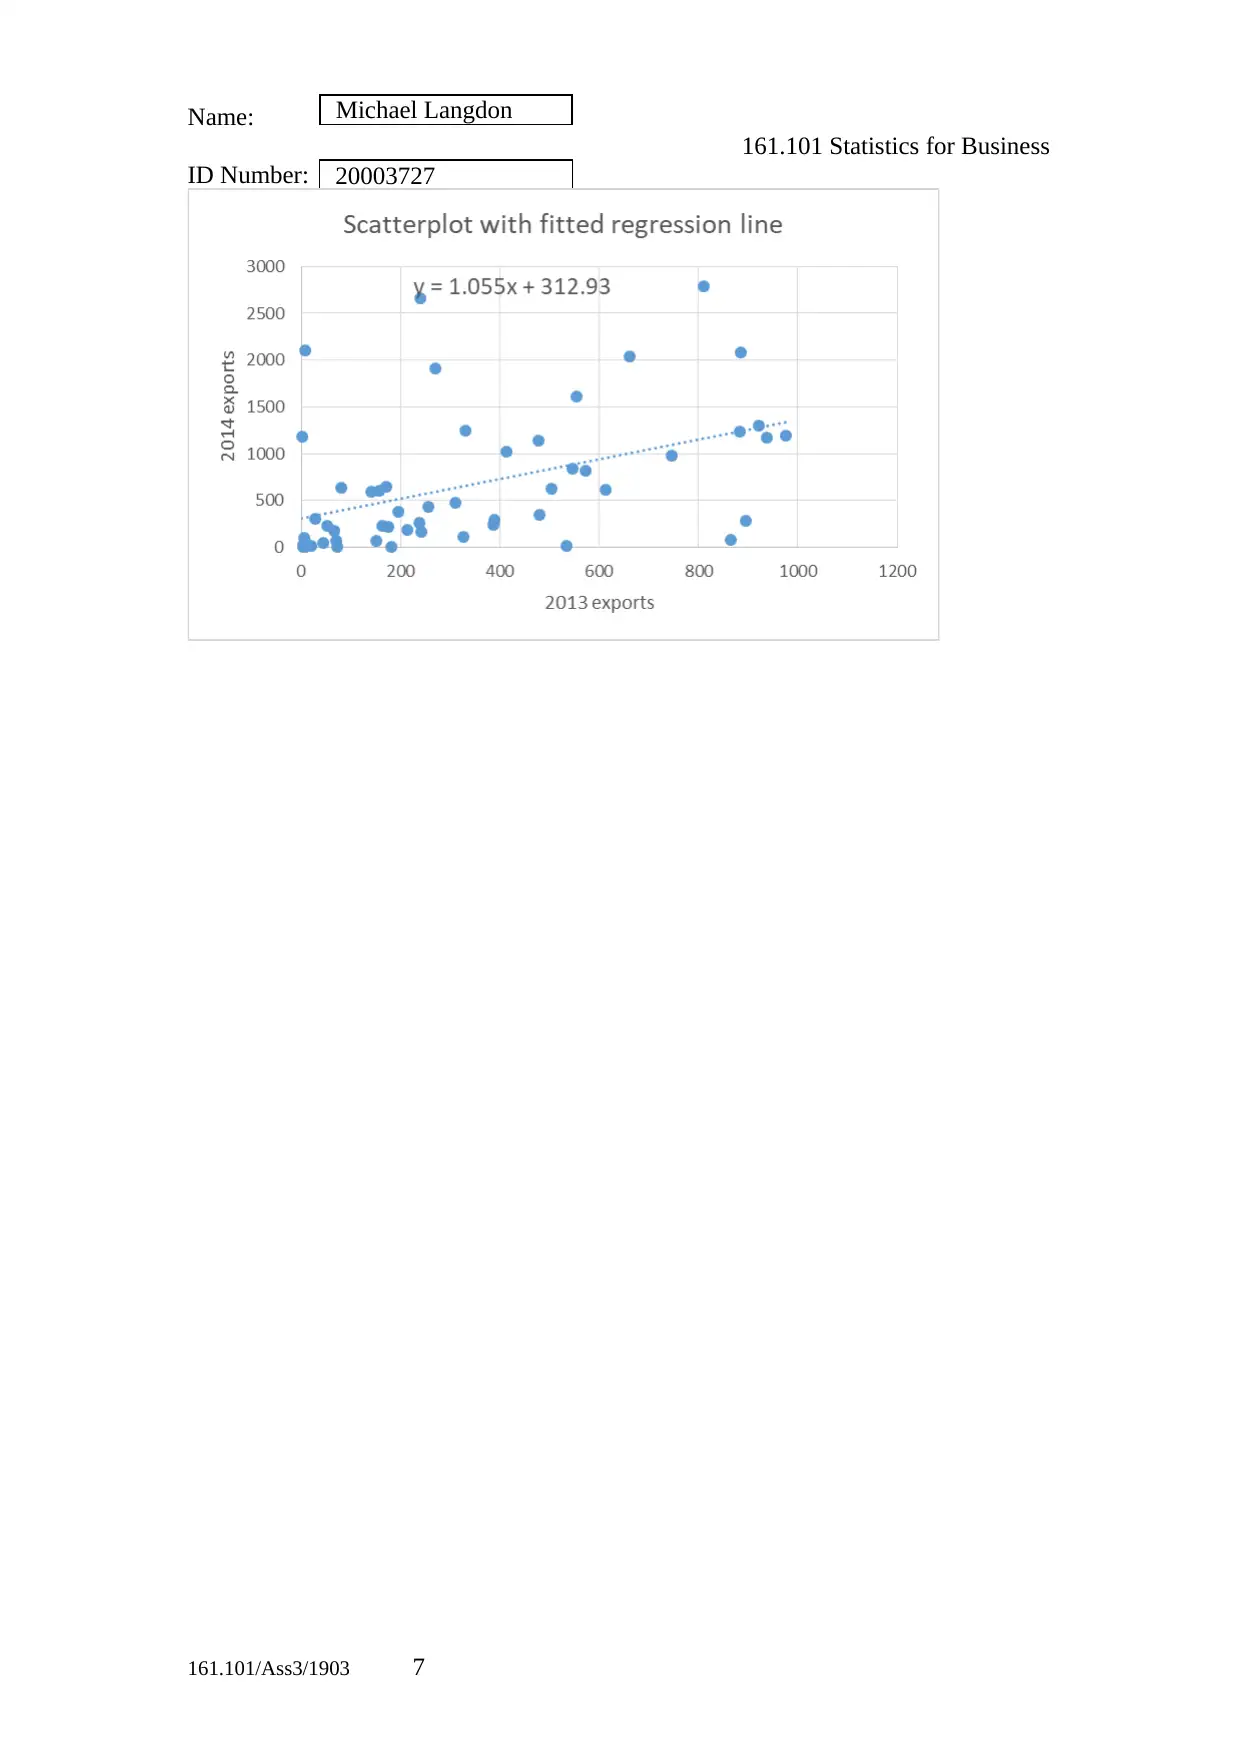
This document presents a comprehensive solution to Statistics for Business Assignment 3, addressing various statistical concepts and techniques. The assignment involves hypothesis testing related to customer diesel usage, analysis of NZ export data using hypothesis tests, and an investigation of the relationship between loyalty and length of service. Furthermore, the assignment includes a regression analysis of invoice processing data, exploring the relationship between the number of invoices and the time taken for processing, with interpretations of the regression coefficients, R-squared value, and standard error. The document provides detailed solutions to each question, including Excel outputs, calculations, interpretations, and conclusions, offering a thorough analysis of the statistical problems and their business implications.
Document Page
Michael Langdon
20003727
Name:
161.101 Statistics for Business
ID Number:
ASSIGNMENT 3 DUE 3 FEBRUARY 2020
Q1 Consider again the situation described in Assignment 2 Question 5: from a random
sample of 60 motorists during a particular week, 9 had purchased diesel.
The owner wants to test whether this gives evidence to contradict his belief that 10%
of customers use diesel.
(a) State, in words and in symbols, the hypotheses to be tested. [2]
(b) What is the p-value? [1]
(c) Is there evidence to reject the null hypothesis? Justify your answer. [1]
(d) State the conclusion in context. [2]
(e) Compare this analysis to that of Assignment 2 Question 5(c). Discuss. [2]
161.101/Ass3/1903 1
Ho : p = 10%
Ha : p ≠ 10%
n = 60
significance = 0.05
pbar = sample proportion = 9/60 = 0.15
Z = (pbar – p0)/sqrt((p0(1-p0)/n) = (0.15 – 0.1)/sqrt((0.1(1-0.1)/60) = 1.29
P value for Z = 1.29 = twice of area of normal curve in right of Z=1.29 = 0.197051
As the p value is over chosen significance level of 0.05, hence, there is not sufficient
evidence to reject the null hypothesis.
Hence, there is not sufficient evidence to conclude that the proportion of customers
who use diesel is not equal to 10%.
In assignment 2 part c also similar results found where there was not sufficient
evidence to reject the null hypothesis.
tabler-icon-diamond-filled.svg

Secure Best Marks with AI Grader

Need help grading? Try our AI Grader for instant feedback on your assignments.
Document Page
Michael Langdon
20003727
Name:
161.101 Statistics for Business
ID Number:
Q2 Consider again the data file NZ exports 2013 and 2014.xlsx. Suppose we want to
carry out a formal hypothesis test of whether the value of NZ exports to these
countries has increased from 2013 to 2014.
(a) State, in words and in symbols, the hypotheses being tested. [3]
(b) State the appropriate p-value. [1]
(c) Is there evidence to reject the null hypothesis? Justify your answer. [1]
(d) State the conclusion in context. [2]
(e) Examine an appropriate normal probability plots. What does it suggest? [3]
161.101/Ass3/1903 2
μ1 = population mean of 2013 exports
μ2 = population mean of 2014 exports
H0: μ2 – μ1 <= 0
H1: μ2 – μ1 > 0
Z = ((x2bar – x1bar) – (μ2 – μ1))/σ, σ = sqrt(σ1^2/n1 + σ2^2/n2)
Now, p value = 0.001017
As the p value is less than 0.05 thus there is enough evidence to reject the null
hypothesis.
Now, as there is enough evidence to reject the null hence, value of NZ exports to
given countries has increased from 2013 to 2014.
The normal probability plot of the difference of 2013 and 2014 export data is
created in excel as given below.
From the normal probability plot it can be seen that the points are not aligned
in the normal line and thus the sample does not belong from a population
which is normally distributed.
Document Page
Michael Langdon
20003727
Name:
161.101 Statistics for Business
ID Number:
Q3 Consider again the situation described in Assignment 2 Question 1. Suppose we want
to carry out a formal test of whether Loyalty is related to Length of Service.
(a) State the hypotheses to be tested. [2]
(b) Calculate the expected frequencies. [1]
(c) What is the p-value? [1]
(d) State the conclusion in context, justifying your answer. [2]
(e) Calculate the proportion who would leave for each age group. What does it
suggest? [2]
161.101/Ass3/1903 3
H0: Loyalty and length of service are uncorrelated
H1: There exist significant correlation between loyalty and length of service.
Length of Service
Loyalty < 1 1 - 5 6 - 10 > 10
Remain 3 5 7 9
Leave 9 7 5 3
P value is 0.00125.
Hence, there is significant evidence to reject the null hypothesis and it can be
concluded that Loyalty and length of service are related.
The proportion which leaves for less than 1 years of length of service age is 9/12 =
75%, the proportion who leaves in length of service between 1 and 5 years is 7/12 =
58.33%, the proportion that leaves for age group 6-10 is 41.67% and proportion that
leaves in length of service > 10 is 25%. This indicates that as length of service
increases the number of people leaves become less or more number of people remain.
Document Page
Michael Langdon
20003727
Name:
161.101 Statistics for Business
ID Number:
Q4 The manager of the purchasing department of a large organization wants to develop a
model for predicting the time it takes to process invoices. Data are collected for 30
days, giving the number of invoices completed and the time taken (in hours). The data
are in the file INVOICES.xls.
(a) Construct an appropriate scatterplot. [2]
(b) Describe what the scatterplot in (a) suggests about the relationship between
number of invoices and time taken. [2]
(c) Use Excel to find the least squares regression line for predicting Time based on
Invoices Completed. [1]
(d) Interpret, in context, the slope coefficient in the model. [1]
161.101/Ass3/1903 4
Scatterplot:
It can be seen from the scatterplot that the time taken for completing invoices is
increased with the increase in number of invoices and thus two variables are positively
correlated.
Excel is used to find the least square regression line by fitting trend line
to the scatterplot. The equation is given by,
Y = 0.0126x + 0.4024
Where, x = Number of invoices completed, y = time taken in hours
The slope coefficient is the coefficient of x which is 0.0126 indicates the amount of
increase in y for unit increase in x.
tabler-icon-diamond-filled.svg

Secure Best Marks with AI Grader

Need help grading? Try our AI Grader for instant feedback on your assignments.
Document Page
Michael Langdon
20003727
Name:
161.101 Statistics for Business
ID Number:
(e) Give the value, and interpret the meaning, of the R Square. [2]
(Contd overleaf)
(Q4 contd)
(f) Give the value, and interpret the meaning, of the Standard Error ( ). [2]
(g) Predict the time taken to process 150 invoices. [2]
(h) Construct a residual plot of the residuals against the fitted values. Comment on
what it shows. [2]
161.101/Ass3/1903 5
The R square value as obtained by regression is approximately 0.8924 indicating that
89.24% of variation in time taken is explained by the variation in number of invoices
completed and rest percentage of variation is either caused by other variables or by
random error.
= 0.334247.
The value indicates that the regression line falls from the actual values of time taken
with respect to number of invoices by 0.334247 on average. The value is very low
indicating a good fit to the data.
The time taken to process 150 invoices as estimated from the regression
equation is y = 0.4024 + 0.0126*150 = 2.2924 hrs.
Residual plot:
It can be seen that the points are randomly distributed across the horizontal x axis and
hence regression model is apporpirate for the data. Also, the residuals are measure of
error between predicted value and actual value and as it is seen that the residual are
bounded in the range [-2,2] for all x values thus the regression model is a good fit to
the data.
Document Page
Michael Langdon
20003727
Name:
161.101 Statistics for Business
ID Number:
(i) How strong is the evidence for a relationship between Time and Invoices
Completed ? [1]
Q5 Extension Question – this is not compulsory, and carries no extra marks this
time. But it is an opportunity to test your knowledge against a more challenging
question.
Refer back to the data in the file NZ exports 2013 and 2014.xlsx. Use regression
analysis to address the question of whether the value of NZ exports to these countries
has increased from 2013 to 2014. Discuss the main differences between this and the
approach taken in Question 2 of this assignment. Which seems more appropriate?
Now, by using regression analysis it can also be found whether the exports are
increased from 2013 to 2014. This is done by first plotting a scatterplot with 2014
exports against 2013 exports in x axis. As it can be seen from the slope of the line is
positive and the intercept is also very large positive thus for every 2013 value, the
2014 value is bound to be more than 2013 value. This indicates that on an average the
2014 export is more than 2013 exports or the exports are increased in 2014 from
2013. This is also evident from the significant F value in the Anova table of
regression output indicating the two means are significantly different. This method is
not good for comparing because no estimate of sample means are provided in
regression and also when the means are significantly different then that cannot
realized from the regression line or equation.
Scatterplot:
161.101/Ass3/1903 6
The strength of the relationship between time and invoices completed is very strong
and positive as indicated from the scatter plot. The exact measure of strength can be
obtained by the value of correlation coefficient, which is given by multiple R value
approximately as 0.9447. This confirms the strong positive correlation between the
variables as the value is very close to 1.
Document Page
Michael Langdon
20003727
Name:
161.101 Statistics for Business
ID Number:
161.101/Ass3/1903 7
tabler-icon-diamond-filled.svg

Paraphrase This Document

Need a fresh take? Get an instant paraphrase of this document with our AI Paraphraser
Document Page
Michael Langdon
20003727
Name:
161.101 Statistics for Business
ID Number:
+ + + + + +
161.101/Ass3/1903 8
chevron_up_icon
1 out of 8
circle_padding
hide_on_mobile
zoom_out_icon
logo.png

Your All-in-One AI-Powered Toolkit for Academic Success.

Available 24*7 on WhatsApp / Email

[object Object]