Statistics Assignment: Calculating and Interpreting Statistics

Verified

Added on  2019/09/22

|2
|284
|259
Homework Assignment
AI Summary
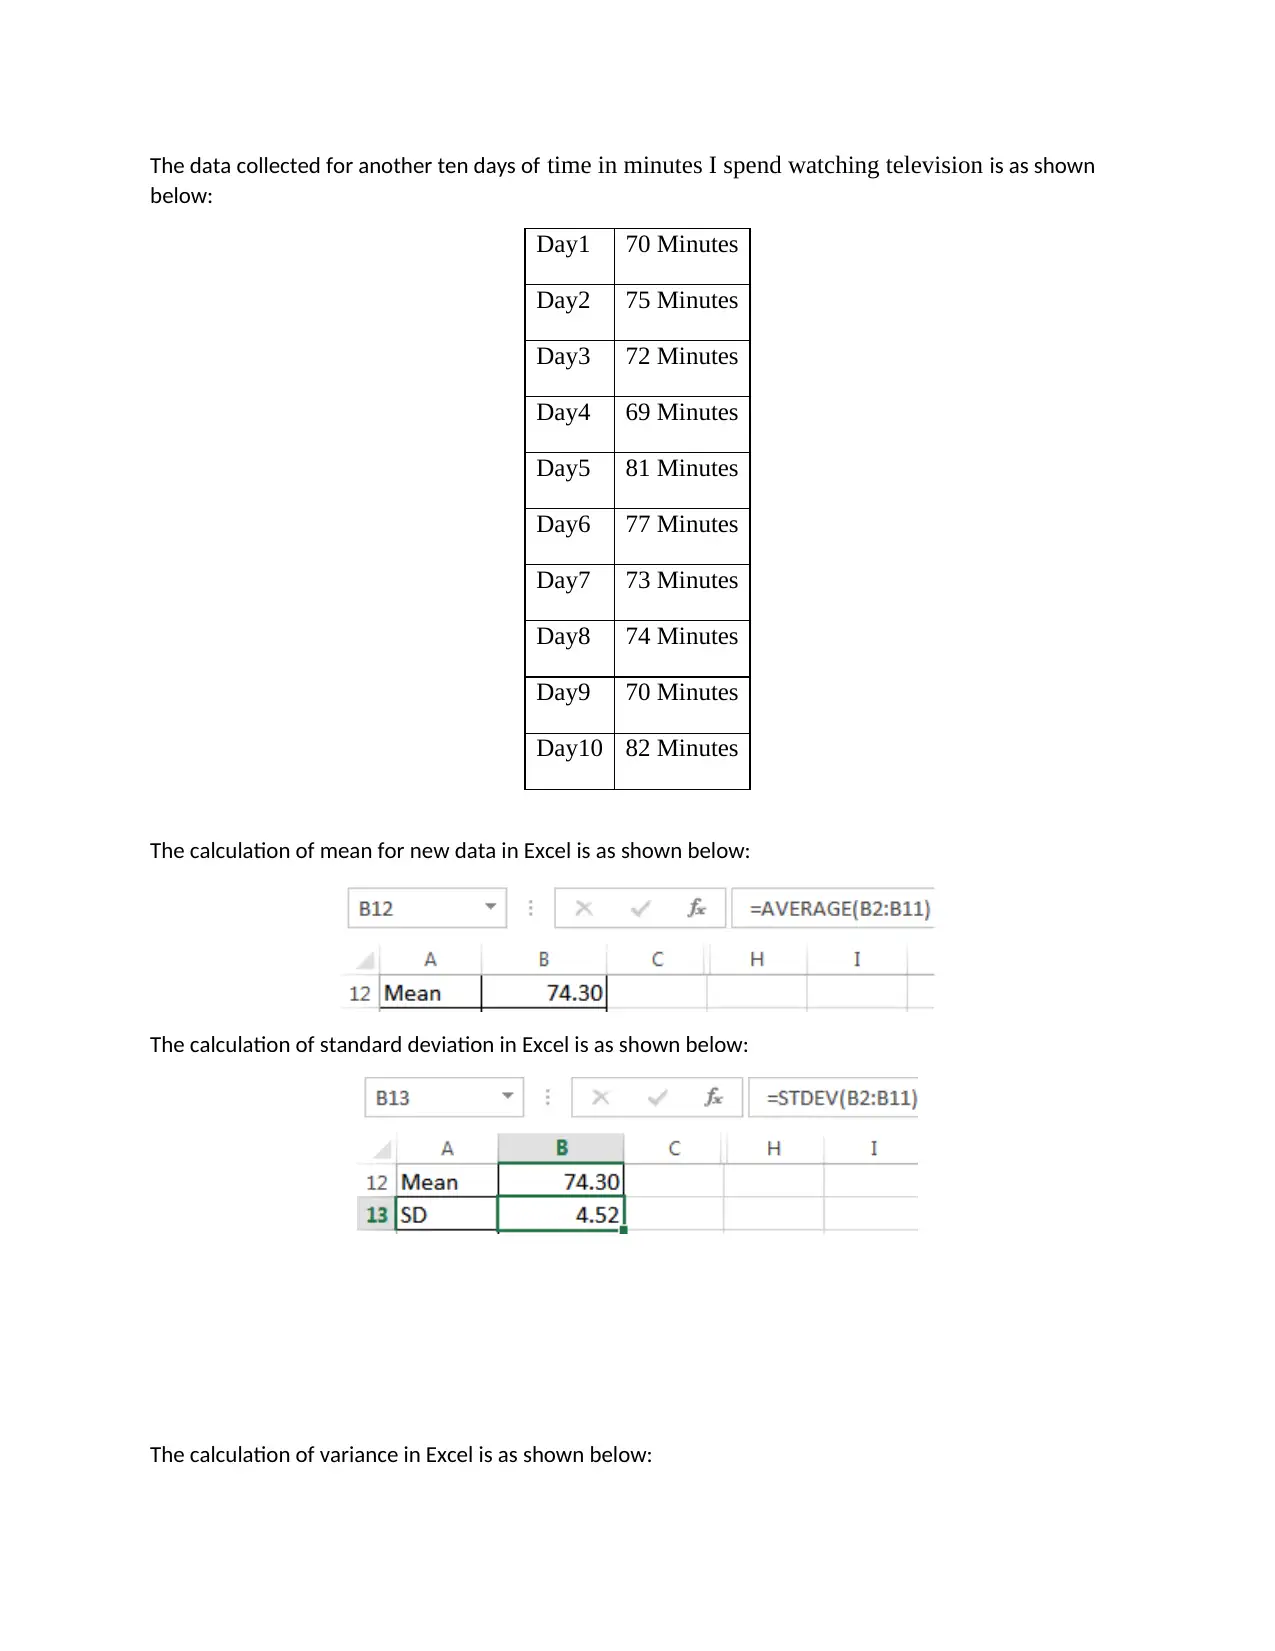
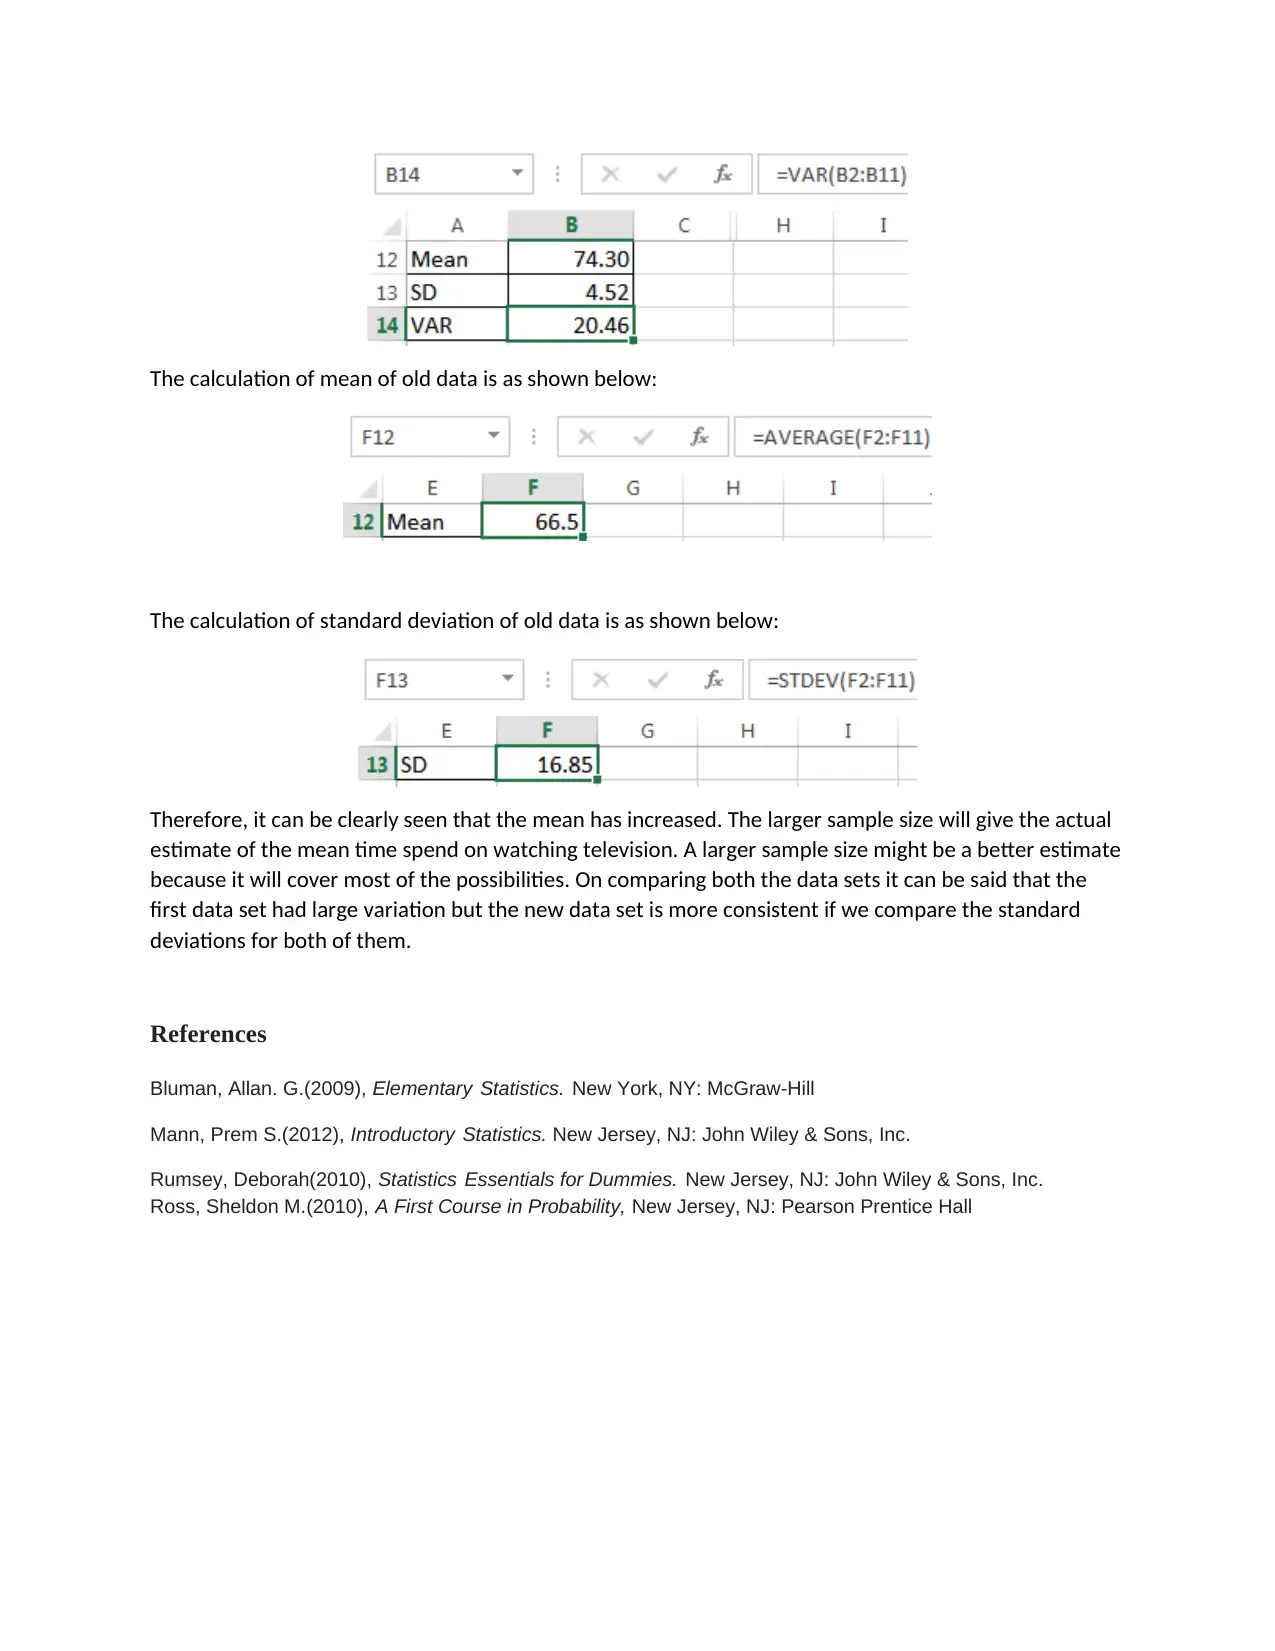
This assignment focuses on statistical analysis and interpretation. The student calculates the mean, standard deviation, and variance using two different datasets. The assignment involves comparing the datasets, analyzing the changes in the mean, and discussing the impact of sample size on the results. The student utilizes Excel to perform the calculations and provides references to relevant statistical resources. The analysis highlights the importance of these statistical measures in understanding and interpreting data. The assignment demonstrates the student's ability to apply statistical concepts to real-world scenarios, including data interpretation, and provides insights into the nature of data variation.
Document Page
The data collected for another ten days of time in minutes I spend watching television is as shown
below:
Day1 70 Minutes
Day2 75 Minutes
Day3 72 Minutes
Day4 69 Minutes
Day5 81 Minutes
Day6 77 Minutes
Day7 73 Minutes
Day8 74 Minutes
Day9 70 Minutes
Day10 82 Minutes
The calculation of mean for new data in Excel is as shown below:
The calculation of standard deviation in Excel is as shown below:
The calculation of variance in Excel is as shown below:
tabler-icon-diamond-filled.svg

Secure Best Marks with AI Grader

Need help grading? Try our AI Grader for instant feedback on your assignments.
Document Page
The calculation of mean of old data is as shown below:
The calculation of standard deviation of old data is as shown below:
Therefore, it can be clearly seen that the mean has increased. The larger sample size will give the actual
estimate of the mean time spend on watching television. A larger sample size might be a better estimate
because it will cover most of the possibilities. On comparing both the data sets it can be said that the
first data set had large variation but the new data set is more consistent if we compare the standard
deviations for both of them.
References
Bluman, Allan. G.(2009), Elementary Statistics. New York, NY: McGraw-Hill
Mann, Prem S.(2012), Introductory Statistics. New Jersey, NJ: John Wiley & Sons, Inc.
Rumsey, Deborah(2010), Statistics Essentials for Dummies. New Jersey, NJ: John Wiley & Sons, Inc.
Ross, Sheldon M.(2010), A First Course in Probability, New Jersey, NJ: Pearson Prentice Hall
chevron_up_icon
1 out of 2
circle_padding
hide_on_mobile
zoom_out_icon
logo.png

Your All-in-One AI-Powered Toolkit for Academic Success.

Available 24*7 on WhatsApp / Email

[object Object]