Statistics Assignment Analysis

Verified

Added on  2020/03/02

|7
|1209
|67
Practical Assignment
AI Summary
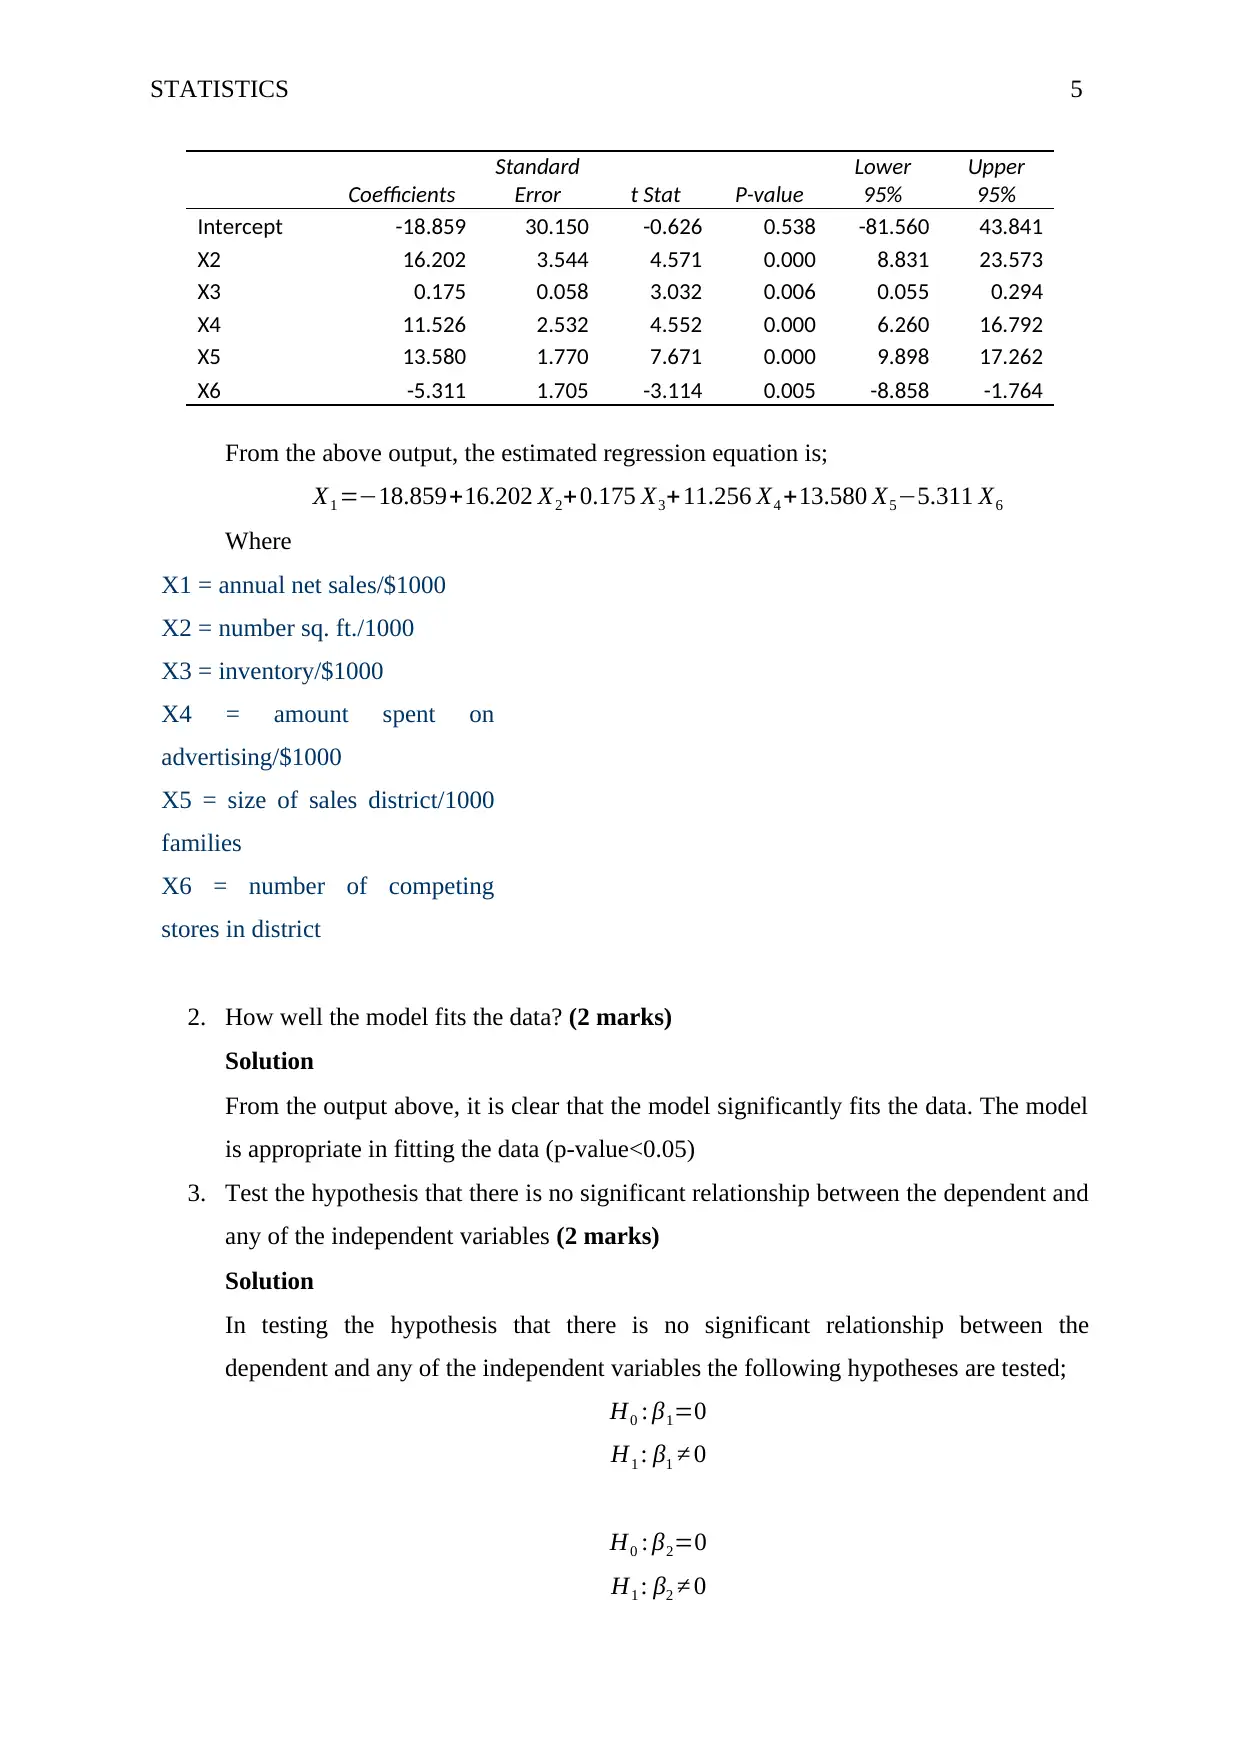
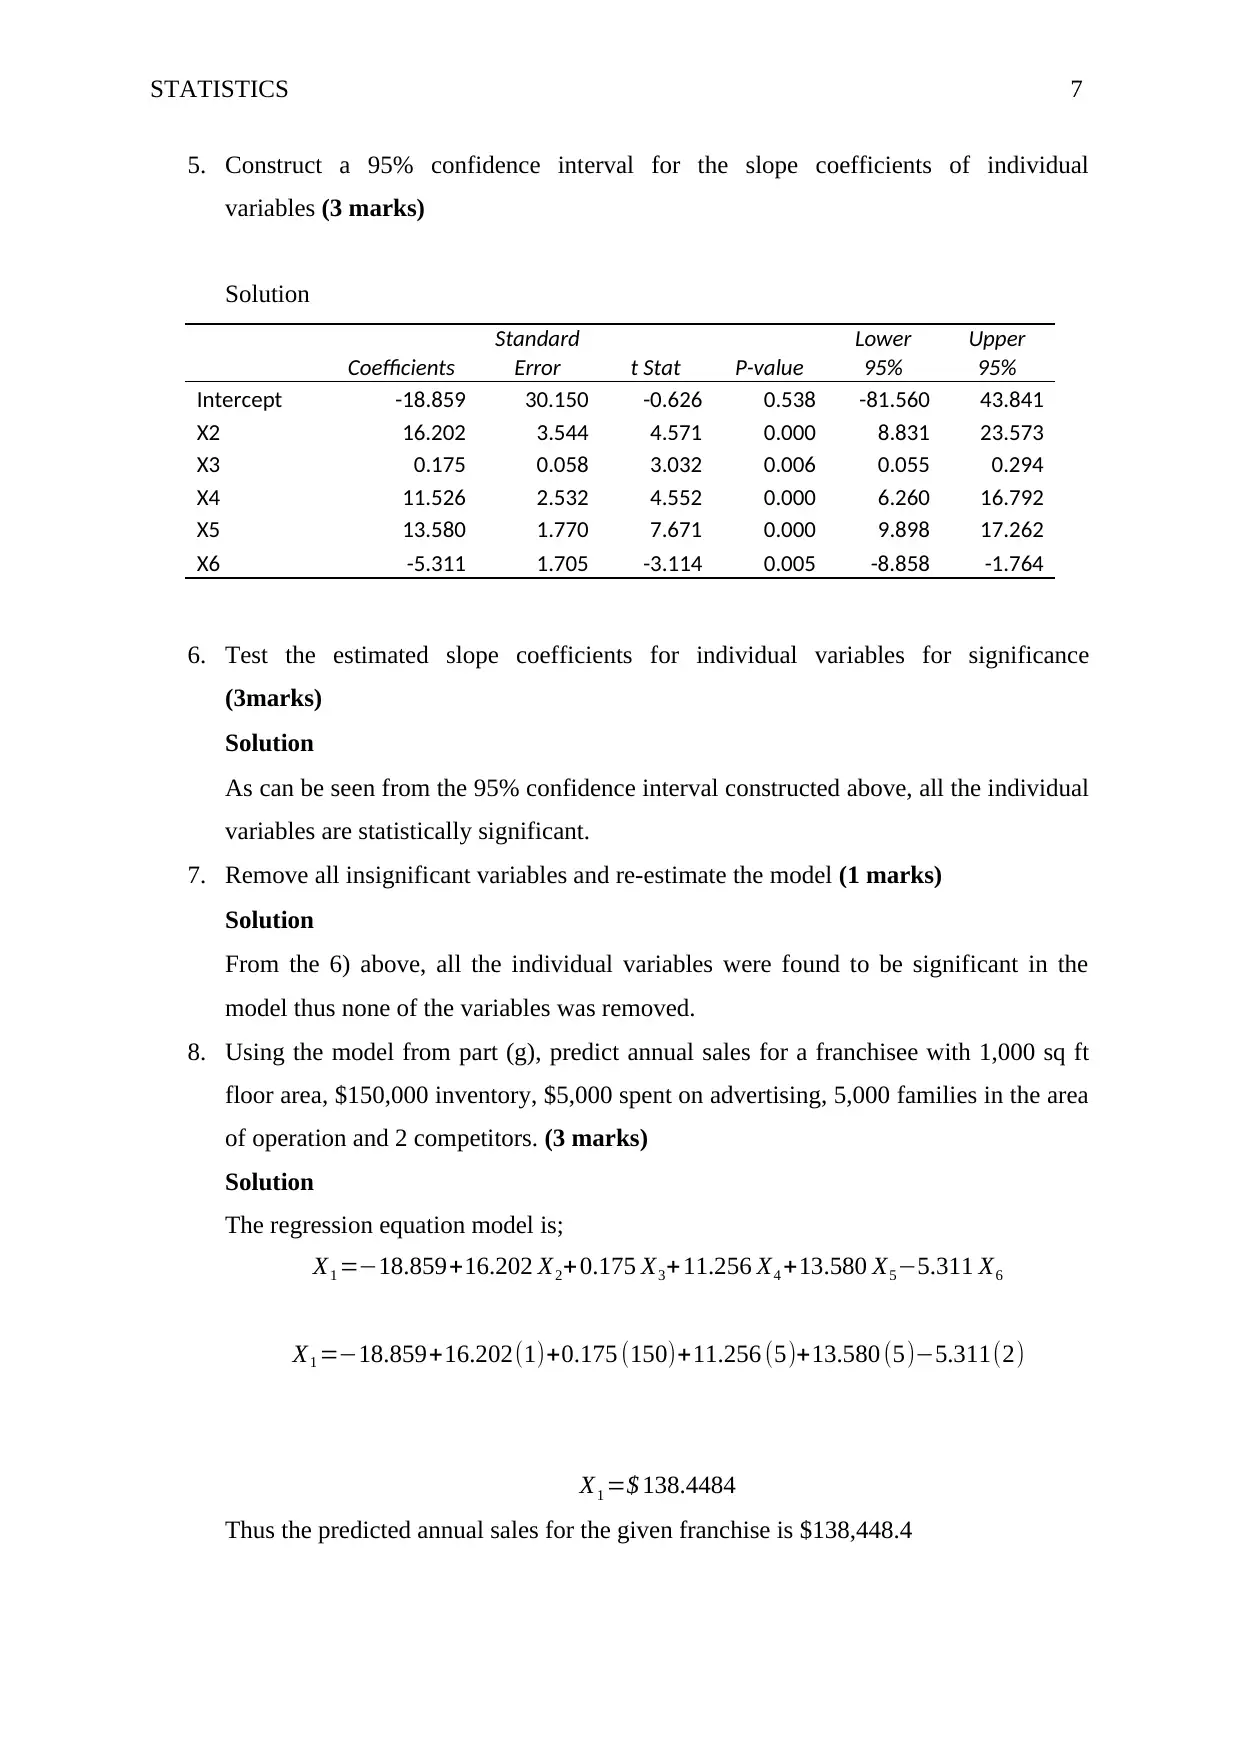
This practical assignment focuses on statistical analysis using Excel, covering tasks such as calculating mean, median, mode, variance, and conducting ANOVA tests. It also includes regression analysis for business data, providing insights into the relationship between various business metrics.
Document Page
Running Head: STATISTICS 1
Statistics
Name
University
25th August 2017
tabler-icon-diamond-filled.svg

Paraphrase This Document

Need a fresh take? Get an instant paraphrase of this document with our AI Paraphraser
Document Page
STATISTICS 2
You must use MS Excel for this assignment
Task 1 10 marks
The data for Task 1 in the data file for Assignment represents the starting costs in thousands
of dollars) for different kind of business.
1. Find mean, median, mode, range, variance and standard deviation separately for every
type of business (2 marks)
Solution
X1 X2 X3 X4 X5
Mean 83.00 92.09 72.30 87.00 51.63
Median 80.00 87.00 70.00 97.50 49.00
Range 105.00 120.00 90.00 115.00 90.00
Variance 1165.17 1512.69 983.79 1289.11 733.05
Standard Deviation 34.13 38.89 31.37 35.90 27.07
2. For every business type construct
a. frequency and relative frequency distributions starting from class 0 to 30 (3 marks)
Solution
X1 X2 X3 X4 X5
0-30 0 0 0 0 6
31-60 4 3 4 3 5
61-90 4 4 3 1 4
91-120 3 2 2 5 1
121-150 2 1 1 1 0
151-180 0 1 0 0 0
Total 13 11 10 10 16
b. a relative frequency histogram (3 marks)
Solution
0 50 100 150 200 250
0
0.005
0.01
Histograms (X2)
X2
Normal(92.300,40.991)
X2
Density
0 20 40 60 80 100120140160180200
0
0.005
0.01
Histograms (X1)
X1
Normal(83.900,33.825)
X1
Density
Document Page
STATISTICS 3
0 50 100 150 200 250
0
0.002
0.004
0.006
0.008
0.01
0.012
Histograms (X4)
X4
Normal(87,35.904)
X4
Density
0 20 40 60 80 100 120 140
0
0.01
0.02
Histograms (X5)
X5
Normal(39.100,21.794)
X5
Density
3. Discuss the results obtained in parts 1 and 2 (2 marks)
Solution
Results shows that on average X2 has the highest mean costs ($92,090) while X5 has
the lowest average cost ($51,630). In terms of spreading out of the data, X5 is less
spread out while X2 is more spread out.
Frequency distribution shows that the costs are mostly spread out between 31-150
thousand of dollars for all the five different types of businesses.
4. Test if there significant difference in the starting costs for these types of business. (3
marks)
Solution
Anova: Single Factor
SUMMARY
Groups Count Sum Average
Varianc
e
X1 13 1079 83
1165.16
7
X2 11 1013
92.0909
1
1512.69
1
X3 10 723 72.3 983.788
20 40 60 80 100 120 140
0
0.005
0.01
0.015
Histograms (X3)
X3
Normal(72.300,31.365)
X3
Density
Document Page
STATISTICS 4
9
X4 10 870 87
1289.11
1
X5 16 826 51.625 733.05
ANOVA
Source of
Variation SS df MS F P-value F crit
Between
Groups
14298.2
2 4
3574.55
6
3.24633
6
0.01839
1
2.53968
9
Within Groups
60560.7
6 55
1101.10
5
Total
74858.9
8 59
Results from the ANOVA test above clearly shows that there is a significant difference in the
starting costs for these types of business (p-value<0.05).
Task 2 20 marks
The data for Task 2 in the data file for Assignment represents the following variables for
franchisees of All Greens Pty Ltd: annual sales ($’000), the floor area (sq.ft.’000), inventory
($’000), advertising expenditure ($’000), the size of the area where the business operates
(number of families, ‘000) and the number of competitors in the area.
1. Present the MS Excel output and write down the estimated regression equation (3
marks)
Solution
SUMMARY OUTPUT
Regression Statistics
Multiple R 0.996584
R Square 0.993179
Adjusted R Square 0.991556
Standard Error 17.64924
Observations 27
ANOVA
df SS MS F Significance F
Regression 5 952538.9 190507.8 611.5904 5.4E-22
Residual 21 6541.41 311.4957
Total 26 959080.4
tabler-icon-diamond-filled.svg

Paraphrase This Document

Need a fresh take? Get an instant paraphrase of this document with our AI Paraphraser
Document Page
STATISTICS 5
Coefficients
Standard
Error t Stat P-value
Lower
95%
Upper
95%
Intercept -18.859 30.150 -0.626 0.538 -81.560 43.841
X2 16.202 3.544 4.571 0.000 8.831 23.573
X3 0.175 0.058 3.032 0.006 0.055 0.294
X4 11.526 2.532 4.552 0.000 6.260 16.792
X5 13.580 1.770 7.671 0.000 9.898 17.262
X6 -5.311 1.705 -3.114 0.005 -8.858 -1.764
From the above output, the estimated regression equation is;
X1 =18.859+16.202 X2+0.175 X3+ 11.256 X4 +13.580 X55.311 X6
Where
X1 = annual net sales/$1000
X2 = number sq. ft./1000
X3 = inventory/$1000
X4 = amount spent on
advertising/$1000
X5 = size of sales district/1000
families
X6 = number of competing
stores in district
2. How well the model fits the data? (2 marks)
Solution
From the output above, it is clear that the model significantly fits the data. The model
is appropriate in fitting the data (p-value<0.05)
3. Test the hypothesis that there is no significant relationship between the dependent and
any of the independent variables (2 marks)
Solution
In testing the hypothesis that there is no significant relationship between the
dependent and any of the independent variables the following hypotheses are tested;
H0 : β1=0
H1 : β1 0
H0 : β2=0
H1 : β2 0
Document Page
STATISTICS 6
H0 : β3=0
H1 : β3 0
H0 : β4=0
H1 : β4 0
H0 : β5=0
H1 : β5 0
We observe that we reject the null hypothesis in all the cases and conclude that all the
independent variables are significant relationship with the dependent variable.
4. Interpret individual slope coefficients (3 marks)
Solution
X1 =18.859+16.202 X2+0.175 X3+ 11.256 X4 +13.580 X55.311 X6
The coefficient for X2 is 16.202; this means that a unit increase in the square feet
would result to an increase in the annual net sales by 16.202. A unit decrease in
square feet would result to a decrease in the annual net sales by 16.202
The coefficient for X3 is 0.175; this means that a unit increase in the inventory would
result to an increase in the annual net sales by 0.175. A unit decrease in inventory
would result to a decrease in the annual net sales by 0.175
The coefficient for X4 is 11.256; this means that a unit increase in the advertising
costs would result to an increase in the annual net sales by 11.256. A unit decrease in
advertising costs would result to a decrease in the annual net sales by 11.256
The coefficient for X5 is 13.580; this means that a unit increase in the sales district
would result to an increase in the annual net sales by 13.580. A unit decrease in sales
district would result to a decrease in the annual net sales by 13.580
The coefficient for X6 is -5.311; this means that a unit increase in the competing
stores would result to a decrease in the annual net sales by 5.311. A unit decrease in
competing stores would result to an increase in the annual net sales by 5.311
Document Page
STATISTICS 7
5. Construct a 95% confidence interval for the slope coefficients of individual
variables (3 marks)
Solution
Coefficients
Standard
Error t Stat P-value
Lower
95%
Upper
95%
Intercept -18.859 30.150 -0.626 0.538 -81.560 43.841
X2 16.202 3.544 4.571 0.000 8.831 23.573
X3 0.175 0.058 3.032 0.006 0.055 0.294
X4 11.526 2.532 4.552 0.000 6.260 16.792
X5 13.580 1.770 7.671 0.000 9.898 17.262
X6 -5.311 1.705 -3.114 0.005 -8.858 -1.764
6. Test the estimated slope coefficients for individual variables for significance
(3marks)
Solution
As can be seen from the 95% confidence interval constructed above, all the individual
variables are statistically significant.
7. Remove all insignificant variables and re-estimate the model (1 marks)
Solution
From the 6) above, all the individual variables were found to be significant in the
model thus none of the variables was removed.
8. Using the model from part (g), predict annual sales for a franchisee with 1,000 sq ft
floor area, $150,000 inventory, $5,000 spent on advertising, 5,000 families in the area
of operation and 2 competitors. (3 marks)
Solution
The regression equation model is;
X1 =18.859+16.202 X2+0.175 X3+ 11.256 X4 +13.580 X55.311 X6
X1 =18.859+16.202(1)+0.175 (150)+11.256 (5)+13.580 (5)5.311(2)
X1 =$ 138.4484
Thus the predicted annual sales for the given franchise is $138,448.4
chevron_up_icon
1 out of 7
circle_padding
hide_on_mobile
zoom_out_icon
[object Object]