Statistics Assignment: Statistical Test Selection and Data Analysis

Verified

Added on  2022/08/16

|13
|1631
|15
Homework Assignment
AI Summary
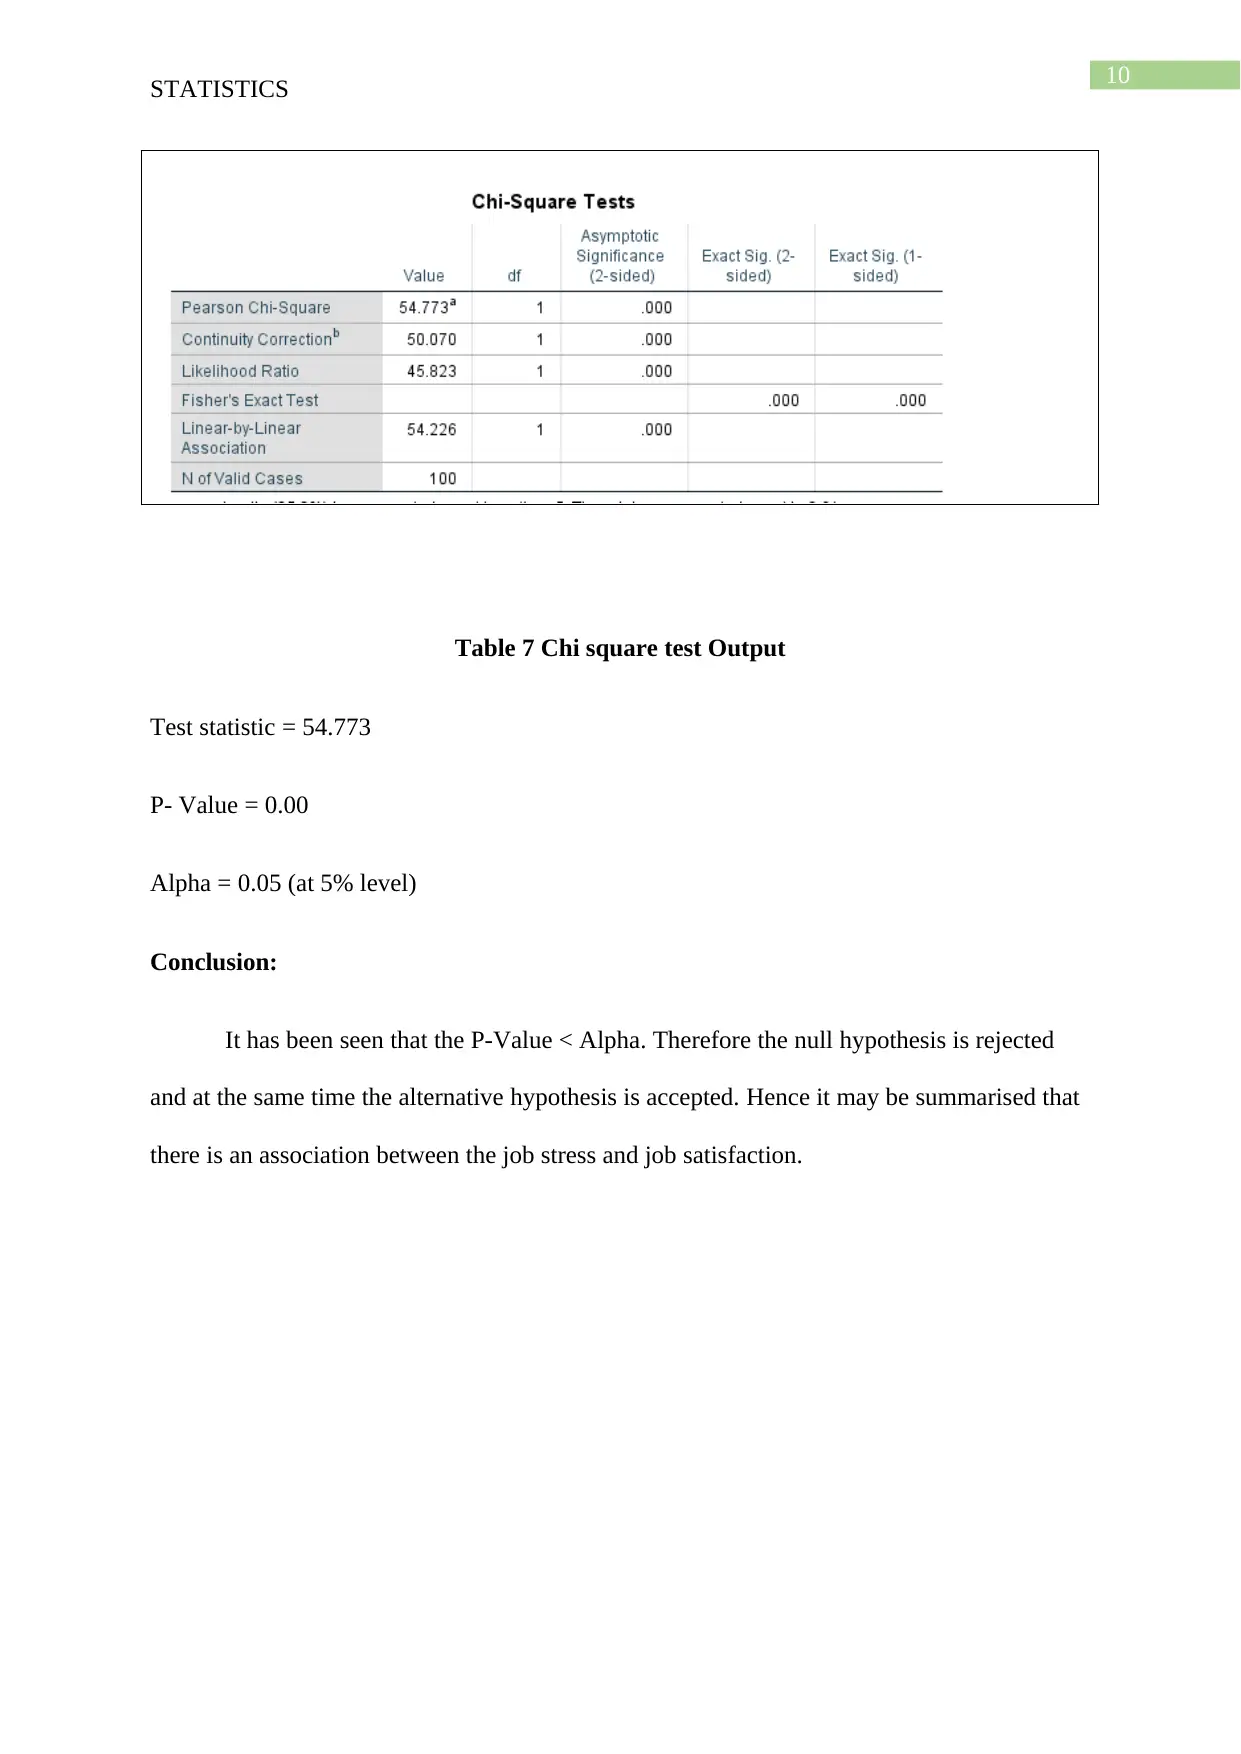
This assignment presents the analysis of seven research questions using various statistical tests, including single-sample t-tests, one-way ANOVA, chi-square tests, and paired t-tests. Each question is addressed with a null and alternative hypothesis, followed by the selection of the appropriate statistical test based on the data and research question. The student performs the tests, reports the test statistics, p-values, and conclusions regarding the acceptance or rejection of the null hypotheses, based on a significance level of 0.05. The analysis covers topics such as BMI differences, associations between exercise and smoking, and relationships between job stress and satisfaction. The results are presented in APA format, including tables summarizing the output and conclusions for each test. The assignment demonstrates the application of statistical methods to real-world scenarios, providing insights into the health of a group of staff nurses.
tabler-icon-diamond-filled.svg

Contribute Materials

Your contribution can guide someone’s learning journey. Share your documents today.
Document Page
Running head: STATISTICS
Statistics
Name of the Student:
Name of the University:
Author note:
tabler-icon-diamond-filled.svg

Secure Best Marks with AI Grader

Need help grading? Try our AI Grader for instant feedback on your assignments.
Document Page
1
STATISTICS
Table of Contents
Answer to the question 1............................................................................................................2
Answer to the question 2............................................................................................................3
Answer to the question 3............................................................................................................4
Answer to the question 4............................................................................................................5
Answer to the question 5............................................................................................................7
Answer to the question 6............................................................................................................8
Answer to the question 7............................................................................................................9
Bibliography.............................................................................................................................11
Document Page
2
STATISTICS
Answer to the question 1
To determine the differences of body mass index (BMI) single sample t-test has been
applied. The reason for selecting this test is that there is only a single variable which have to
test.
Null hypothesis (H0): There is no difference in the body mass index of national mean and the
nurse participants.
Alternative hypothesis (H1): There is a difference in the body mass index of national mean
and the nurse participants.
Table 1 Single sample t-test Output
Test statistic = 2.167
P- Value = 0.033
Alpha = 0.05 (at 5% level)
Document Page
3
STATISTICS
Conclusion:
It has been seen that the P-Value < Alpha. Therefore the null hypothesis is rejected
and at the same time the alternative hypothesis is accepted. Hence it may be summarised that
there is a differences between the body mass index of national mean and the nurse
participants.
Answer to the question 2
To determine the difference between pre and post body mass indexes (BMI) one way
ANOVA has been applied. The reason for selecting this test is that there are two variables,
one is categorical and the other is numerical variable. Hence the one ANOVA is the best test
to determine the difference among in pre BMI for smokers.
Null hypothesis (H0): There is no difference in BMI for the smokers and non-smokers.
Alternative hypothesis (H1): There is a difference in BMI for the smokers and non-smokers.
Table 2 One way ANOVA Output
Test statistic = 14.274
P- Value = 0.000
tabler-icon-diamond-filled.svg

Secure Best Marks with AI Grader

Need help grading? Try our AI Grader for instant feedback on your assignments.
Document Page
4
STATISTICS
Alpha = 0.05 (at 5% level)
Conclusion:
It has been seen that the P-Value < Alpha. Therefore the null hypothesis is rejected
and at the same time the alternative hypothesis is accepted. Hence it may be summarised that
there is a difference in BMI for the smokers and non-smokers.
Answer to the question 3
To test the association between the level of exercise and smoking, chi- square test of
independence of attributes has been applied. The reason for selecting this test is that the two
variables are categorised in to 2×5 ways. Since the variables are categorical, so the Chi-
square test is the best test to determine their difference.
Null hypothesis (H0): There is no association in the level of exercise for the smokers and
non- smokers.
Alternative hypothesis (H1): There is an association in the level of exercise for the smokers
and non- smokers.
Document Page
5
STATISTICS
Table 3 Chi square test Output
Test statistic = 14.280
P- Value = 0.006
Alpha = 0.05 (at 5% level)
Conclusion:
It has been seen that the P-Value < Alpha. Therefore the null hypothesis is rejected
and at the same time the alternative hypothesis is accepted. Hence it may be summarised that
there an association in the level of exercise for the smokers and non- smokers.
Answer to the question 4
To test the difference between the pre and post body mass index paired t-test has been
applied. The reason for selecting this test is that there are two variables in this hypothesis test,
one is pre BMI and the other is post. In this situation the paired t-test is the best test to
determine the differences between these variables.
Document Page
6
STATISTICS
Null hypothesis (H0): There is no differences among the pre and post body mass index.
Alternative hypothesis (H1): There is a differences among the pre and post body mass index.
Table 4 Paired t-test Output
Test statistic = 45.666
P- Value = 0.000
Alpha = 0.05 (at 5% level)
Conclusion:
It has been seen that the P-Value < Alpha. Therefore the null hypothesis is rejected
and at the same time the alternative hypothesis is accepted. Hence it may be summarised that
there is a differences among the pre and post body mass index.
tabler-icon-diamond-filled.svg

Paraphrase This Document

Need a fresh take? Get an instant paraphrase of this document with our AI Paraphraser
Document Page
7
STATISTICS
Answer to the question 5
To the differences between pre and post exercise level, paired t-test has been applied.
The reason for selecting this test is that there are two variables in this hypothesis test, one is
pre exercise level and the other is post. In this situation the paired t-test is the best test to
determine the differences between these variables.
Null hypothesis (H0): There is no differences among the pre and post exercise level.
Alternative hypothesis (H1): There is a differences among the pre and post exercise level.
Table 5 Paired t-test Output
Test statistic = -2.460
P- Value = 0.016
Alpha = 0.05 (at 5% level)
Document Page
8
STATISTICS
Conclusion:
It has been seen that the P-Value < Alpha. Therefore the null hypothesis is rejected
and at the same time the alternative hypothesis is accepted. Hence it may be summarised that
there is a differences among the pre and post exercise level.
Answer to the question 6
To test the association in smokers for diabetic and non-diabetic the chi-square test of
independent of attributes has been applied. More over the Fisher’s exact test has also been
applied. The reason for selecting this test is that the data on smokers in diabetic and non-
diabetic is categorical. Since the data has been categorised in to 2× 2 table. Therefore the chi-
square and Fisher’s exact test is the best test to determine the association between them.
Null hypothesis (H0): There is no association in smokers for diabetic and non-diabetic.
Alternative hypothesis (H1): There is an association in smokers for diabetic and non-
diabetic.
Table 6 Chi square test Output
Document Page
9
STATISTICS
Test statistic = 2.31
P- Value = 0.16
Alpha = 0.05 (at 5% level)
Conclusion:
It has been seen that the P-Value > Alpha. Therefore the null hypothesis is accepted
and at the same time the alternative hypothesis is rejected. Hence it may be summarised that
there is no association in smokers for diabetic and non-diabetic.
Answer to the question 7
To test the association between the job stress and satisfaction with job the chi-square
test of independent of attributes has been applied. More over the Fisher’s exact test has also
been applied. The reason for selecting this test is that the data on job stress and job
satisfaction is categorical. Since the data has been categorised in to 2× 2 table. Therefore the
chi-square and Fisher’s exact test is the best test to determine the association between them.
Null hypothesis (H0): There is no association between the job stress and job satisfaction.
Alternative hypothesis (H1): There is an association between the job stress and job
satisfaction.
tabler-icon-diamond-filled.svg

Secure Best Marks with AI Grader

Need help grading? Try our AI Grader for instant feedback on your assignments.
Document Page
10
STATISTICS
Table 7 Chi square test Output
Test statistic = 54.773
P- Value = 0.00
Alpha = 0.05 (at 5% level)
Conclusion:
It has been seen that the P-Value < Alpha. Therefore the null hypothesis is rejected
and at the same time the alternative hypothesis is accepted. Hence it may be summarised that
there is an association between the job stress and job satisfaction.
Document Page
11
STATISTICS
Bibliography
Cardinal, R. N., & Aitken, M. R. (2013). ANOVA for the behavioral sciences researcher.
Psychology Press.
Connelly, L. M. (2016). Fisher's exact test. Medsurg Nursing, 25(1), 58-60.
Cramer, A. O., van Ravenzwaaij, D., Matzke, D., Steingroever, H., Wetzels, R., Grasman, R.
P., ... & Wagenmakers, E. J. (2016). Hidden multiplicity in exploratory multiway
ANOVA: Prevalence and remedies. Psychonomic bulletin & review, 23(2), 640-647.
De Winter, J. C. (2013). Using the Student's t-test with extremely small sample sizes.
Practical Assessment, Research, and Evaluation, 18(1), 10.
Kim, H. Y. (2017). Statistical notes for clinical researchers: chi-squared test and Fisher's
exact test. Restorative dentistry & endodontics, 42(2), 152-155.
Kim, T. K. (2015). T test as a parametric statistic. Korean journal of anesthesiology, 68(6),
540.
McHugh, M. L. (2013). The chi-square test of independence. Biochemia medica: Biochemia
medica, 23(2), 143-149.
Rana, R., & Singhal, R. (2015). Chi-square test and its application in hypothesis testing.
Journal of the Practice of Cardiovascular Sciences, 1(1), 69.
Zhang, J. T., & Liang, X. (2014). One‐way ANOVA for functional data via globalizing the
pointwise F‐test. Scandinavian Journal of Statistics, 41(1), 51-71.
Document Page
12
STATISTICS
chevron_up_icon
1 out of 13
circle_padding
hide_on_mobile
zoom_out_icon
logo.png

Your All-in-One AI-Powered Toolkit for Academic Success.

Available 24*7 on WhatsApp / Email

[object Object]