Statistics Assignment - Data Analysis, Interpretation, and Reporting
VerifiedAdded on 2022/11/07
|11
|2975
|163
Homework Assignment
AI Summary
This statistics assignment involves analyzing data from the Australian Stock Exchange (ASX) and the Australian Bureau of Statistics (ABS). The assignment requires students to gather and present quarterly opening share prices for Sydney Airport (SYD) and Atlas Arteria (ALX) from 2009 to 2018, create a stem-and-leaf plot, relative frequency histograms, and bar charts. It also requires students to analyze market capitalizations of companies in the transportation sector, provide investment recommendations, and calculate various statistical measures (mean, median, quartiles, standard deviation, etc.) for white goods prices. Furthermore, the assignment includes questions on probability using ABS data and rainfall data analysis from the Bureau of Meteorology, requiring students to interpret and apply statistical techniques in business and environmental contexts. The solution demonstrates how to use Excel for data analysis and visualization, and to interpret and discuss statistical findings.
Assessment details for all students
Assessment item 2—Assignment 2
Due date: 6:00pm, Friday Week 10 ASSESSMENT
Weighting: 20%
2Format: Submit one file online as .doc, .docx, .rtf or .pdf
Assessment criteria
This assignment must be typed, word-processed or clearly hand-written (but plots and graphs
must be done using EXCEL or equivalent software), and submitted online as a single file
through Moodle. Important note: The file size must not be over 100MB.
Microsoft Excel allows students to cut and paste information easily into Microsoft Word
documents. Word also allows the use of Microsoft Equation Editor to produce all necessary
formulae (use of these are recommended).
It is expected that Excel would be used to assist in statistical calculations for questions in this
assignment. Where Excel is used, use copy function, “Snipping tool” or similar to cut and paste
relevant parts of the spreadsheet to verify that you have done the work. (In that case there is no
need to write the equations.)
For those questions where Excel is not used to do the computations, all formulae and working
must be included to obtain full marks.
Only one file will be accepted in any of the formats mentioned above. No zipped file or any other
file extension will be accepted. Also, no submission as an email attachment will be accepted.
There will be late submission penalty for submissions beyond the deadline unless prior approval
is obtained from the Unit Coordinator through the extension system in Moodle. Under no
circumstances any submission that is late beyond 14 days from the deadline of Friday of Week 10
will be marked, or get any score other than zero.
Assignment markers will be looking for answers which
demonstrate the student’s ability to interpret and apply the statistical techniques in the
scenarios and
use statistical techniques as decision making tools in the business environment.
Full marks will not be awarded to answers which simply demonstrate statistical procedures without
comment, interpretation or discussion (as directed in the questions).
Plagiarism
CQU values academic honesty. Consequently, plagiarism will not be tolerated in assessment items. This
assignment must be completed by each student individually.
1 of 15
Paraphrase This Document
Need a fresh take? Get an instant paraphrase of this document with our AI Paraphraser
Question 1 4 Marks
Visit the Australian Stock Exchange website, www.asx.com.au and from “Prices and research” drop-
down menu, select “Company information”. Type in the ASX code “SYD” (Sydney Airport), and find out
details about the company. Also, type in the ASX code “ALX” (Atlas Arteria), and find out the details
about that company. Both these companies belong to industrials sector and within the industry group
transportation. Information available in the ASX website will be inadequate for your purpose, you will
need to search the internet for more information. Your task will be to get the opening prices of SYD and
ALX shares for every quarter from January 2009 to December 2018 (unadjusted prices). If you are
retrieving the monthly prices, read the values in the beginning of every Quarter (January, April, July,
October) for every year from 2009 to 2018 (Total 40 observations). To provide you with some guidance
as to what the unadjusted prices look like, two charts accompany this question. After you have researched
share prices and industrials sector (transportation group), answer the following questions:
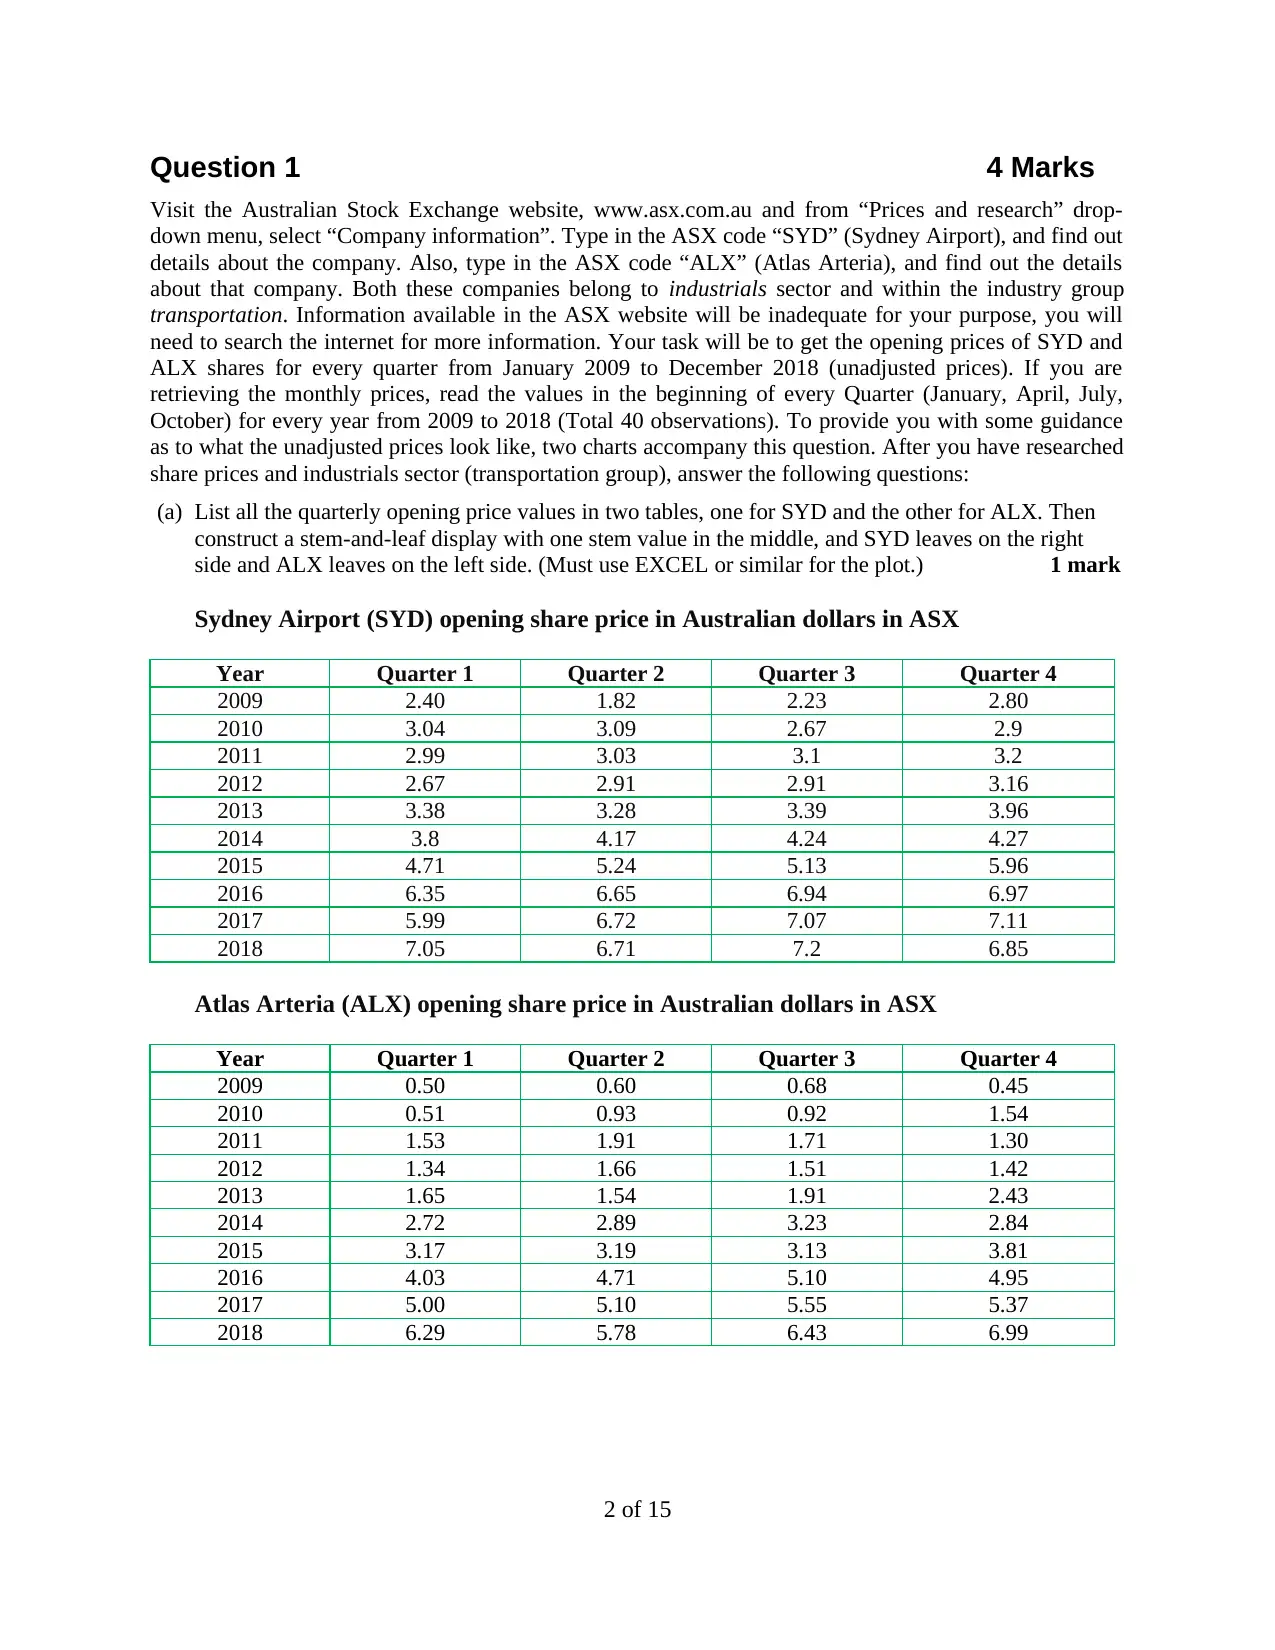
(a) List all the quarterly opening price values in two tables, one for SYD and the other for ALX. Then
construct a stem-and-leaf display with one stem value in the middle, and SYD leaves on the right
side and ALX leaves on the left side. (Must use EXCEL or similar for the plot.) 1 mark
Sydney Airport (SYD) opening share price in Australian dollars in ASX
Year Quarter 1 Quarter 2 Quarter 3 Quarter 4
2009 2.40 1.82 2.23 2.80
2010 3.04 3.09 2.67 2.9
2011 2.99 3.03 3.1 3.2
2012 2.67 2.91 2.91 3.16
2013 3.38 3.28 3.39 3.96
2014 3.8 4.17 4.24 4.27
2015 4.71 5.24 5.13 5.96
2016 6.35 6.65 6.94 6.97
2017 5.99 6.72 7.07 7.11
2018 7.05 6.71 7.2 6.85
Atlas Arteria (ALX) opening share price in Australian dollars in ASX
Year Quarter 1 Quarter 2 Quarter 3 Quarter 4
2009 0.50 0.60 0.68 0.45
2010 0.51 0.93 0.92 1.54
2011 1.53 1.91 1.71 1.30
2012 1.34 1.66 1.51 1.42
2013 1.65 1.54 1.91 2.43
2014 2.72 2.89 3.23 2.84
2015 3.17 3.19 3.13 3.81
2016 4.03 4.71 5.10 4.95
2017 5.00 5.10 5.55 5.37
2018 6.29 5.78 6.43 6.99
2 of 15
Visit the Australian Stock Exchange website, www.asx.com.au and from “Prices and research” drop-
down menu, select “Company information”. Type in the ASX code “SYD” (Sydney Airport), and find out
details about the company. Also, type in the ASX code “ALX” (Atlas Arteria), and find out the details
about that company. Both these companies belong to industrials sector and within the industry group
transportation. Information available in the ASX website will be inadequate for your purpose, you will
need to search the internet for more information. Your task will be to get the opening prices of SYD and
ALX shares for every quarter from January 2009 to December 2018 (unadjusted prices). If you are
retrieving the monthly prices, read the values in the beginning of every Quarter (January, April, July,
October) for every year from 2009 to 2018 (Total 40 observations). To provide you with some guidance
as to what the unadjusted prices look like, two charts accompany this question. After you have researched
share prices and industrials sector (transportation group), answer the following questions:
(a) List all the quarterly opening price values in two tables, one for SYD and the other for ALX. Then
construct a stem-and-leaf display with one stem value in the middle, and SYD leaves on the right
side and ALX leaves on the left side. (Must use EXCEL or similar for the plot.) 1 mark
Sydney Airport (SYD) opening share price in Australian dollars in ASX
Year Quarter 1 Quarter 2 Quarter 3 Quarter 4
2009 2.40 1.82 2.23 2.80
2010 3.04 3.09 2.67 2.9
2011 2.99 3.03 3.1 3.2
2012 2.67 2.91 2.91 3.16
2013 3.38 3.28 3.39 3.96
2014 3.8 4.17 4.24 4.27
2015 4.71 5.24 5.13 5.96
2016 6.35 6.65 6.94 6.97
2017 5.99 6.72 7.07 7.11
2018 7.05 6.71 7.2 6.85
Atlas Arteria (ALX) opening share price in Australian dollars in ASX
Year Quarter 1 Quarter 2 Quarter 3 Quarter 4
2009 0.50 0.60 0.68 0.45
2010 0.51 0.93 0.92 1.54
2011 1.53 1.91 1.71 1.30
2012 1.34 1.66 1.51 1.42
2013 1.65 1.54 1.91 2.43
2014 2.72 2.89 3.23 2.84
2015 3.17 3.19 3.13 3.81
2016 4.03 4.71 5.10 4.95
2017 5.00 5.10 5.55 5.37
2018 6.29 5.78 6.43 6.99
2 of 15
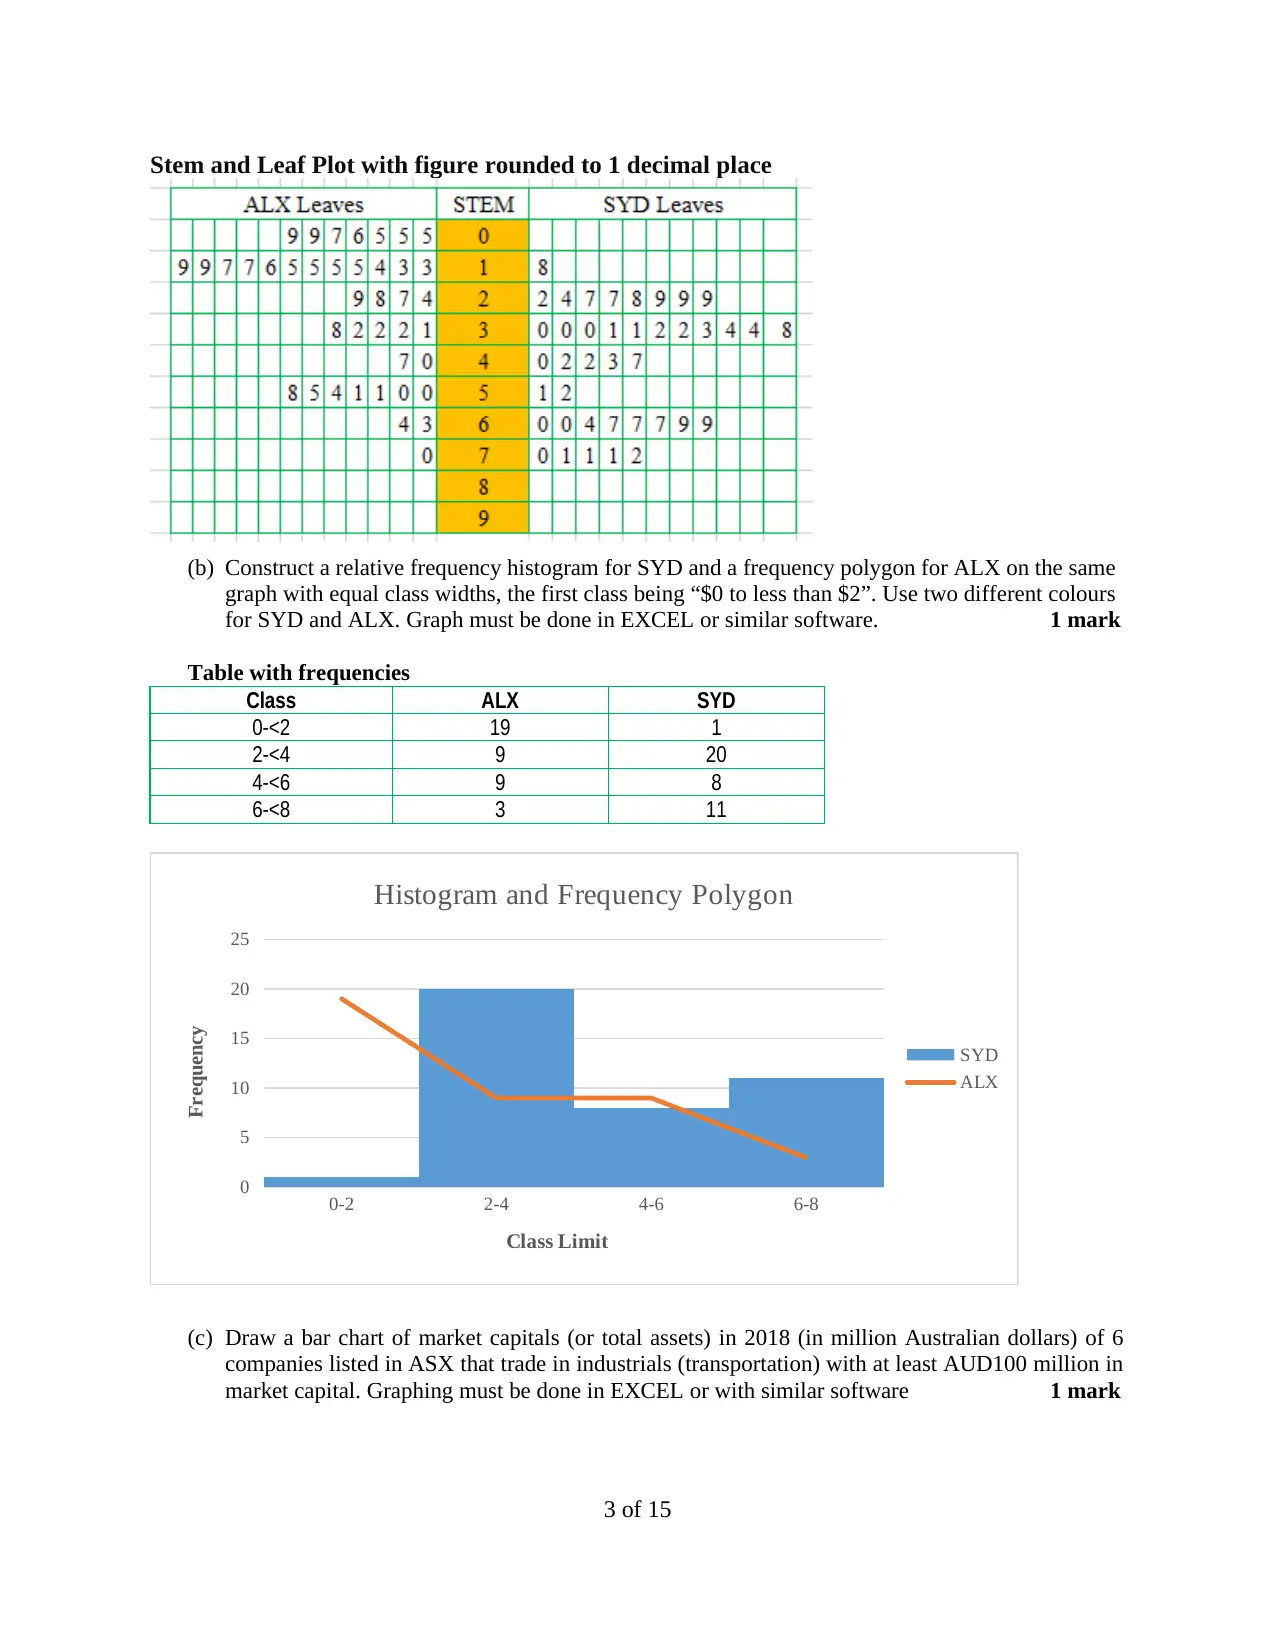
Stem and Leaf Plot with figure rounded to 1 decimal place
(b) Construct a relative frequency histogram for SYD and a frequency polygon for ALX on the same
graph with equal class widths, the first class being “$0 to less than $2”. Use two different colours
for SYD and ALX. Graph must be done in EXCEL or similar software. 1 mark
Table with frequencies
Class ALX SYD
0-<2 19 1
2-<4 9 20
4-<6 9 8
6-<8 3 11
0-2 2-4 4-6 6-8
0
5
10
15
20
25
Histogram and Frequency Polygon
SYD
ALX
Class Limit
Frequency
(c) Draw a bar chart of market capitals (or total assets) in 2018 (in million Australian dollars) of 6
companies listed in ASX that trade in industrials (transportation) with at least AUD100 million in
market capital. Graphing must be done in EXCEL or with similar software 1 mark
3 of 15
⊘ This is a preview!⊘
Do you want full access?
Subscribe today to unlock all pages.
Trusted by 1+ million students worldwide
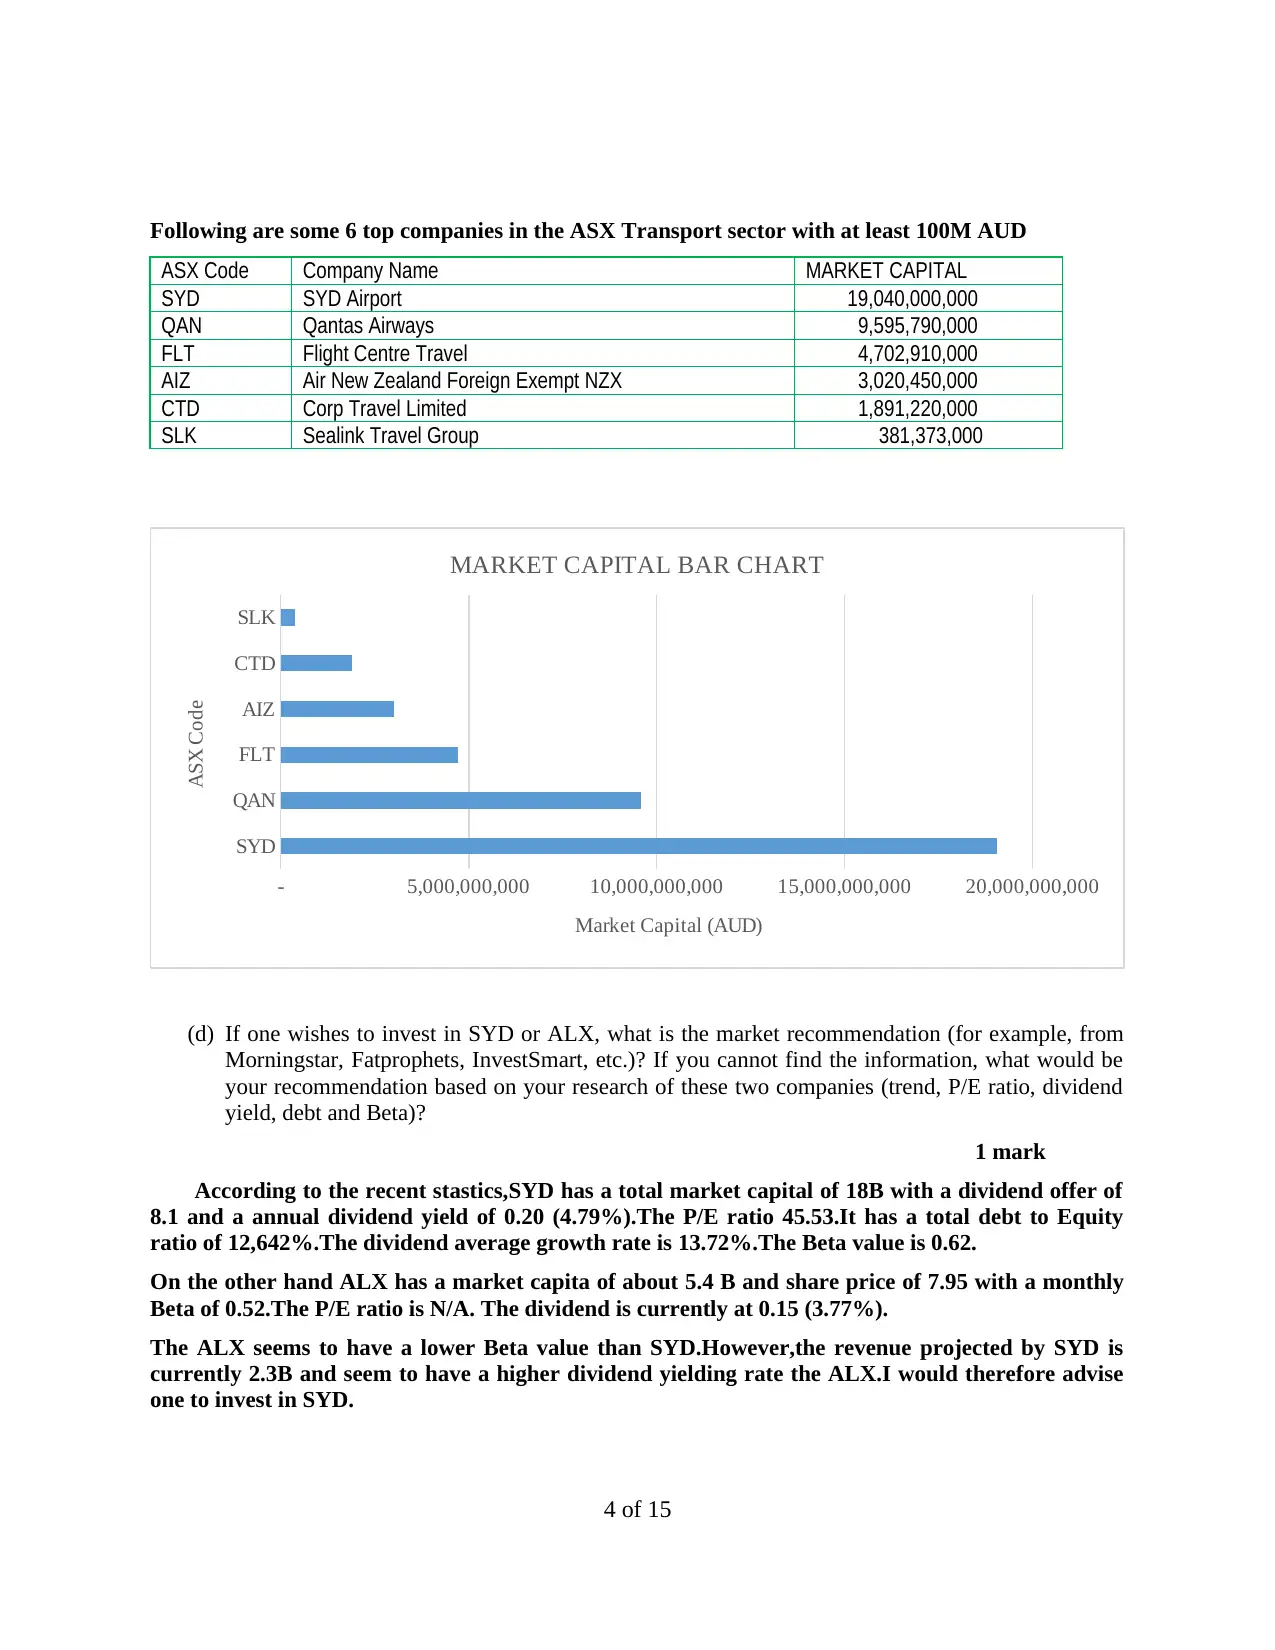
Following are some 6 top companies in the ASX Transport sector with at least 100M AUD
ASX Code Company Name MARKET CAPITAL
SYD SYD Airport 19,040,000,000
QAN Qantas Airways 9,595,790,000
FLT Flight Centre Travel 4,702,910,000
AIZ Air New Zealand Foreign Exempt NZX 3,020,450,000
CTD Corp Travel Limited 1,891,220,000
SLK Sealink Travel Group 381,373,000
SYD
QAN
FLT
AIZ
CTD
SLK
- 5,000,000,000 10,000,000,000 15,000,000,000 20,000,000,000
MARKET CAPITAL BAR CHART
Market Capital (AUD)
ASX Code
(d) If one wishes to invest in SYD or ALX, what is the market recommendation (for example, from
Morningstar, Fatprophets, InvestSmart, etc.)? If you cannot find the information, what would be
your recommendation based on your research of these two companies (trend, P/E ratio, dividend
yield, debt and Beta)?
1 mark
According to the recent stastics,SYD has a total market capital of 18B with a dividend offer of
8.1 and a annual dividend yield of 0.20 (4.79%).The P/E ratio 45.53.It has a total debt to Equity
ratio of 12,642%.The dividend average growth rate is 13.72%.The Beta value is 0.62.
On the other hand ALX has a market capita of about 5.4 B and share price of 7.95 with a monthly
Beta of 0.52.The P/E ratio is N/A. The dividend is currently at 0.15 (3.77%).
The ALX seems to have a lower Beta value than SYD.However,the revenue projected by SYD is
currently 2.3B and seem to have a higher dividend yielding rate the ALX.I would therefore advise
one to invest in SYD.
4 of 15
Paraphrase This Document
Need a fresh take? Get an instant paraphrase of this document with our AI Paraphraser
Question 2 4 Marks
The table below lists the prices of some common household white goods in Australia. Consider the
information as data from simple random sampling of different sample sizes.
Description Advertised or listed price (in AUD)
50” 4K smart TV 439.99, 499.99, 880.00, 888.00, 499.00, 895.00,
595.00, 429.00, 699.00, 519.99, 1495.00, 454.00,
629.00, 602.00, 481.95, 498.00, 434.00, 752.00,
599.00, 469.95, 799.00, 480.15, 695.99, 929.33,
1395.00, 1295.00
300L frost-free Fridge 699, 449, 678, 849, 1199, 787, 694, 698, 878, 489,
595, 538, 999, 649, 1009
30L Microwave oven 180, 119, 129, 99, 139, 249, 333, 200, 168, 185,
170, 233, 165, 215, 176, 246, 280, 140, 259, 288,
348, 268, 349, 242
7kg top load clothes Washer 589, 445, 598, 744, 824, 699, 579, 649, 449, 769,
599, 597, 628
5kg vented clothes Dryer 399, 395, 495, 398, 395, 448, 418, 346, 478
From the information provided in the table above,
From the information provided in the table above,
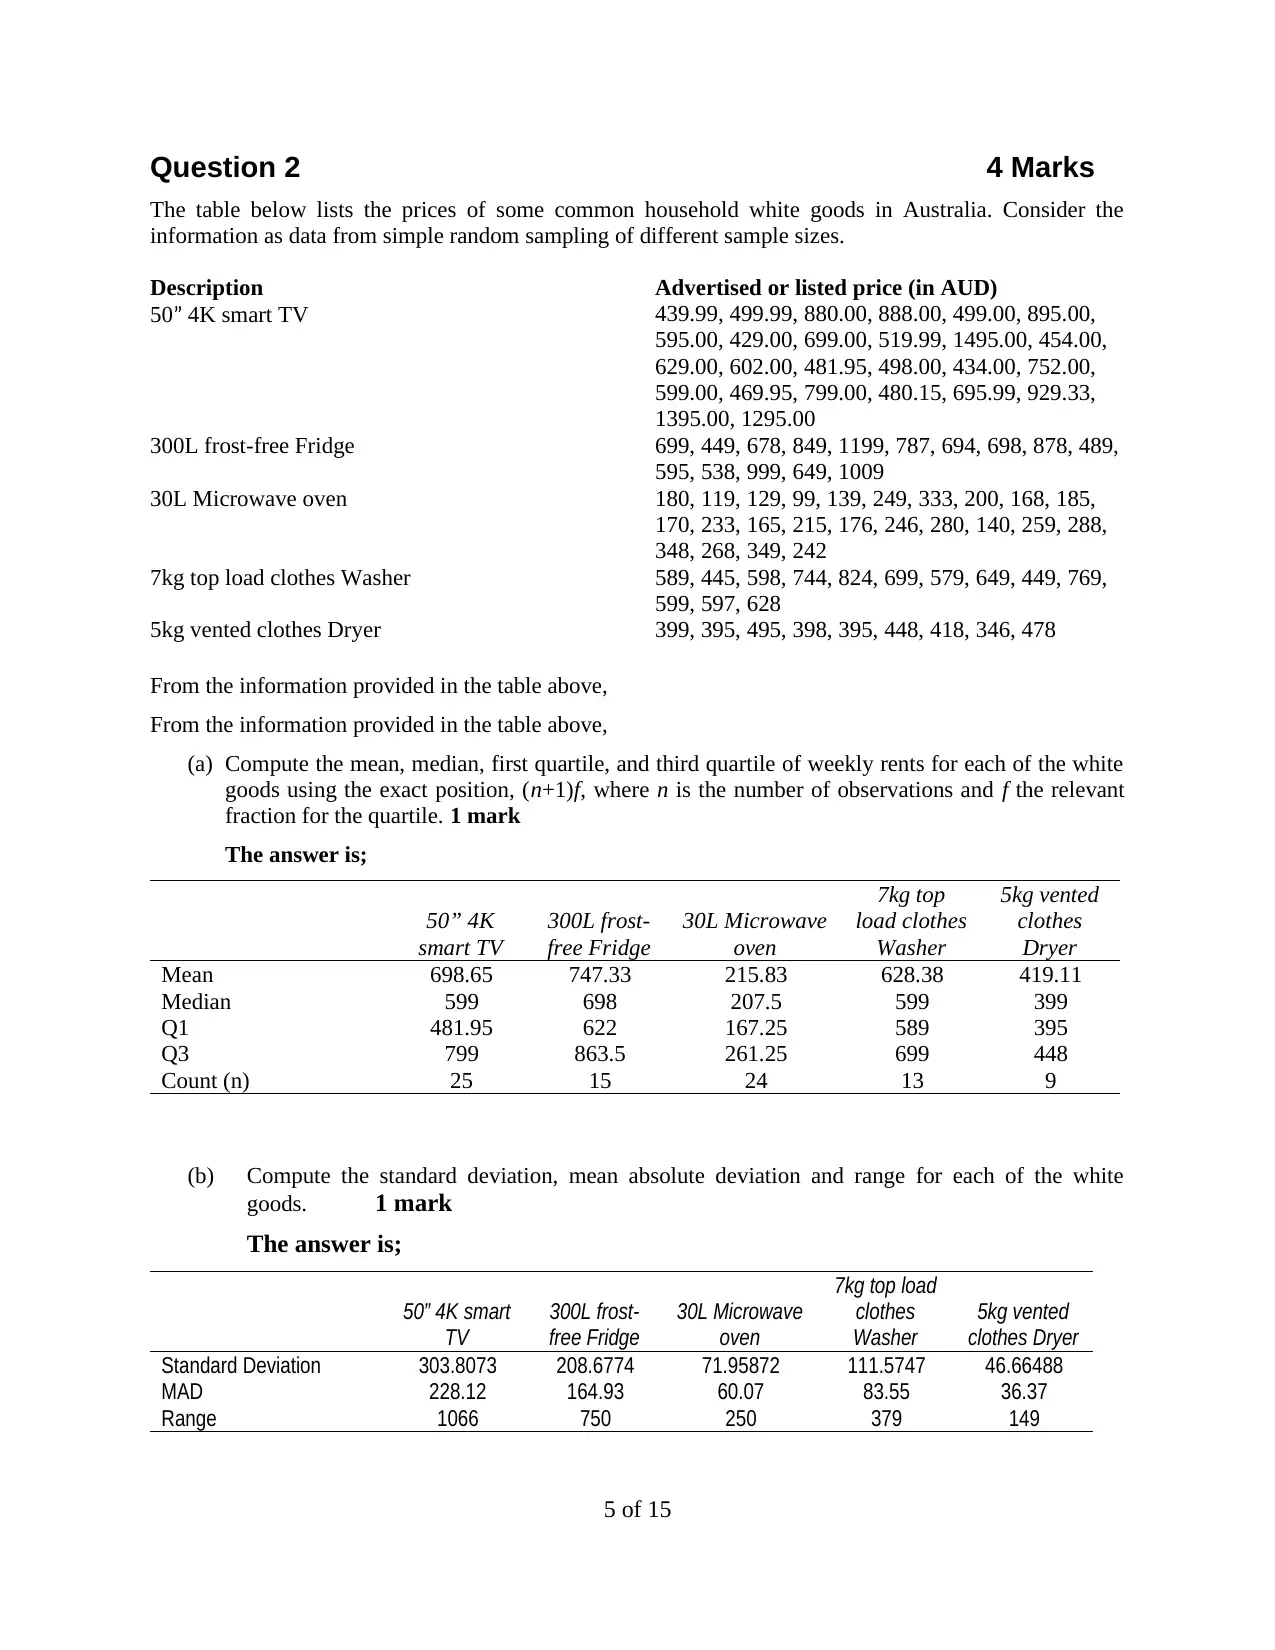
(a) Compute the mean, median, first quartile, and third quartile of weekly rents for each of the white
goods using the exact position, (n+1)f, where n is the number of observations and f the relevant
fraction for the quartile. 1 mark
The answer is;
50” 4K
smart TV
300L frost-
free Fridge
30L Microwave
oven
7kg top
load clothes
Washer
5kg vented
clothes
Dryer
Mean 698.65 747.33 215.83 628.38 419.11
Median 599 698 207.5 599 399
Q1 481.95 622 167.25 589 395
Q3 799 863.5 261.25 699 448
Count (n) 25 15 24 13 9
(b) Compute the standard deviation, mean absolute deviation and range for each of the white
goods. 1 mark
The answer is;
50” 4K smart
TV
300L frost-
free Fridge
30L Microwave
oven
7kg top load
clothes
Washer
5kg vented
clothes Dryer
Standard Deviation 303.8073 208.6774 71.95872 111.5747 46.66488
MAD 228.12 164.93 60.07 83.55 36.37
Range 1066 750 250 379 149
5 of 15
The table below lists the prices of some common household white goods in Australia. Consider the
information as data from simple random sampling of different sample sizes.
Description Advertised or listed price (in AUD)
50” 4K smart TV 439.99, 499.99, 880.00, 888.00, 499.00, 895.00,
595.00, 429.00, 699.00, 519.99, 1495.00, 454.00,
629.00, 602.00, 481.95, 498.00, 434.00, 752.00,
599.00, 469.95, 799.00, 480.15, 695.99, 929.33,
1395.00, 1295.00
300L frost-free Fridge 699, 449, 678, 849, 1199, 787, 694, 698, 878, 489,
595, 538, 999, 649, 1009
30L Microwave oven 180, 119, 129, 99, 139, 249, 333, 200, 168, 185,
170, 233, 165, 215, 176, 246, 280, 140, 259, 288,
348, 268, 349, 242
7kg top load clothes Washer 589, 445, 598, 744, 824, 699, 579, 649, 449, 769,
599, 597, 628
5kg vented clothes Dryer 399, 395, 495, 398, 395, 448, 418, 346, 478
From the information provided in the table above,
From the information provided in the table above,
(a) Compute the mean, median, first quartile, and third quartile of weekly rents for each of the white
goods using the exact position, (n+1)f, where n is the number of observations and f the relevant
fraction for the quartile. 1 mark
The answer is;
50” 4K
smart TV
300L frost-
free Fridge
30L Microwave
oven
7kg top
load clothes
Washer
5kg vented
clothes
Dryer
Mean 698.65 747.33 215.83 628.38 419.11
Median 599 698 207.5 599 399
Q1 481.95 622 167.25 589 395
Q3 799 863.5 261.25 699 448
Count (n) 25 15 24 13 9
(b) Compute the standard deviation, mean absolute deviation and range for each of the white
goods. 1 mark
The answer is;
50” 4K smart
TV
300L frost-
free Fridge
30L Microwave
oven
7kg top load
clothes
Washer
5kg vented
clothes Dryer
Standard Deviation 303.8073 208.6774 71.95872 111.5747 46.66488
MAD 228.12 164.93 60.07 83.55 36.37
Range 1066 750 250 379 149
5 of 15
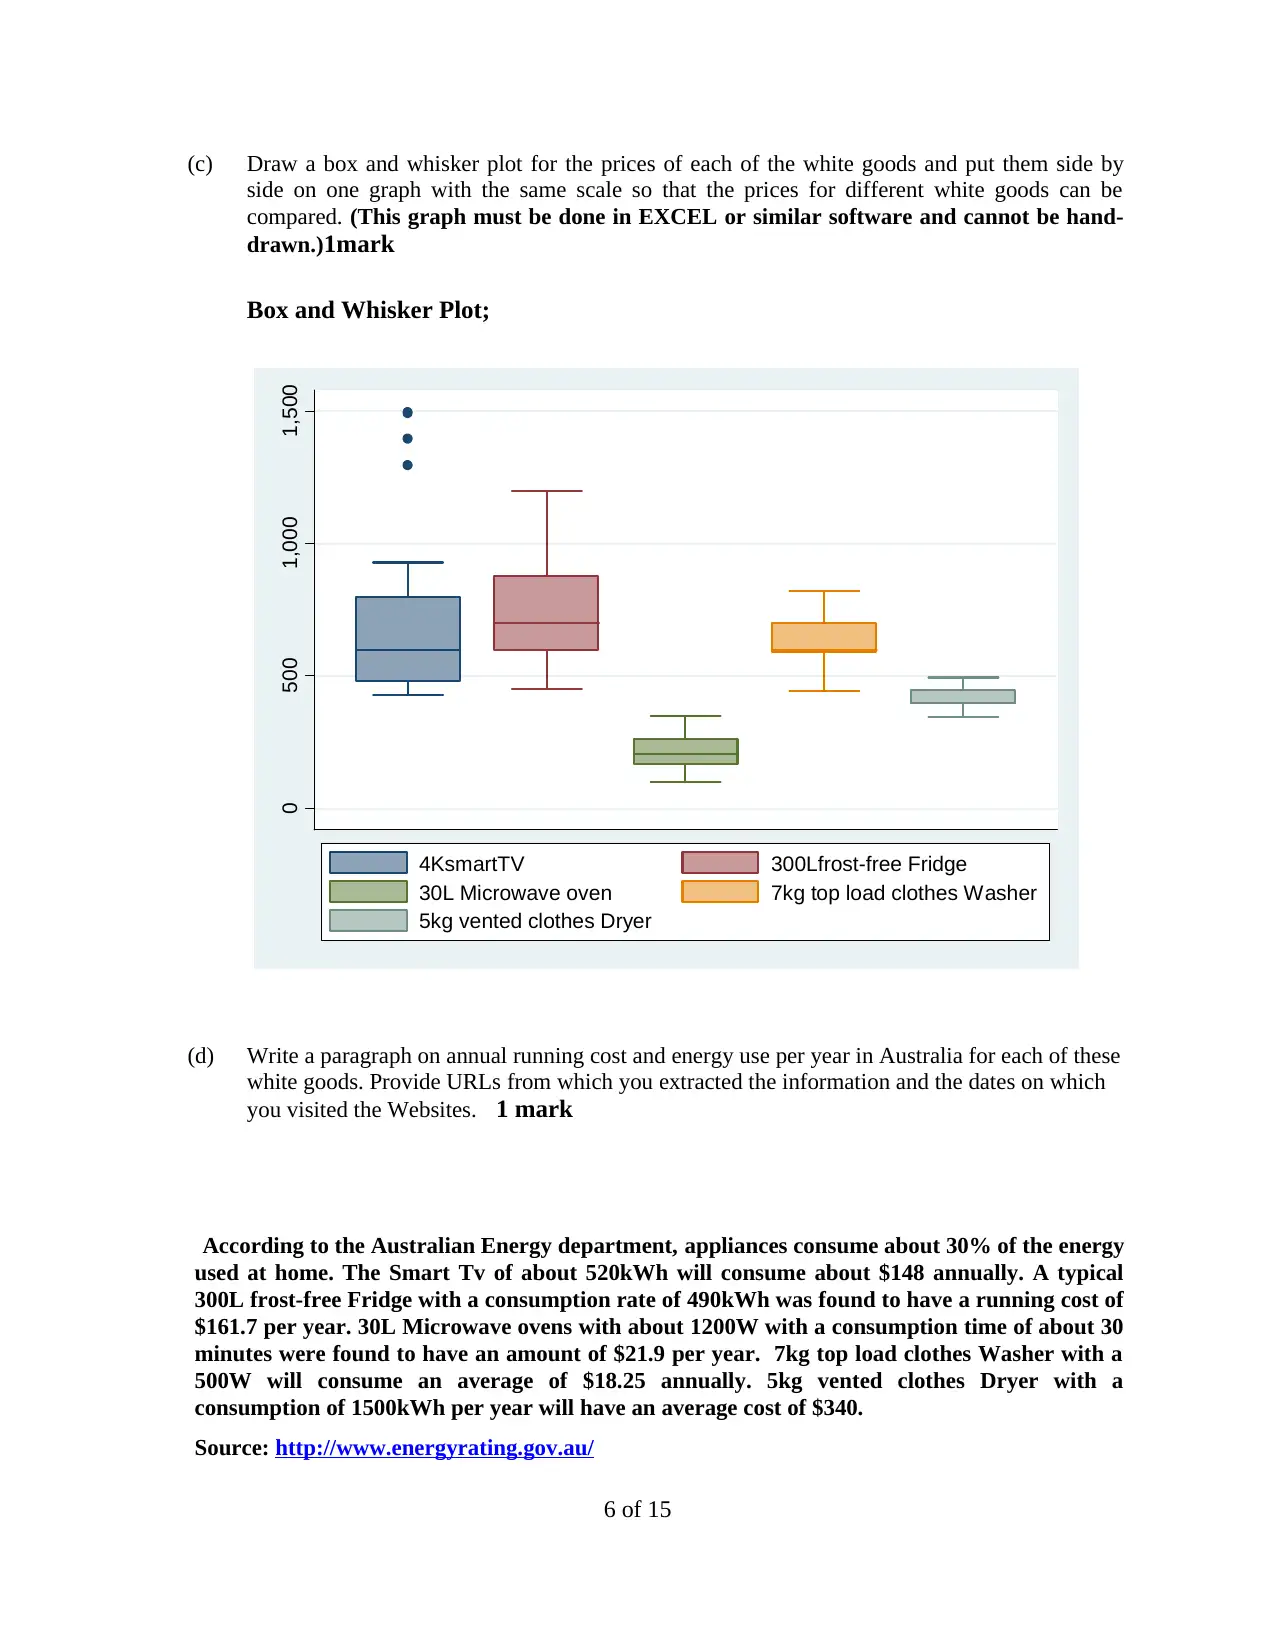
(c) Draw a box and whisker plot for the prices of each of the white goods and put them side by
side on one graph with the same scale so that the prices for different white goods can be
compared. (This graph must be done in EXCEL or similar software and cannot be hand-
drawn.)1mark
Box and Whisker Plot;
0 500 1,000 1,500
4KsmartTV 300Lfrost-free Fridge
30L Microwave oven 7kg top load clothes Washer
5kg vented clothes Dryer
(d) Write a paragraph on annual running cost and energy use per year in Australia for each of these
white goods. Provide URLs from which you extracted the information and the dates on which
you visited the Websites. 1 mark
According to the Australian Energy department, appliances consume about 30% of the energy
used at home. The Smart Tv of about 520kWh will consume about $148 annually. A typical
300L frost-free Fridge with a consumption rate of 490kWh was found to have a running cost of
$161.7 per year. 30L Microwave ovens with about 1200W with a consumption time of about 30
minutes were found to have an amount of $21.9 per year. 7kg top load clothes Washer with a
500W will consume an average of $18.25 annually. 5kg vented clothes Dryer with a
consumption of 1500kWh per year will have an average cost of $340.
Source: http://www.energyrating.gov.au/
6 of 15
⊘ This is a preview!⊘
Do you want full access?
Subscribe today to unlock all pages.
Trusted by 1+ million students worldwide
Question 3 4 Marks
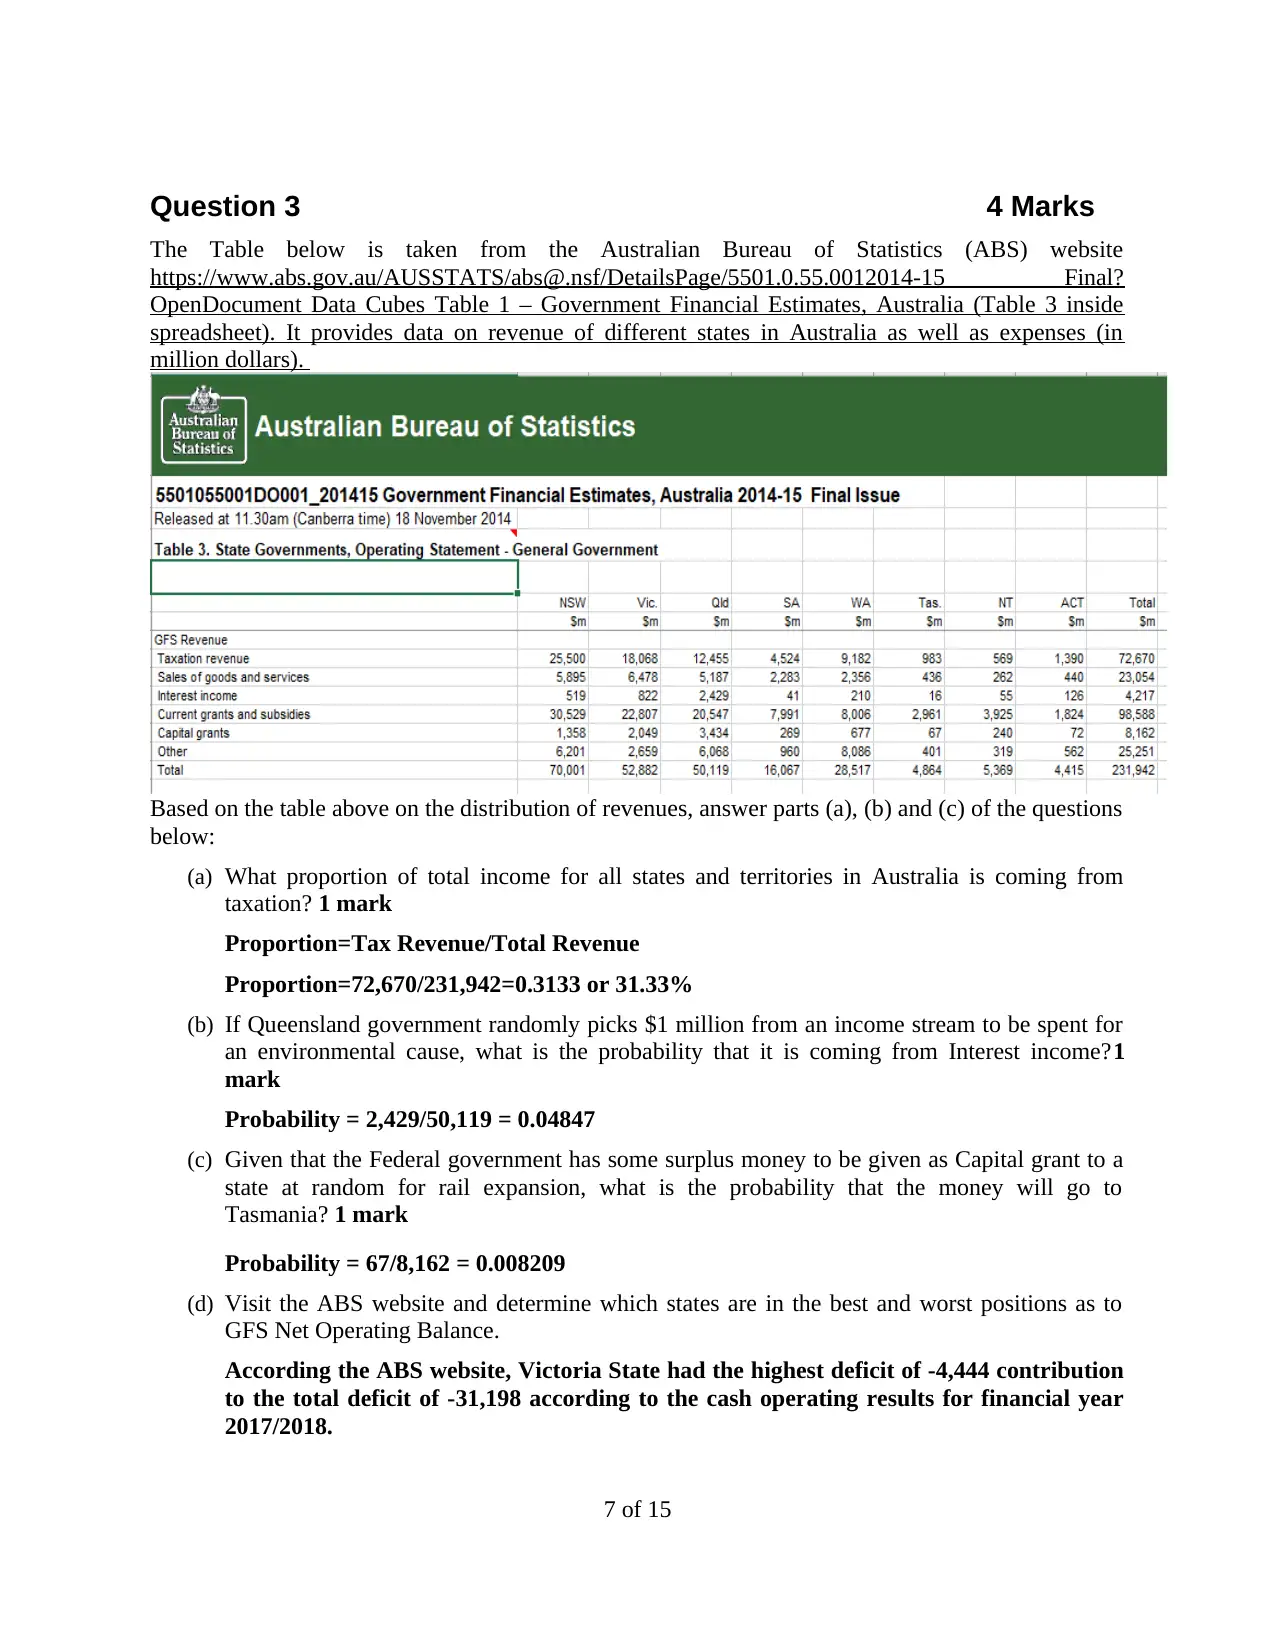
The Table below is taken from the Australian Bureau of Statistics (ABS) website
https://www.abs.gov.au/AUSSTATS/abs@.nsf/DetailsPage/5501.0.55.0012014-15 Final?
OpenDocument Data Cubes Table 1 – Government Financial Estimates, Australia (Table 3 inside
spreadsheet). It provides data on revenue of different states in Australia as well as expenses (in
million dollars).
Based on the table above on the distribution of revenues, answer parts (a), (b) and (c) of the questions
below:
(a) What proportion of total income for all states and territories in Australia is coming from
taxation? 1 mark
Proportion=Tax Revenue/Total Revenue
Proportion=72,670/231,942=0.3133 or 31.33%
(b) If Queensland government randomly picks $1 million from an income stream to be spent for
an environmental cause, what is the probability that it is coming from Interest income?1
mark
Probability = 2,429/50,119 = 0.04847
(c) Given that the Federal government has some surplus money to be given as Capital grant to a
state at random for rail expansion, what is the probability that the money will go to
Tasmania? 1 mark
Probability = 67/8,162 = 0.008209
(d) Visit the ABS website and determine which states are in the best and worst positions as to
GFS Net Operating Balance.
According the ABS website, Victoria State had the highest deficit of -4,444 contribution
to the total deficit of -31,198 according to the cash operating results for financial year
2017/2018.
7 of 15
Paraphrase This Document
Need a fresh take? Get an instant paraphrase of this document with our AI Paraphraser
Question 4 4 Marks
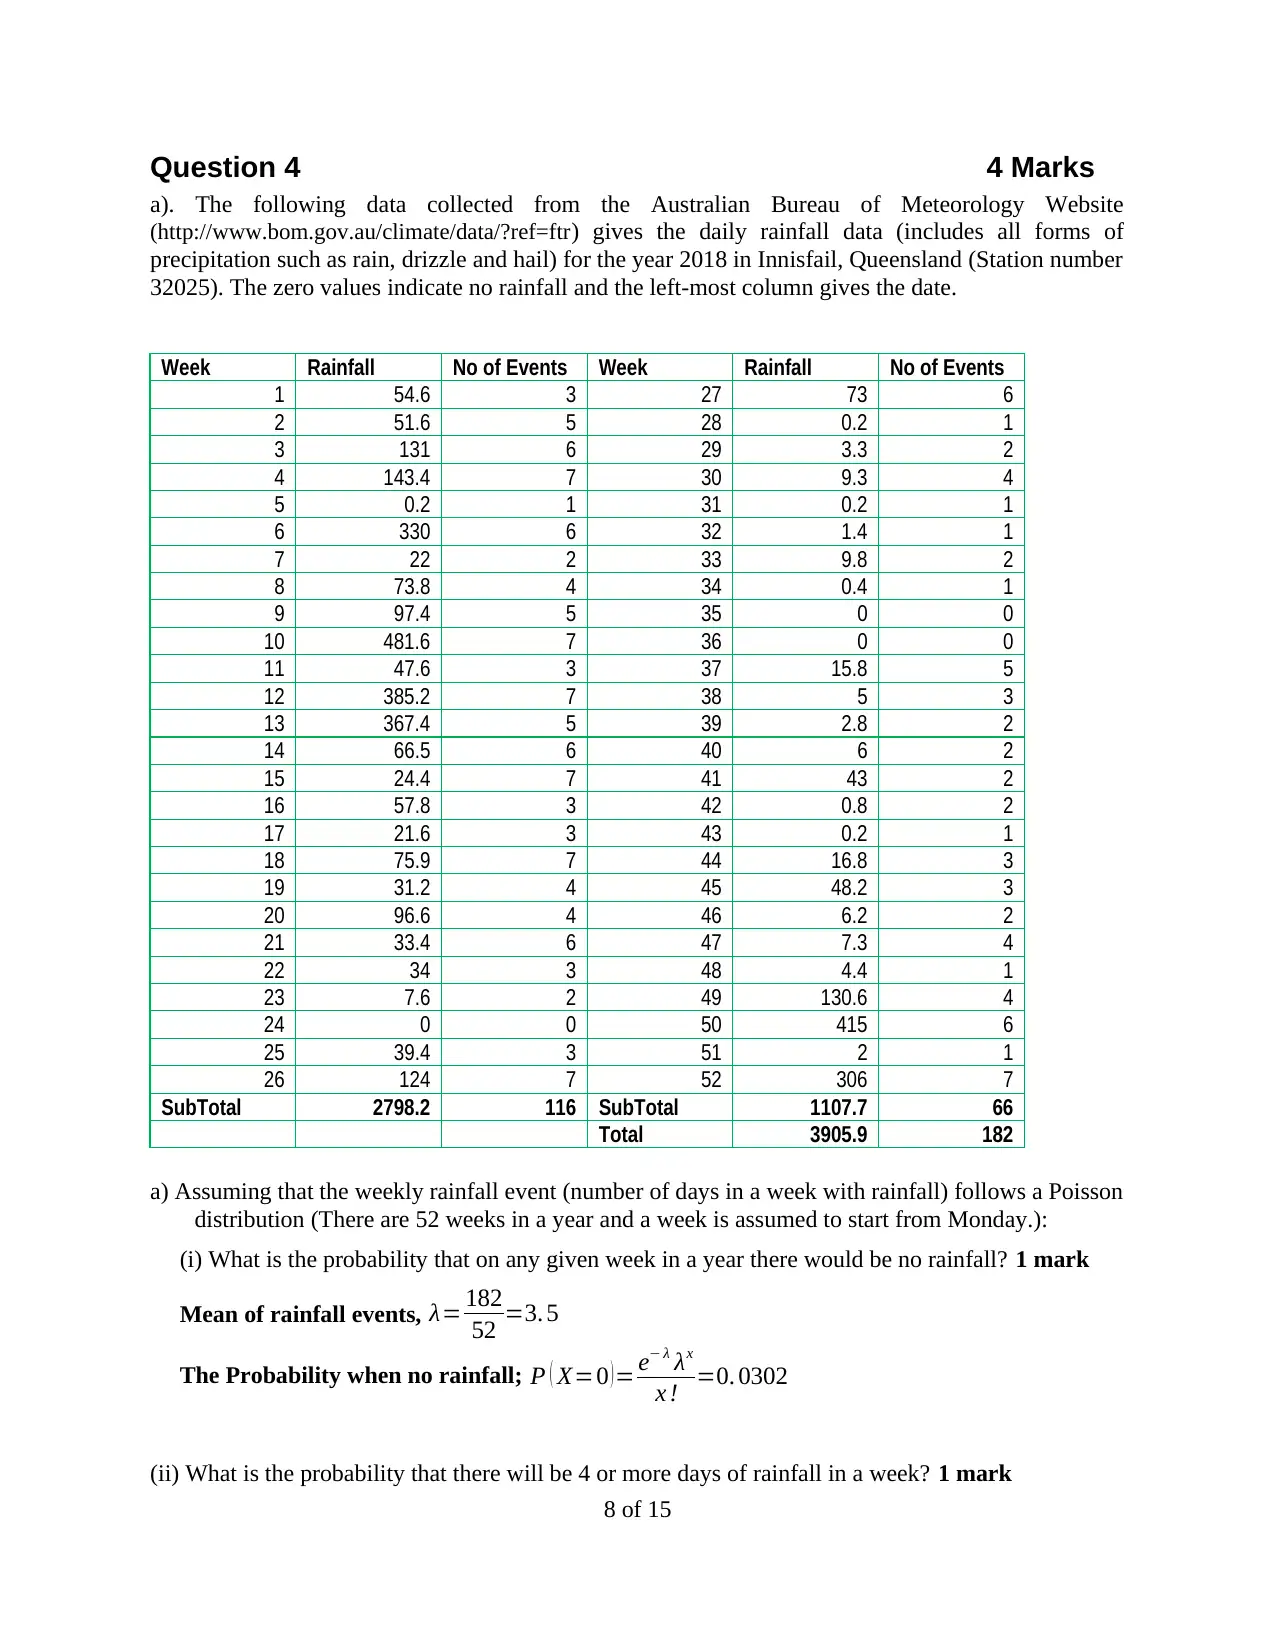
a). The following data collected from the Australian Bureau of Meteorology Website
(http://www.bom.gov.au/climate/data/?ref=ftr) gives the daily rainfall data (includes all forms of
precipitation such as rain, drizzle and hail) for the year 2018 in Innisfail, Queensland (Station number
32025). The zero values indicate no rainfall and the left-most column gives the date.
Week Rainfall No of Events Week Rainfall No of Events
1 54.6 3 27 73 6
2 51.6 5 28 0.2 1
3 131 6 29 3.3 2
4 143.4 7 30 9.3 4
5 0.2 1 31 0.2 1
6 330 6 32 1.4 1
7 22 2 33 9.8 2
8 73.8 4 34 0.4 1
9 97.4 5 35 0 0
10 481.6 7 36 0 0
11 47.6 3 37 15.8 5
12 385.2 7 38 5 3
13 367.4 5 39 2.8 2
14 66.5 6 40 6 2
15 24.4 7 41 43 2
16 57.8 3 42 0.8 2
17 21.6 3 43 0.2 1
18 75.9 7 44 16.8 3
19 31.2 4 45 48.2 3
20 96.6 4 46 6.2 2
21 33.4 6 47 7.3 4
22 34 3 48 4.4 1
23 7.6 2 49 130.6 4
24 0 0 50 415 6
25 39.4 3 51 2 1
26 124 7 52 306 7
SubTotal 2798.2 116 SubTotal 1107.7 66
Total 3905.9 182
a) Assuming that the weekly rainfall event (number of days in a week with rainfall) follows a Poisson
distribution (There are 52 weeks in a year and a week is assumed to start from Monday.):
(i) What is the probability that on any given week in a year there would be no rainfall? 1 mark
Mean of rainfall events, λ= 182
52 =3. 5
The Probability when no rainfall; P ( X=0 )= e− λ λx
x ! =0. 0302
(ii) What is the probability that there will be 4 or more days of rainfall in a week? 1 mark
8 of 15
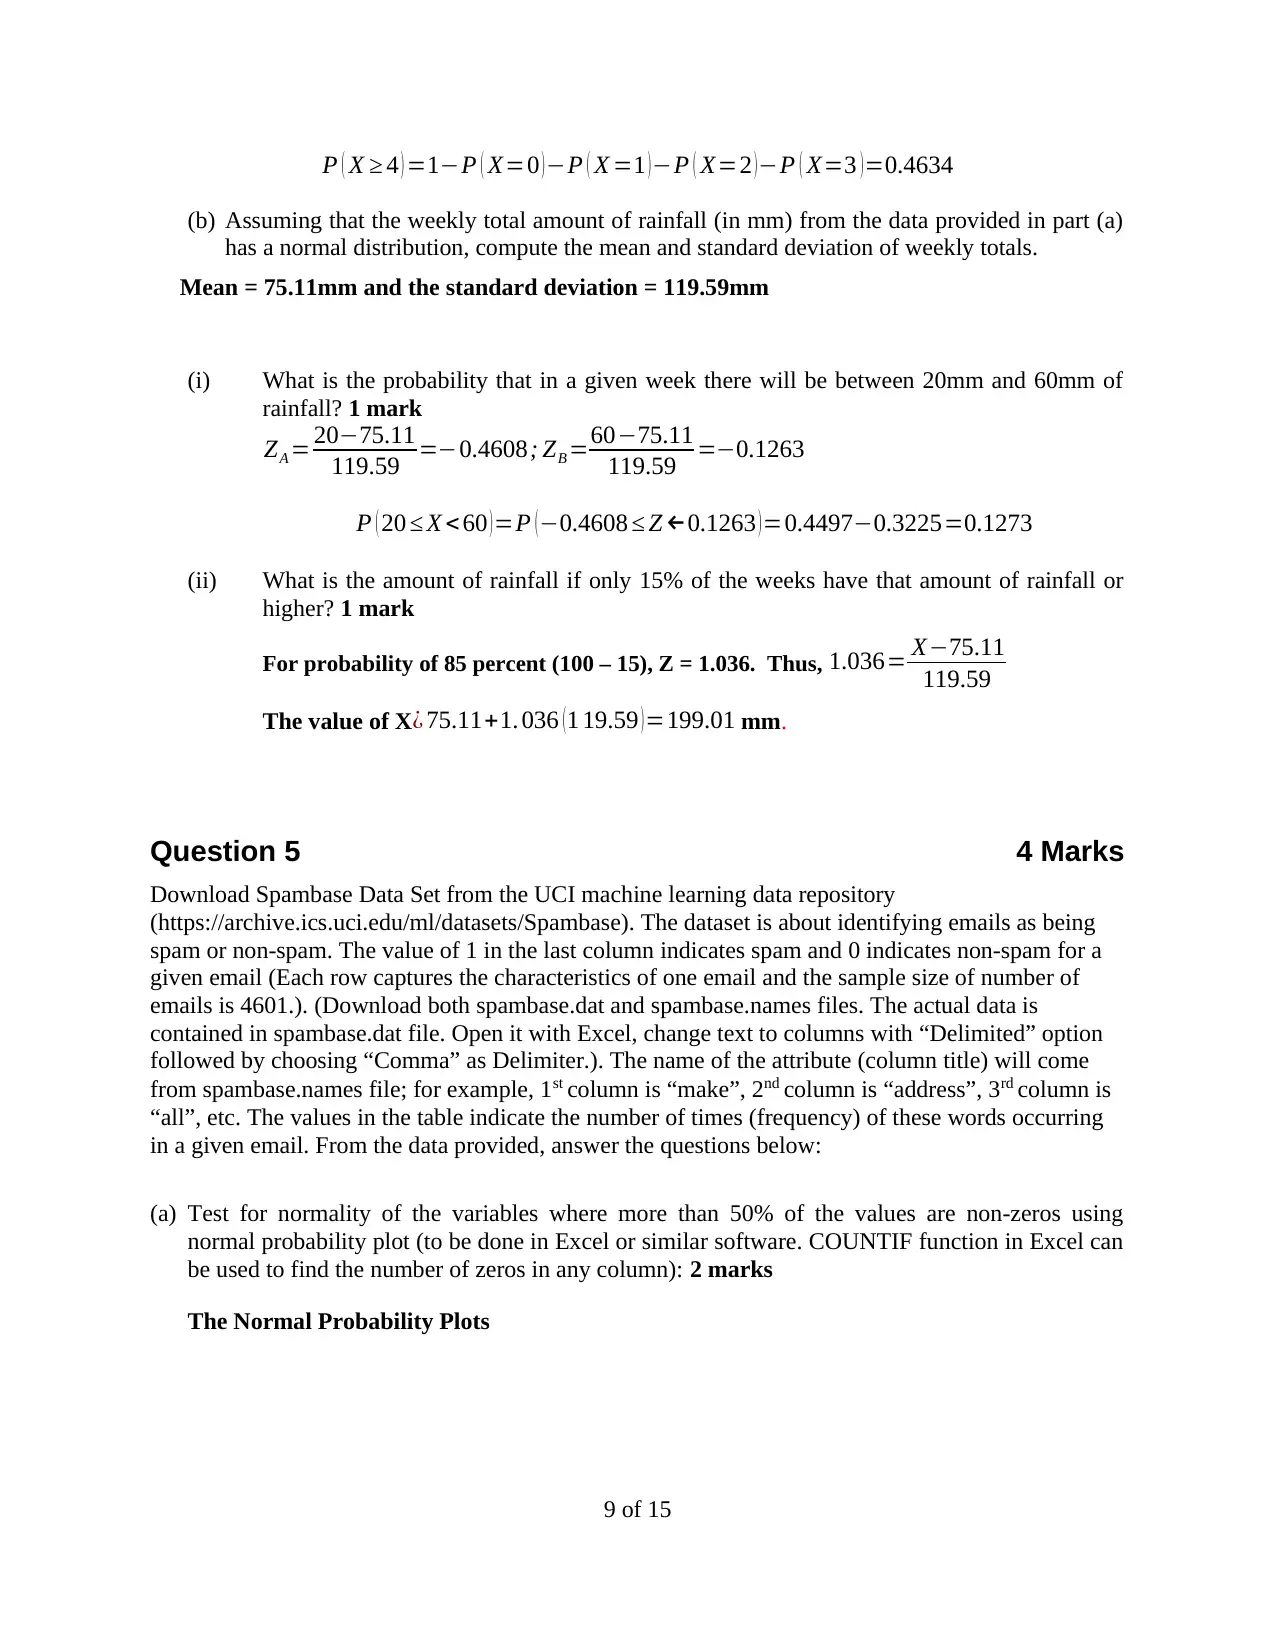
P ( X ≥ 4 ) =1−P ( X=0 ) −P ( X =1 ) −P ( X=2 ) −P ( X=3 ) =0.4634
(b) Assuming that the weekly total amount of rainfall (in mm) from the data provided in part (a)
has a normal distribution, compute the mean and standard deviation of weekly totals.
Mean = 75.11mm and the standard deviation = 119.59mm
(i) What is the probability that in a given week there will be between 20mm and 60mm of
rainfall? 1 mark
ZA = 20−75.11
119.59 =−0.4608; ZB =60−75.11
119.59 =−0.1263
P ( 20 ≤ X < 60 )=P (−0.4608 ≤ Z ←0.1263 )=0.4497−0.3225=0.1273
(ii) What is the amount of rainfall if only 15% of the weeks have that amount of rainfall or
higher? 1 mark
For probability of 85 percent (100 – 15), Z = 1.036. Thus, 1.036= X−75.11
119.59
The value of X¿ 75.11+1. 036 (1 19.59 )=199.01 mm.
Question 5 4 Marks
Download Spambase Data Set from the UCI machine learning data repository
(https://archive.ics.uci.edu/ml/datasets/Spambase). The dataset is about identifying emails as being
spam or non-spam. The value of 1 in the last column indicates spam and 0 indicates non-spam for a
given email (Each row captures the characteristics of one email and the sample size of number of
emails is 4601.). (Download both spambase.dat and spambase.names files. The actual data is
contained in spambase.dat file. Open it with Excel, change text to columns with “Delimited” option
followed by choosing “Comma” as Delimiter.). The name of the attribute (column title) will come
from spambase.names file; for example, 1st column is “make”, 2nd column is “address”, 3rd column is
“all”, etc. The values in the table indicate the number of times (frequency) of these words occurring
in a given email. From the data provided, answer the questions below:
(a) Test for normality of the variables where more than 50% of the values are non-zeros using
normal probability plot (to be done in Excel or similar software. COUNTIF function in Excel can
be used to find the number of zeros in any column): 2 marks
The Normal Probability Plots
9 of 15
⊘ This is a preview!⊘
Do you want full access?
Subscribe today to unlock all pages.
Trusted by 1+ million students worldwide
0 . 0 0 0 . 2 5 0 . 5 0 0 . 7 5 1 . 0 0
N o r m a l F [ ( m a k e - m ) / s ]
0.00 0.25 0.50 0.75 1.00
Empirical P[i] = i/(N+1)
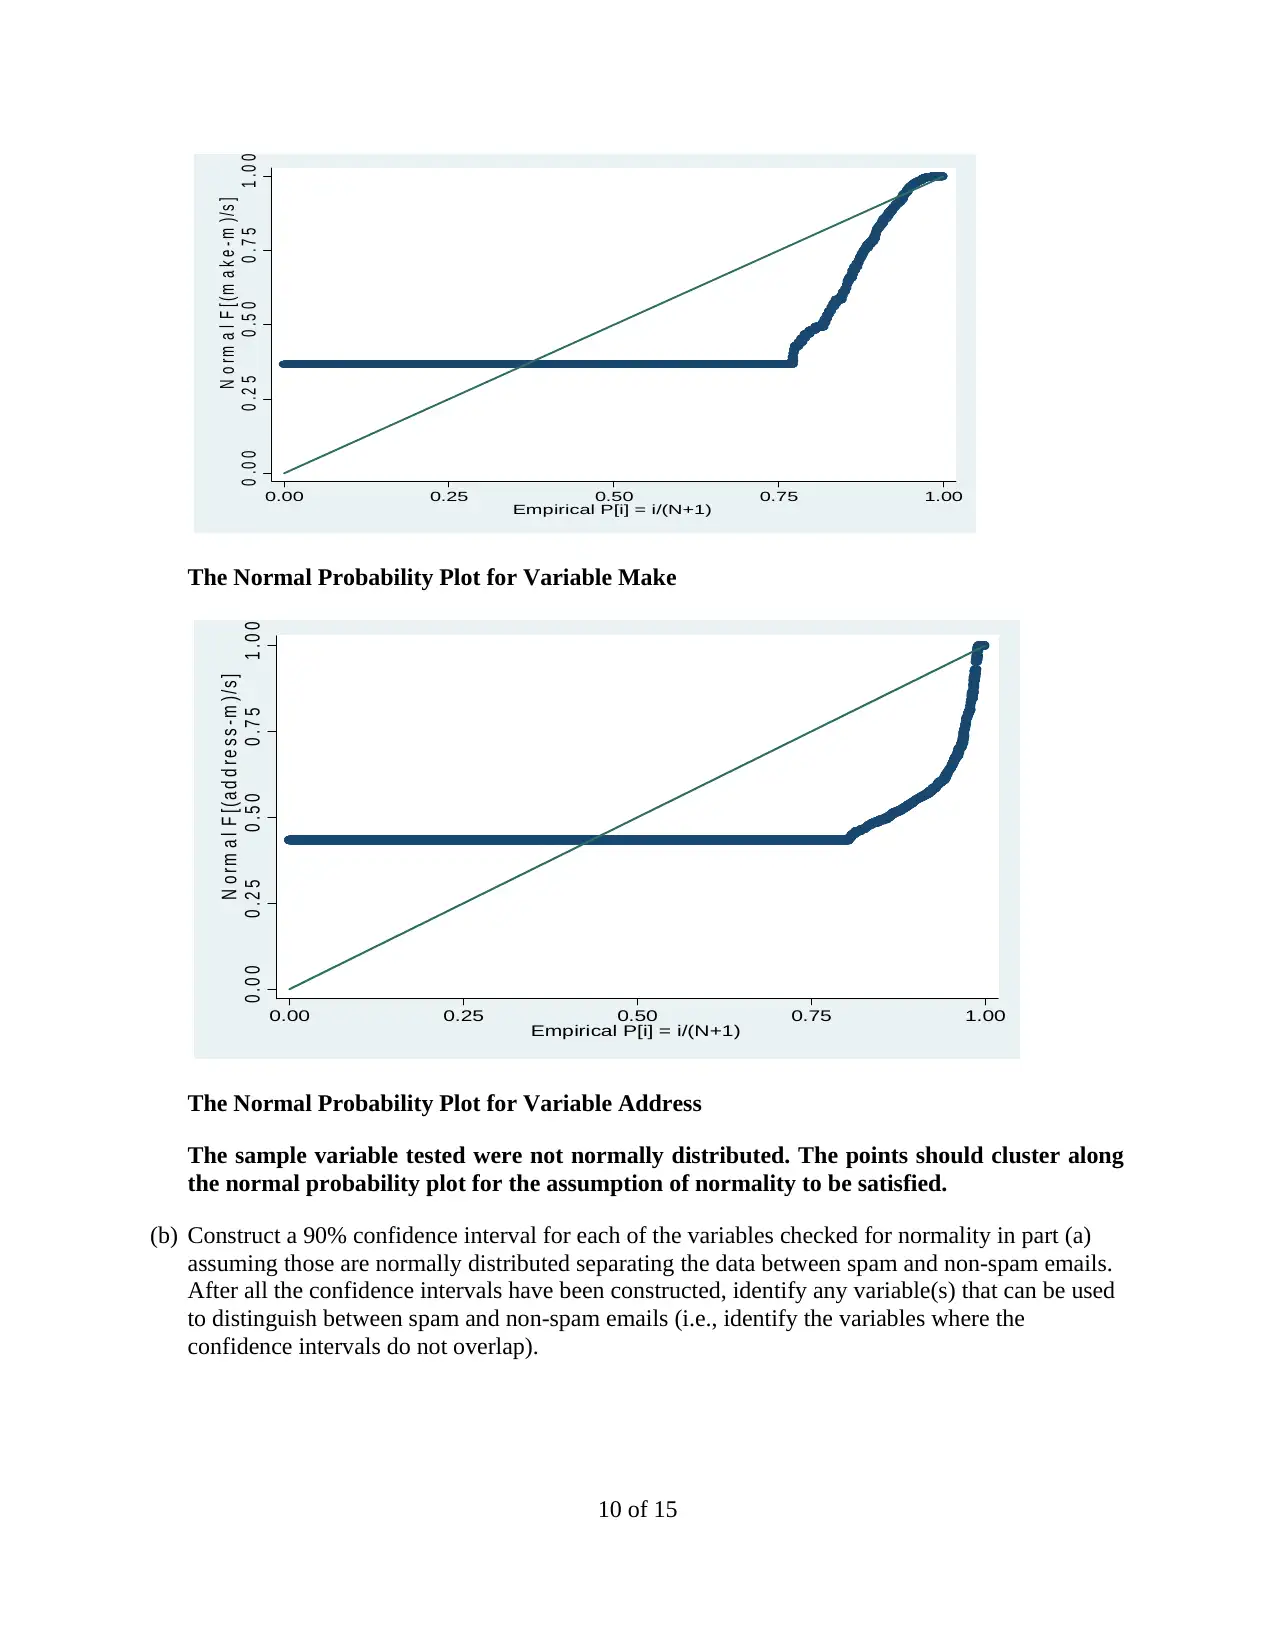
The Normal Probability Plot for Variable Make
0 .0 0 0 .2 5 0 .5 0 0 .7 5 1 .0 0
N o r m a l F [ ( a d d r e s s - m ) /s ]
0.00 0.25 0.50 0.75 1.00
Empirical P[i] = i/(N+1)
The Normal Probability Plot for Variable Address
The sample variable tested were not normally distributed. The points should cluster along
the normal probability plot for the assumption of normality to be satisfied.
(b) Construct a 90% confidence interval for each of the variables checked for normality in part (a)
assuming those are normally distributed separating the data between spam and non-spam emails.
After all the confidence intervals have been constructed, identify any variable(s) that can be used
to distinguish between spam and non-spam emails (i.e., identify the variables where the
confidence intervals do not overlap).
10 of 15
N o r m a l F [ ( m a k e - m ) / s ]
0.00 0.25 0.50 0.75 1.00
Empirical P[i] = i/(N+1)
The Normal Probability Plot for Variable Make
0 .0 0 0 .2 5 0 .5 0 0 .7 5 1 .0 0
N o r m a l F [ ( a d d r e s s - m ) /s ]
0.00 0.25 0.50 0.75 1.00
Empirical P[i] = i/(N+1)
The Normal Probability Plot for Variable Address
The sample variable tested were not normally distributed. The points should cluster along
the normal probability plot for the assumption of normality to be satisfied.
(b) Construct a 90% confidence interval for each of the variables checked for normality in part (a)
assuming those are normally distributed separating the data between spam and non-spam emails.
After all the confidence intervals have been constructed, identify any variable(s) that can be used
to distinguish between spam and non-spam emails (i.e., identify the variables where the
confidence intervals do not overlap).
10 of 15
Paraphrase This Document
Need a fresh take? Get an instant paraphrase of this document with our AI Paraphraser
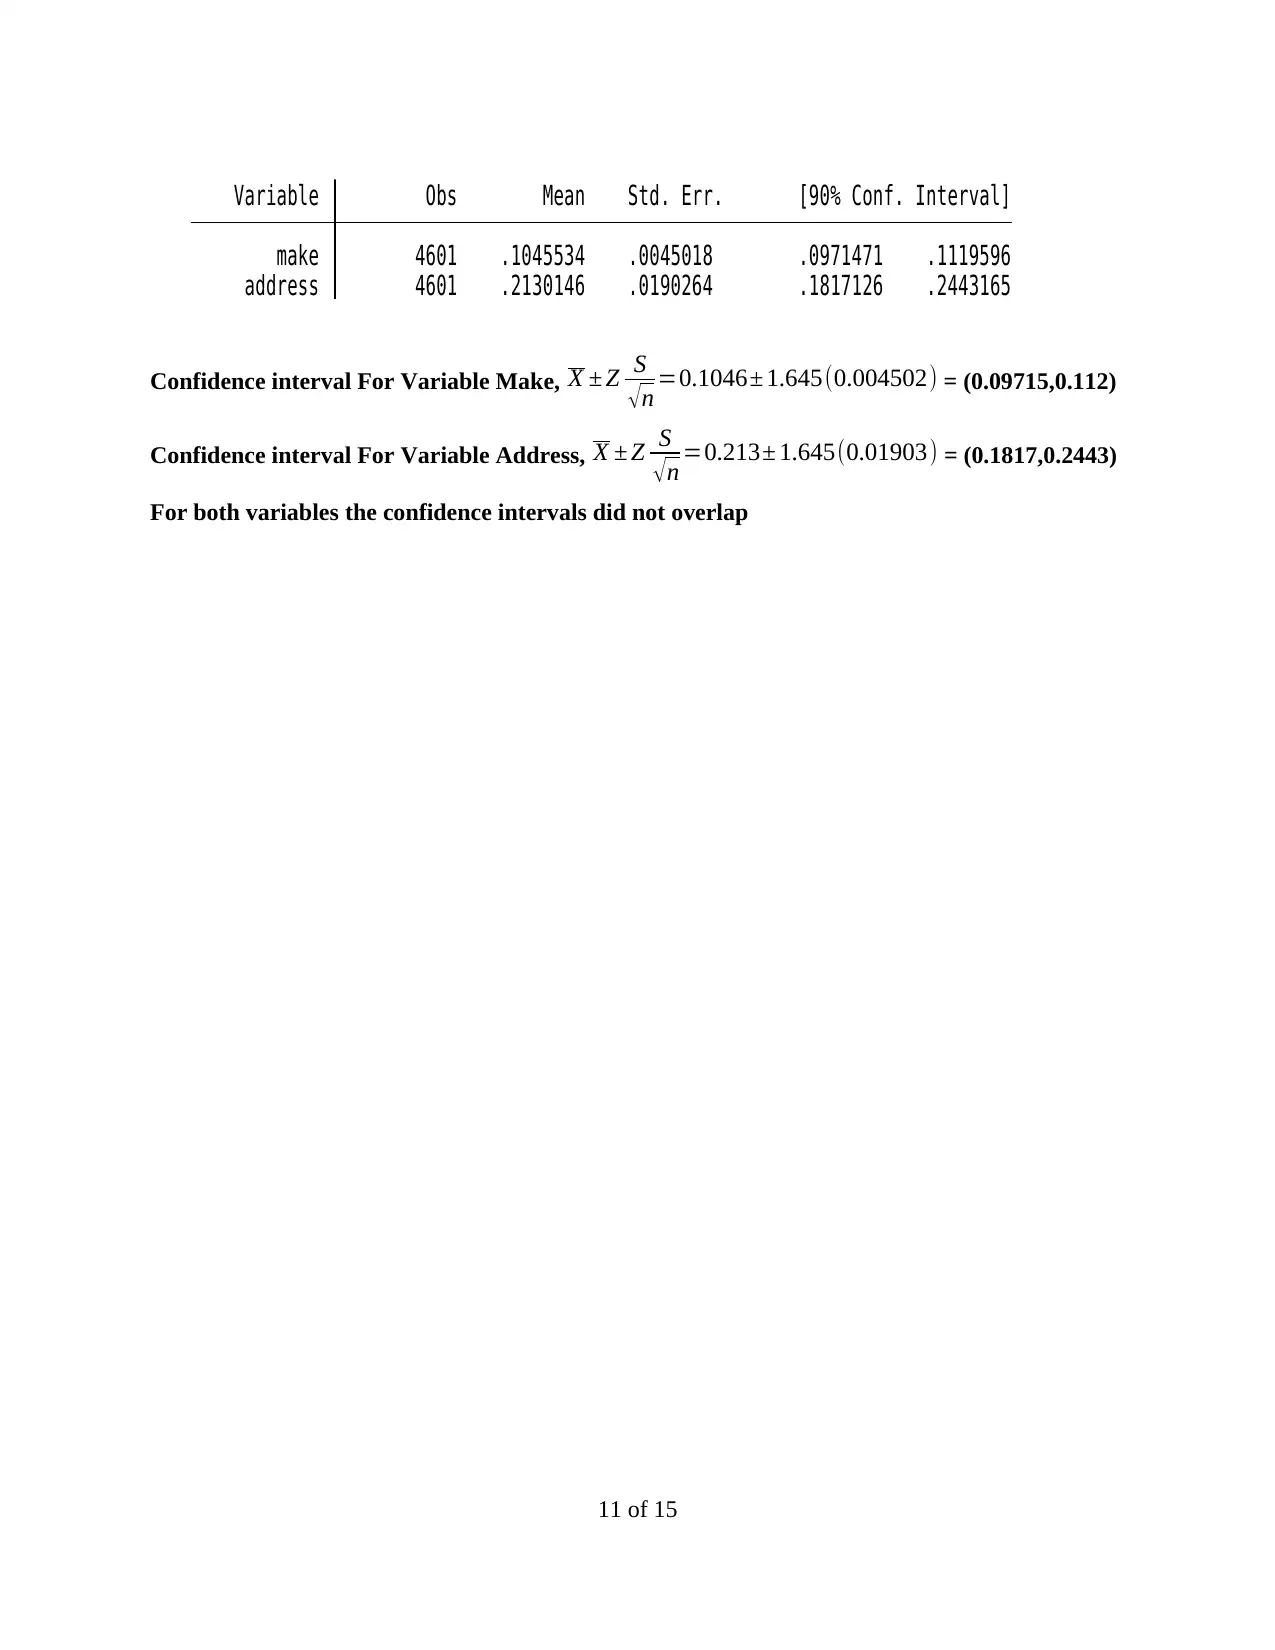
address 4601 .2130146 .0190264 .1817126 .2443165
make 4601 .1045534 .0045018 .0971471 .1119596
Variable Obs Mean Std. Err. [90% Conf. Interval]
Confidence interval For Variable Make, X ± Z S
√n =0.1046± 1.645(0.004502) = (0.09715,0.112)
Confidence interval For Variable Address, X ± Z S
√n =0.213± 1.645(0.01903) = (0.1817,0.2443)
For both variables the confidence intervals did not overlap
11 of 15
1 out of 11
Related Documents


Your All-in-One AI-Powered Toolkit for Academic Success.
+13062052269
info@desklib.com
Available 24*7 on WhatsApp / Email
![[object Object]](/_next/static/media/star-bottom.7253800d.svg)
Unlock your academic potential
Copyright © 2020–2026 A2Z Services. All Rights Reserved. Developed and managed by ZUCOL.