Statistics Assignment: Analysis, Probability, and Distributions
VerifiedAdded on 2023/06/05
|18
|1097
|365
Homework Assignment
AI Summary
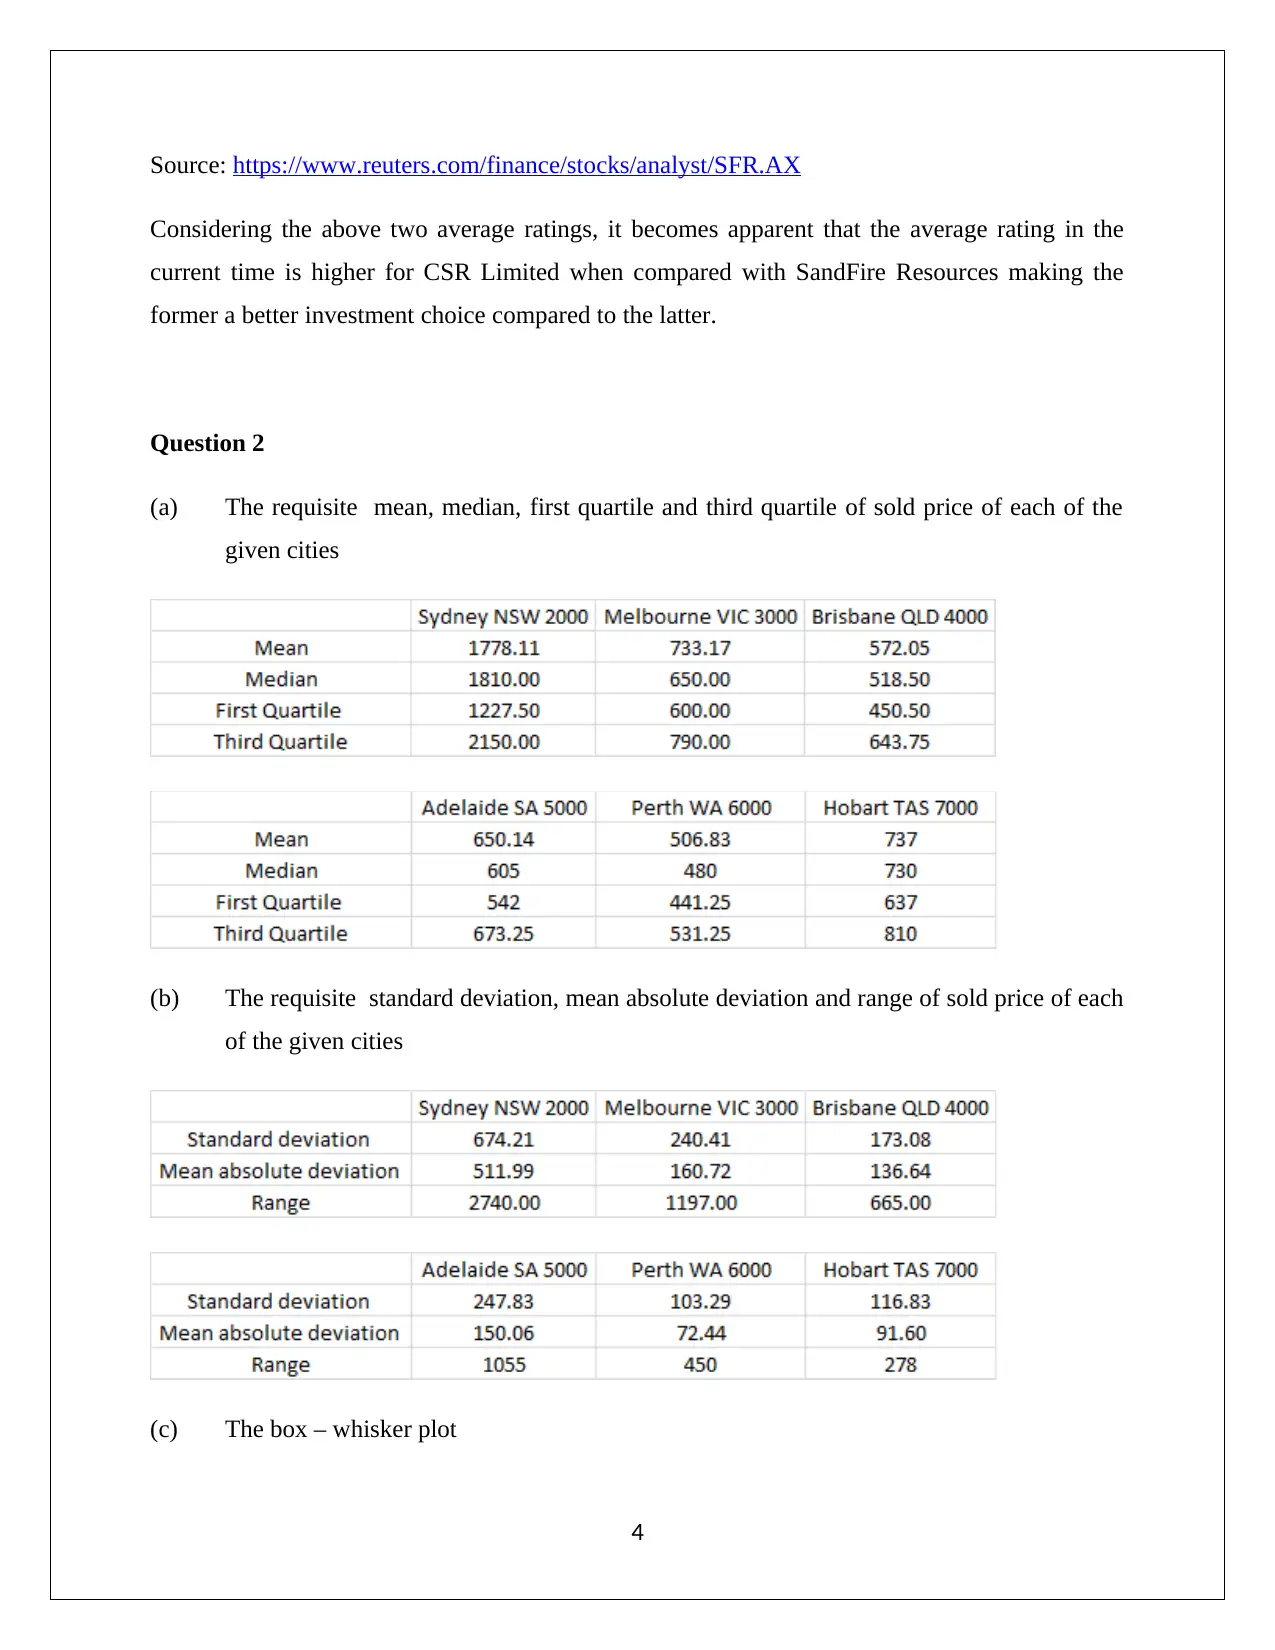
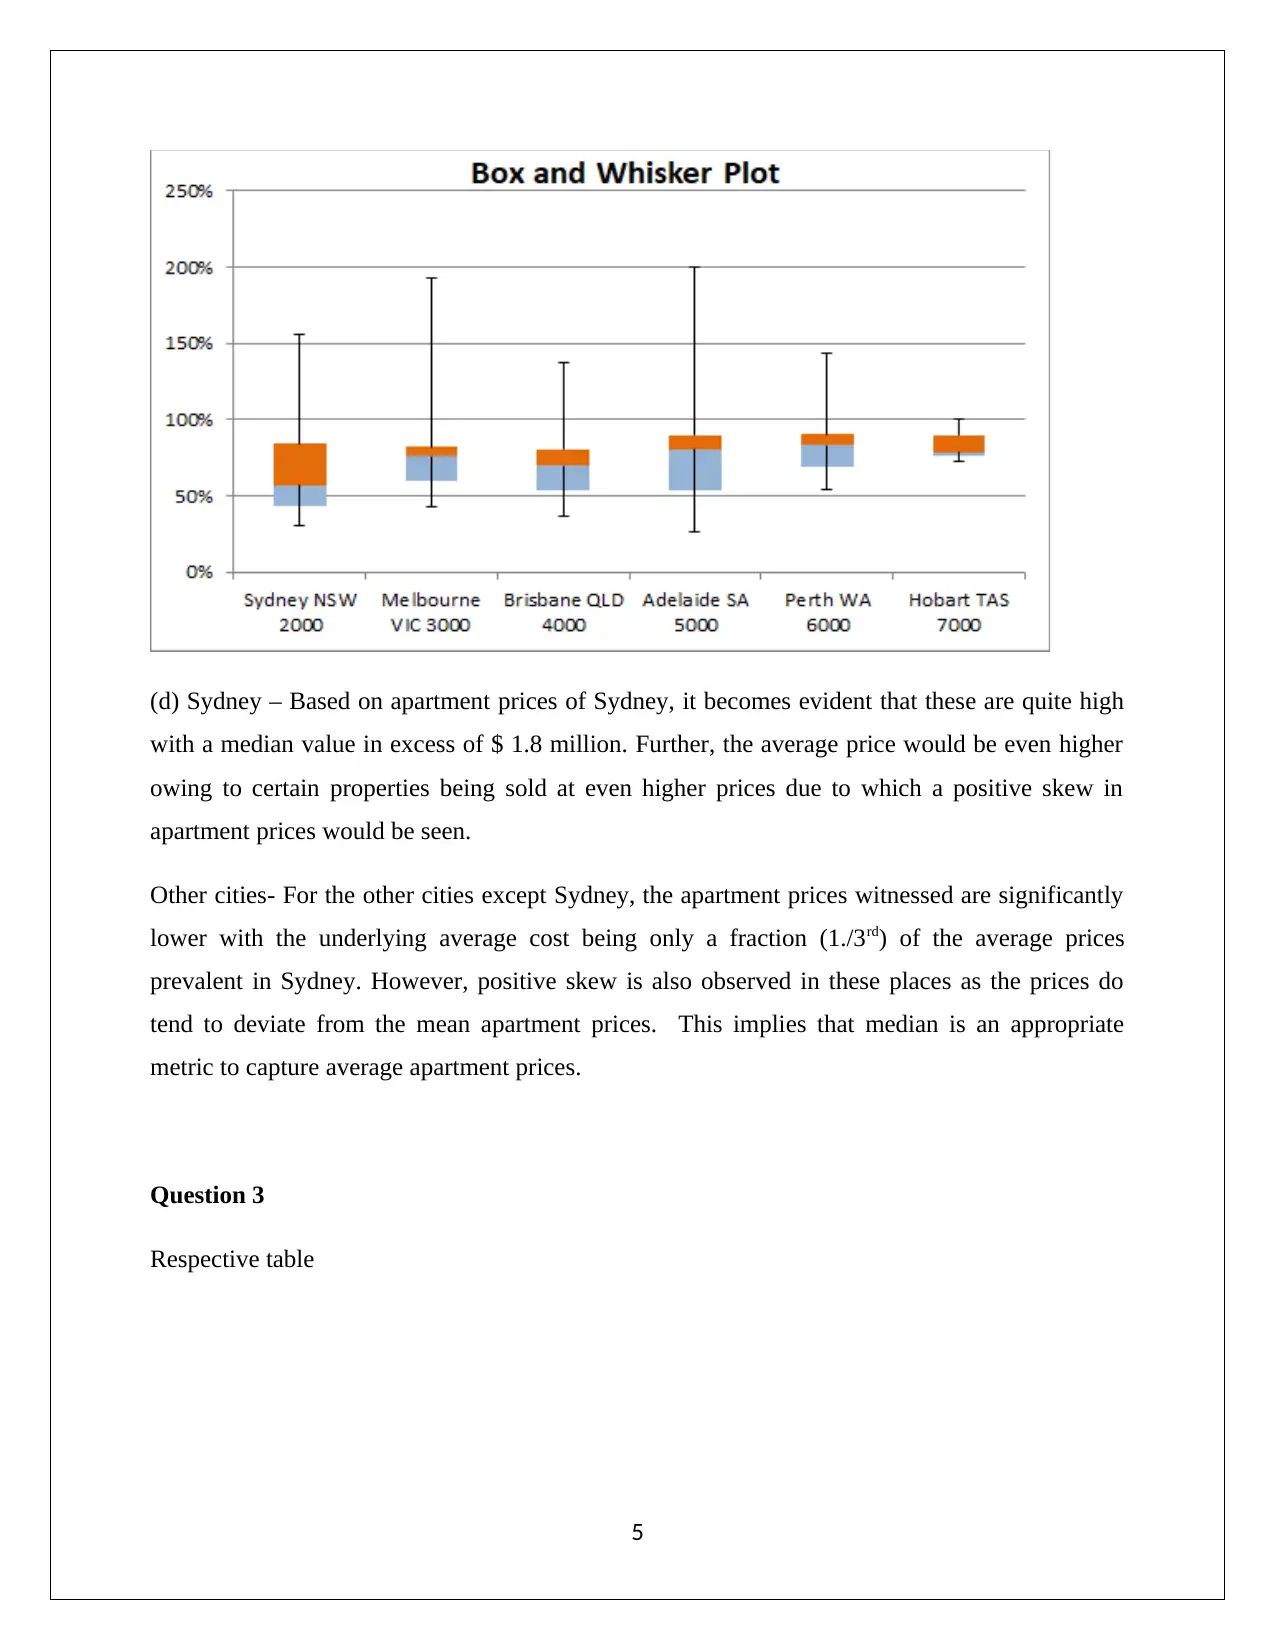
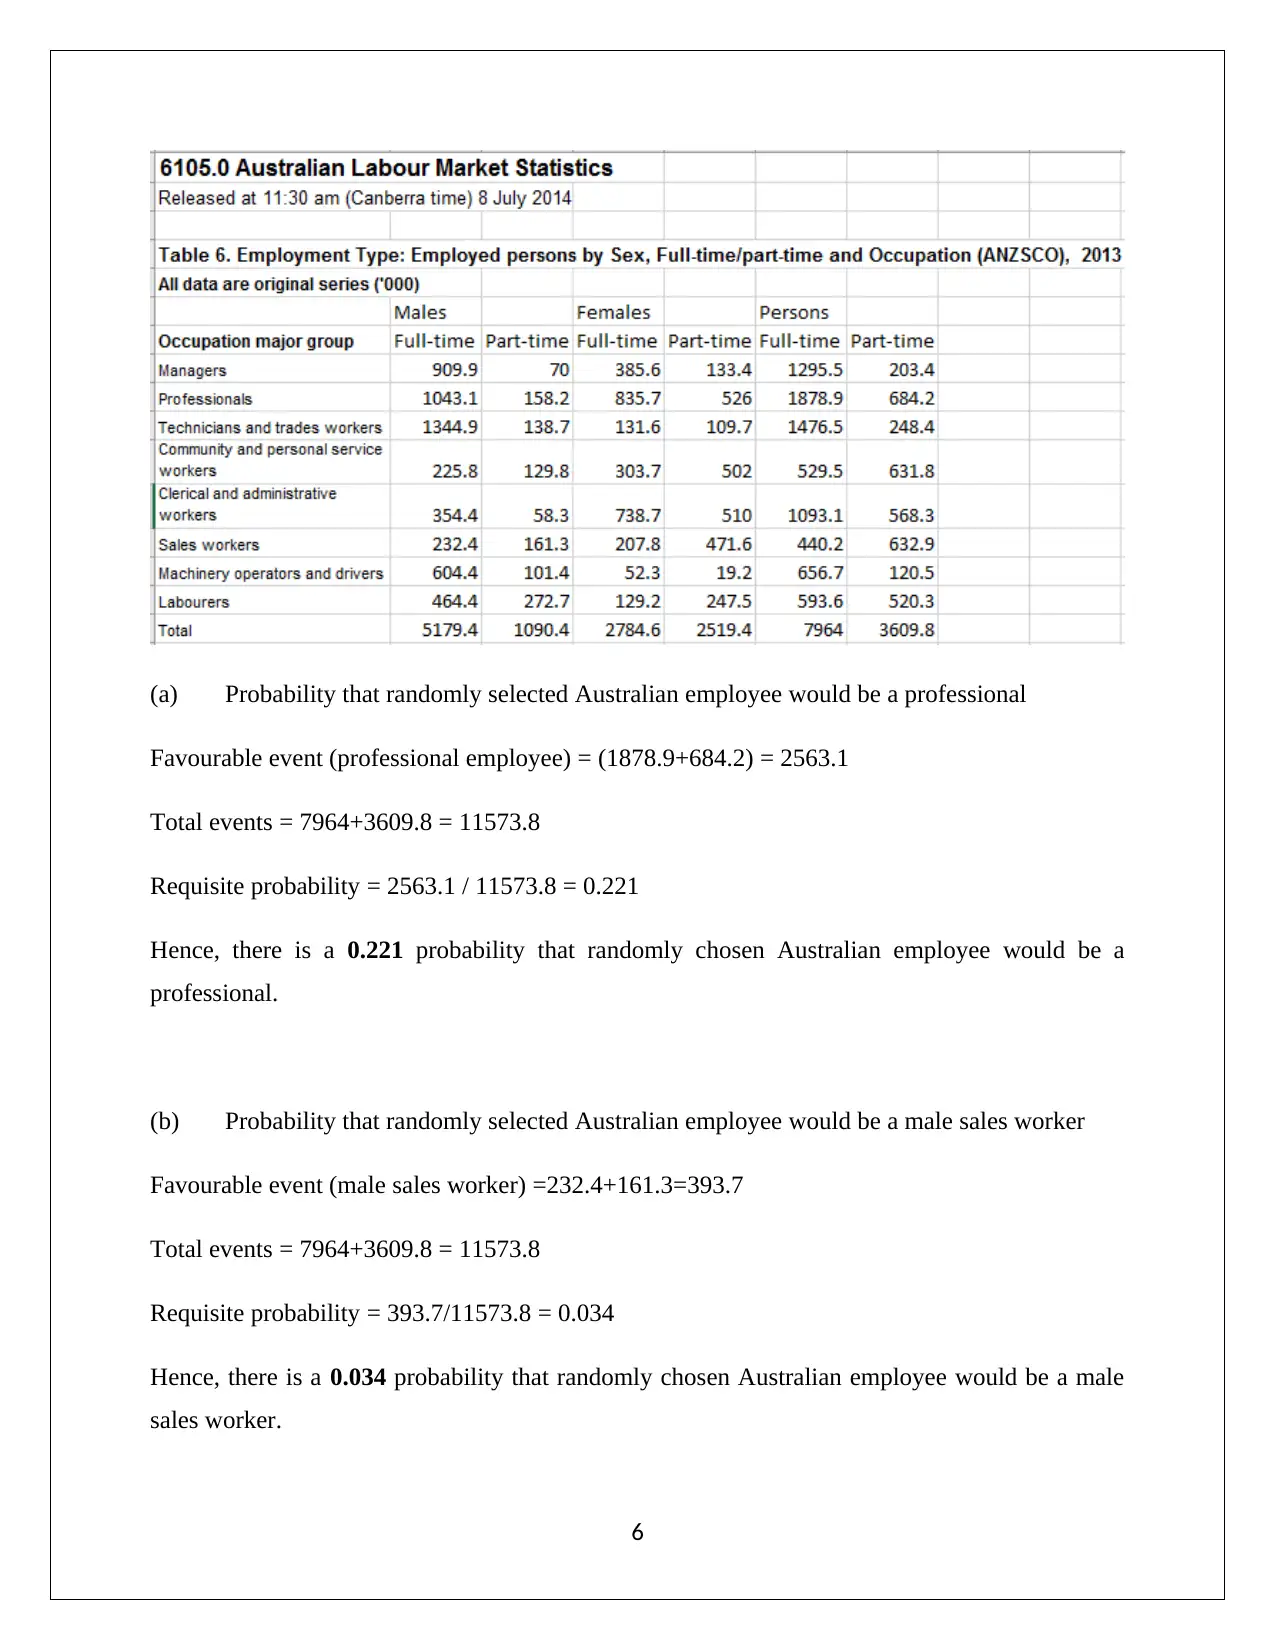
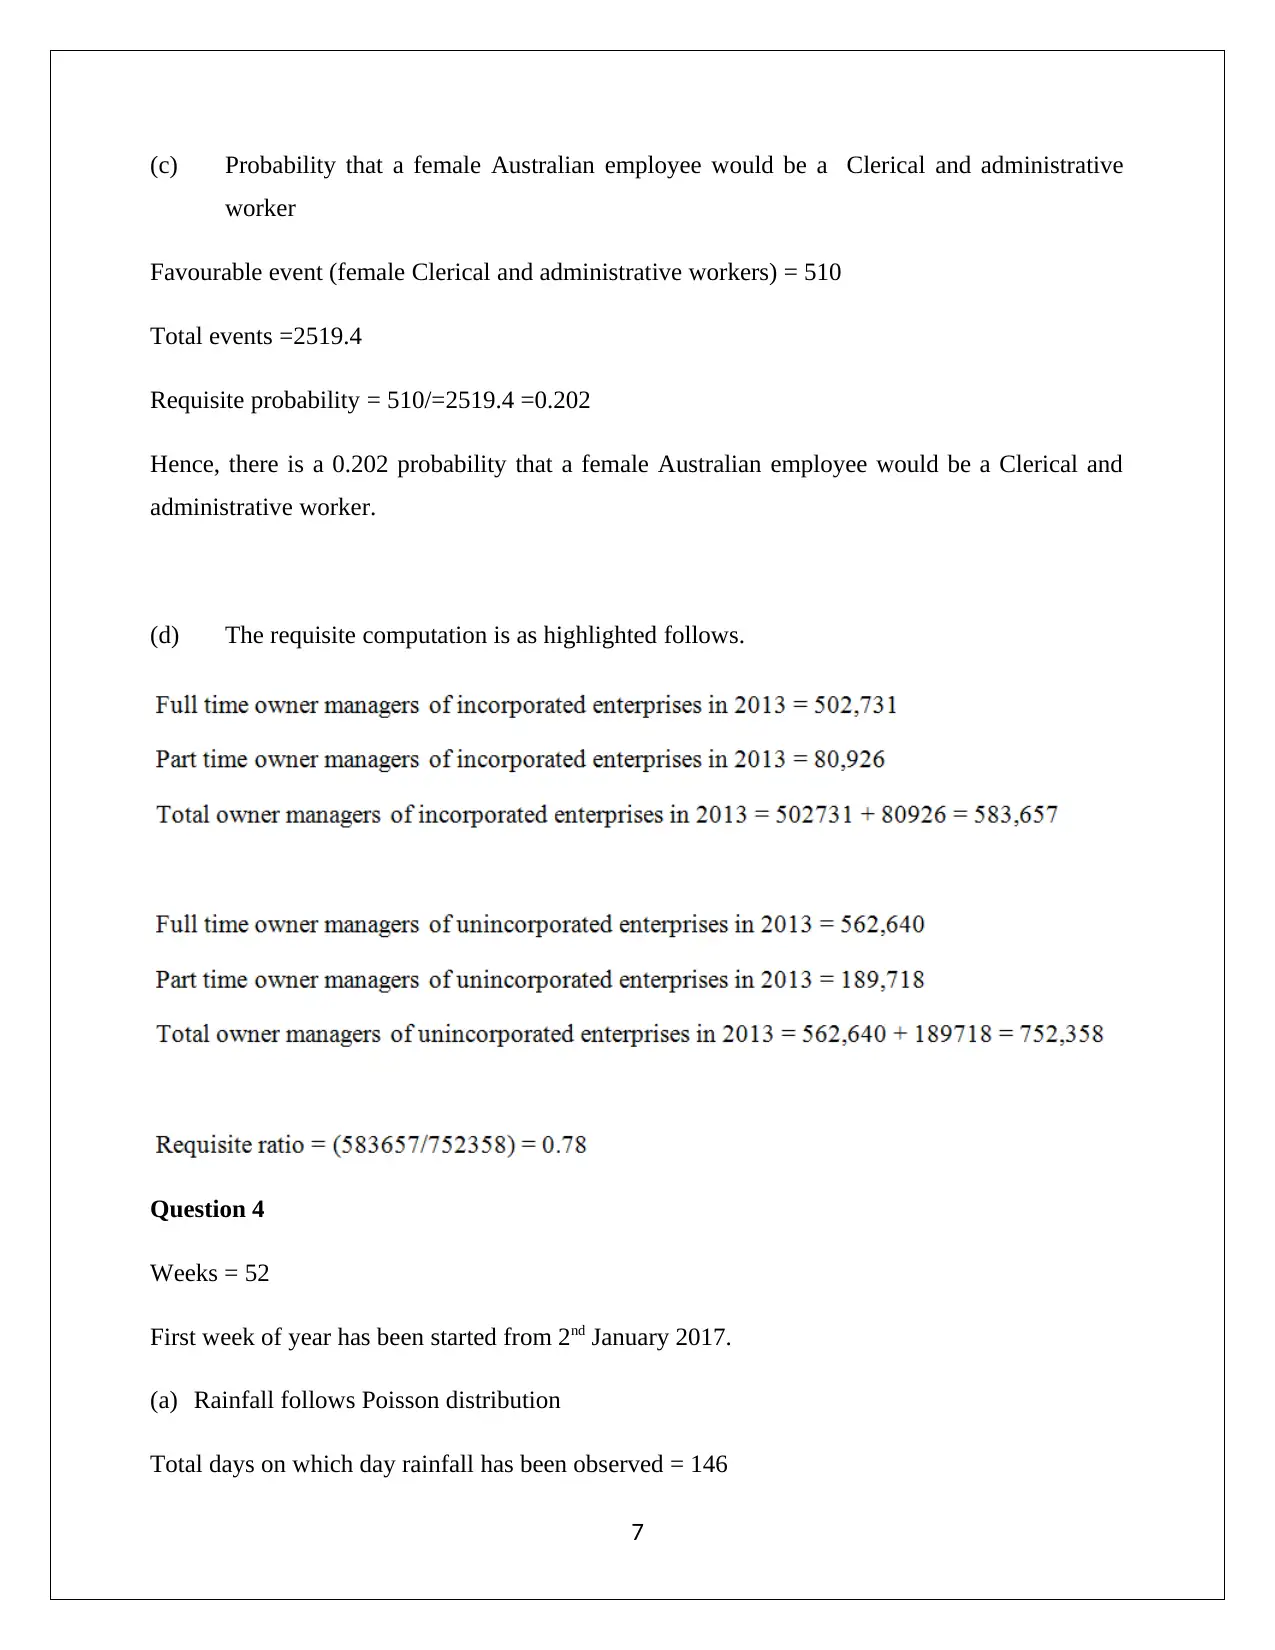
This document presents a comprehensive statistics assignment solution. It begins with data analysis using stem and leaf plots, frequency histograms, and bar charts, followed by an analysis of analyst recommendations. The assignment then delves into descriptive statistics, including mean, median, standard deviation, and box-whisker plots, applied to real-world data. Probability calculations are performed, addressing both discrete (Poisson) and continuous (Normal) distributions with related computations. The final section includes the creation and interpretation of normal probability plots and the computation of confidence intervals to assess the significance of variables related to absenteeism. The assignment covers a broad range of statistical concepts and techniques, providing a complete analysis of the provided data.

STATISTICS
Student Name
[Pick the date]
Student Name
[Pick the date]
Paraphrase This Document
Need a fresh take? Get an instant paraphrase of this document with our AI Paraphraser

Question 1
a) Quarterly opening prices (January, April, July and October) for CSR and SFR
Stem and leaf plot (SFR left leafs and CSR right leafs)
(b) Relevant graph
1
a) Quarterly opening prices (January, April, July and October) for CSR and SFR
Stem and leaf plot (SFR left leafs and CSR right leafs)
(b) Relevant graph
1

CSR: Frequency histogram,
SFR: Frequency polygon
(c) Requisite bar chart highlighting the market capitalization is as shown below.
2
SFR: Frequency polygon
(c) Requisite bar chart highlighting the market capitalization is as shown below.
2
⊘ This is a preview!⊘
Do you want full access?
Subscribe today to unlock all pages.

Trusted by 1+ million students worldwide

(d) The analyst recommendations at present in relation to CSR Limited are summarised below.
Source: https://www.reuters.com/finance/stocks/analyst/CSR.AX
The corresponding analyst recommendations at present in relation to SandFire Resoruces are
summarised below.
3
Source: https://www.reuters.com/finance/stocks/analyst/CSR.AX
The corresponding analyst recommendations at present in relation to SandFire Resoruces are
summarised below.
3
Paraphrase This Document
Need a fresh take? Get an instant paraphrase of this document with our AI Paraphraser

Source: https://www.reuters.com/finance/stocks/analyst/SFR.AX
Considering the above two average ratings, it becomes apparent that the average rating in the
current time is higher for CSR Limited when compared with SandFire Resources making the
former a better investment choice compared to the latter.
Question 2
(a) The requisite mean, median, first quartile and third quartile of sold price of each of the
given cities
(b) The requisite standard deviation, mean absolute deviation and range of sold price of each
of the given cities
(c) The box – whisker plot
4

(d) Sydney – Based on apartment prices of Sydney, it becomes evident that these are quite high
with a median value in excess of $ 1.8 million. Further, the average price would be even higher
owing to certain properties being sold at even higher prices due to which a positive skew in
apartment prices would be seen.
Other cities- For the other cities except Sydney, the apartment prices witnessed are significantly
lower with the underlying average cost being only a fraction (1./3rd) of the average prices
prevalent in Sydney. However, positive skew is also observed in these places as the prices do
tend to deviate from the mean apartment prices. This implies that median is an appropriate
metric to capture average apartment prices.
Question 3
Respective table
5
⊘ This is a preview!⊘
Do you want full access?
Subscribe today to unlock all pages.

Trusted by 1+ million students worldwide

(a) Probability that randomly selected Australian employee would be a professional
Favourable event (professional employee) = (1878.9+684.2) = 2563.1
Total events = 7964+3609.8 = 11573.8
Requisite probability = 2563.1 / 11573.8 = 0.221
Hence, there is a 0.221 probability that randomly chosen Australian employee would be a
professional.
(b) Probability that randomly selected Australian employee would be a male sales worker
Favourable event (male sales worker) =232.4+161.3=393.7
Total events = 7964+3609.8 = 11573.8
Requisite probability = 393.7/11573.8 = 0.034
Hence, there is a 0.034 probability that randomly chosen Australian employee would be a male
sales worker.
6
Paraphrase This Document
Need a fresh take? Get an instant paraphrase of this document with our AI Paraphraser

(c) Probability that a female Australian employee would be a Clerical and administrative
worker
Favourable event (female Clerical and administrative workers) = 510
Total events =2519.4
Requisite probability = 510/=2519.4 =0.202
Hence, there is a 0.202 probability that a female Australian employee would be a Clerical and
administrative worker.
(d) The requisite computation is as highlighted follows.
Question 4
Weeks = 52
First week of year has been started from 2nd January 2017.
(a) Rainfall follows Poisson distribution
Total days on which day rainfall has been observed = 146
7

Mean days per unit week = 146/52 = 2.80769
(i) Probability of no rainfall (x= 0)
P(x=0)= ( 2.80769 )0 × e−2.80769
0 ! =0.06034
(ii) Probability of rainfall for 3 days or more in one week
P ( x> ¿3 ) =1−P ( x <3 ) =1− { ( 2.80769 ) 3 ×e−2.80769
3 ! }=0.3098
(b) Rainfall follows Normal distribution
Sum of rainfall in a year = 491.4 mm
Weeks = 52
Rainfall per unit week (mean) = 491.4/52 = 9.45 mm
Standard deviation of rainfall = 13.726 mm
S.E. (standard error) = 13.726/sqrt (52) = 1.9035
Now,
(i) Probability that rainfall would between 3 mm to 9 mm in one week in the year
P ( 3≤ x ≤ 9 )=P {(3−9.45
1.9035 )< Z <( 9−9.45
1.9035 ) }=P (−3.38< z<−0.236 )=0.406
(ii) Rainfall amount would be computed when the 15% of weeks in the year would observed
that amount of rainfall or more than amount.
Assume,
Requisite rainfall amount be x mm
8
⊘ This is a preview!⊘
Do you want full access?
Subscribe today to unlock all pages.

Trusted by 1+ million students worldwide

As per given information, the following equation can be drawn.
P ( Rainfall>x ) =15 %
Here, z value = NORMSINVE (0.15) = -1.03643
For z value (normal distributional)
( x−9.45
1.9035 )=−1.03643
x=7.47 mm
Hence, the requisite rainfall amount would be 7.47 mm.
Question 5
(a) Normal probability plot for the requisite variables
9
P ( Rainfall>x ) =15 %
Here, z value = NORMSINVE (0.15) = -1.03643
For z value (normal distributional)
( x−9.45
1.9035 )=−1.03643
x=7.47 mm
Hence, the requisite rainfall amount would be 7.47 mm.
Question 5
(a) Normal probability plot for the requisite variables
9
Paraphrase This Document
Need a fresh take? Get an instant paraphrase of this document with our AI Paraphraser

10

11
⊘ This is a preview!⊘
Do you want full access?
Subscribe today to unlock all pages.

Trusted by 1+ million students worldwide
1 out of 18

Your All-in-One AI-Powered Toolkit for Academic Success.
+13062052269
info@desklib.com
Available 24*7 on WhatsApp / Email
Unlock your academic potential
Copyright © 2020–2025 A2Z Services. All Rights Reserved. Developed and managed by ZUCOL.