Statistics Assignment: Mean, Standard Deviation, and Variance Analysis

Verified

Added on  2019/09/23

|3
|299
|96
Homework Assignment
AI Summary
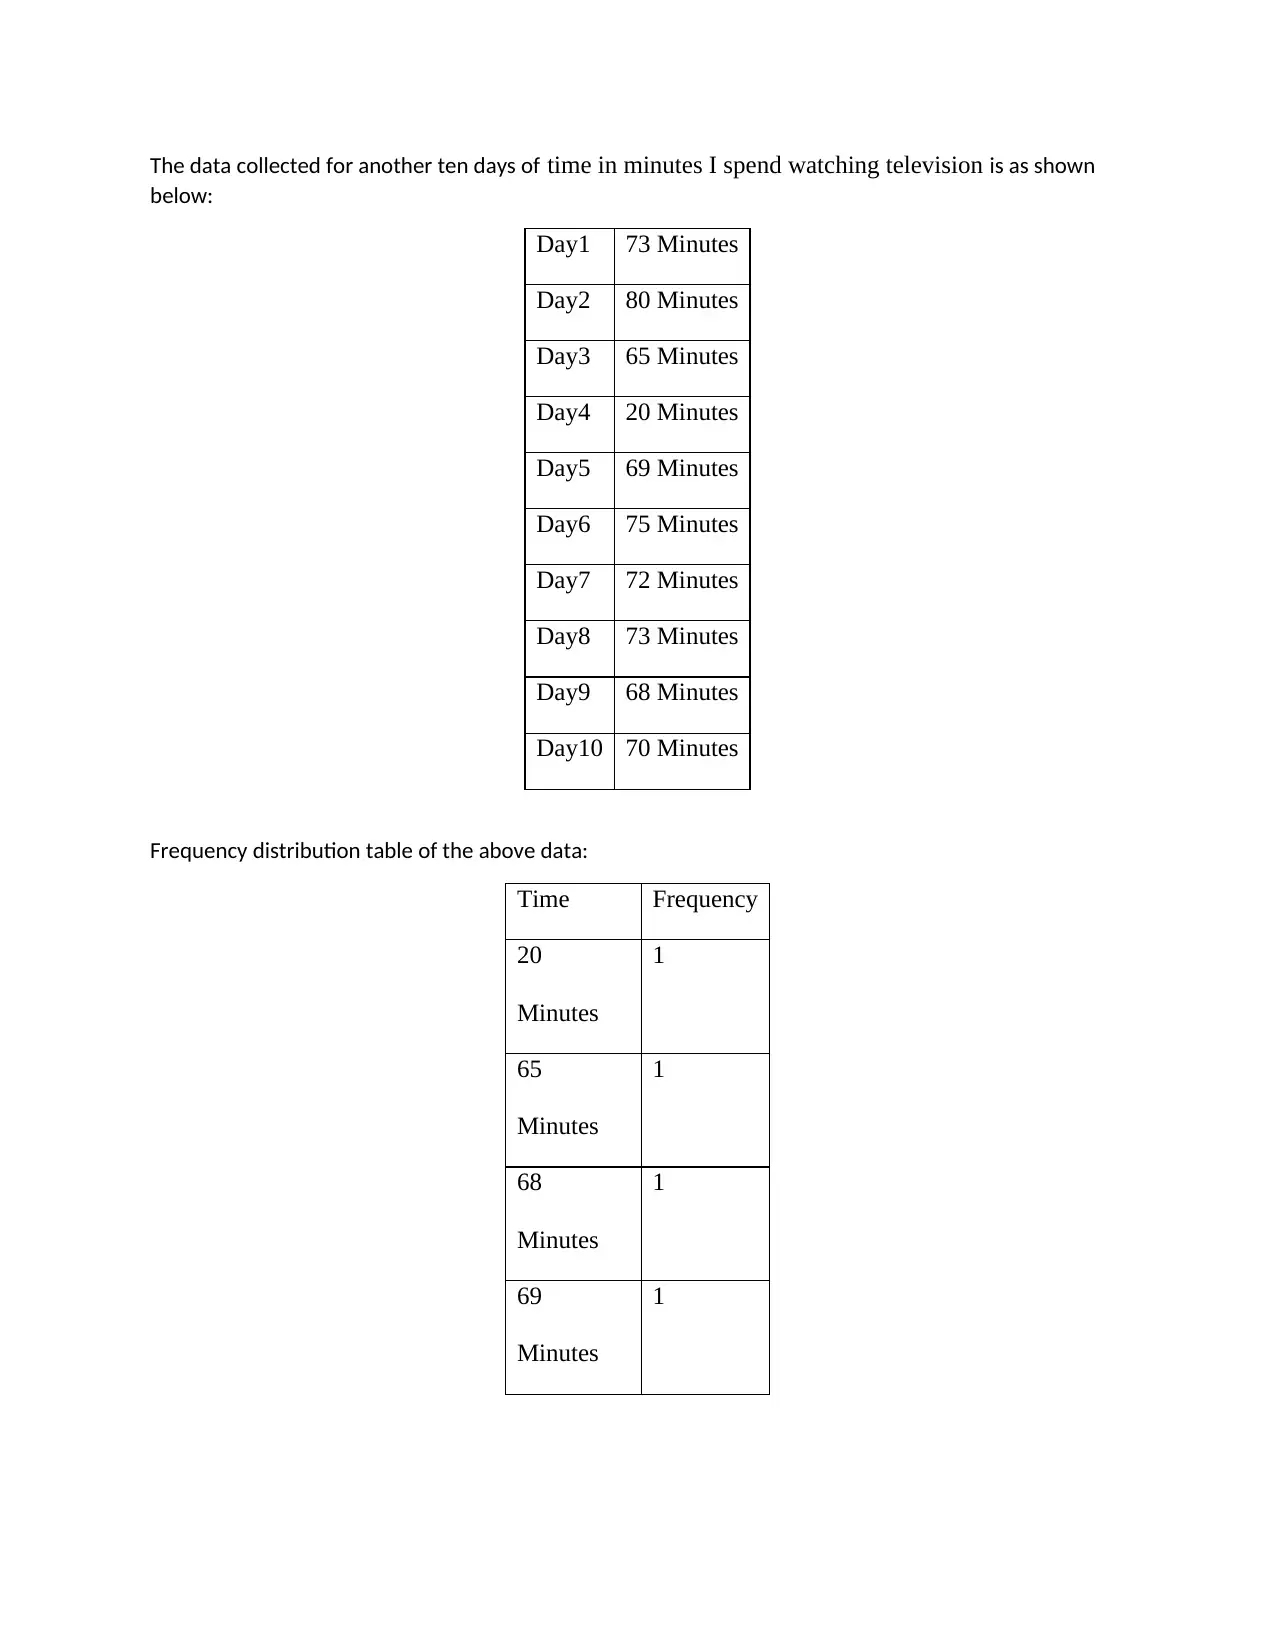
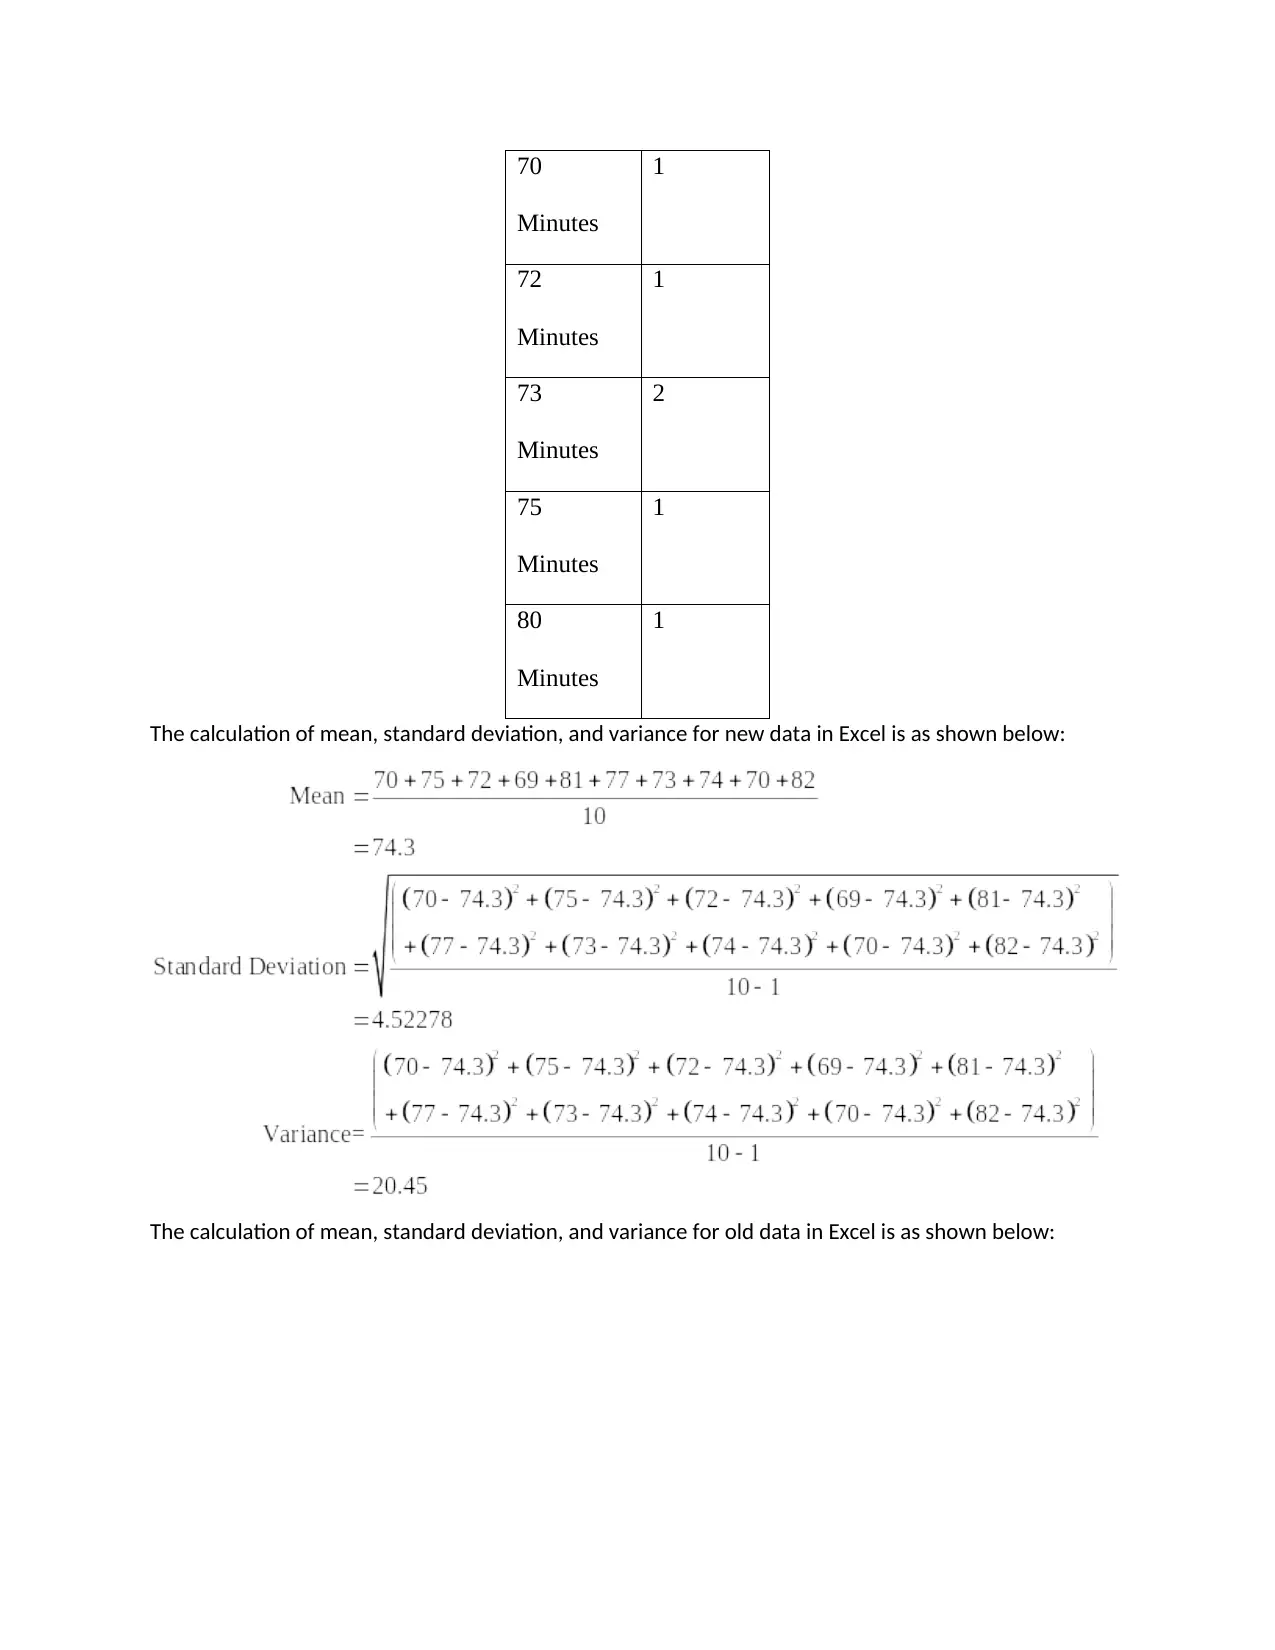
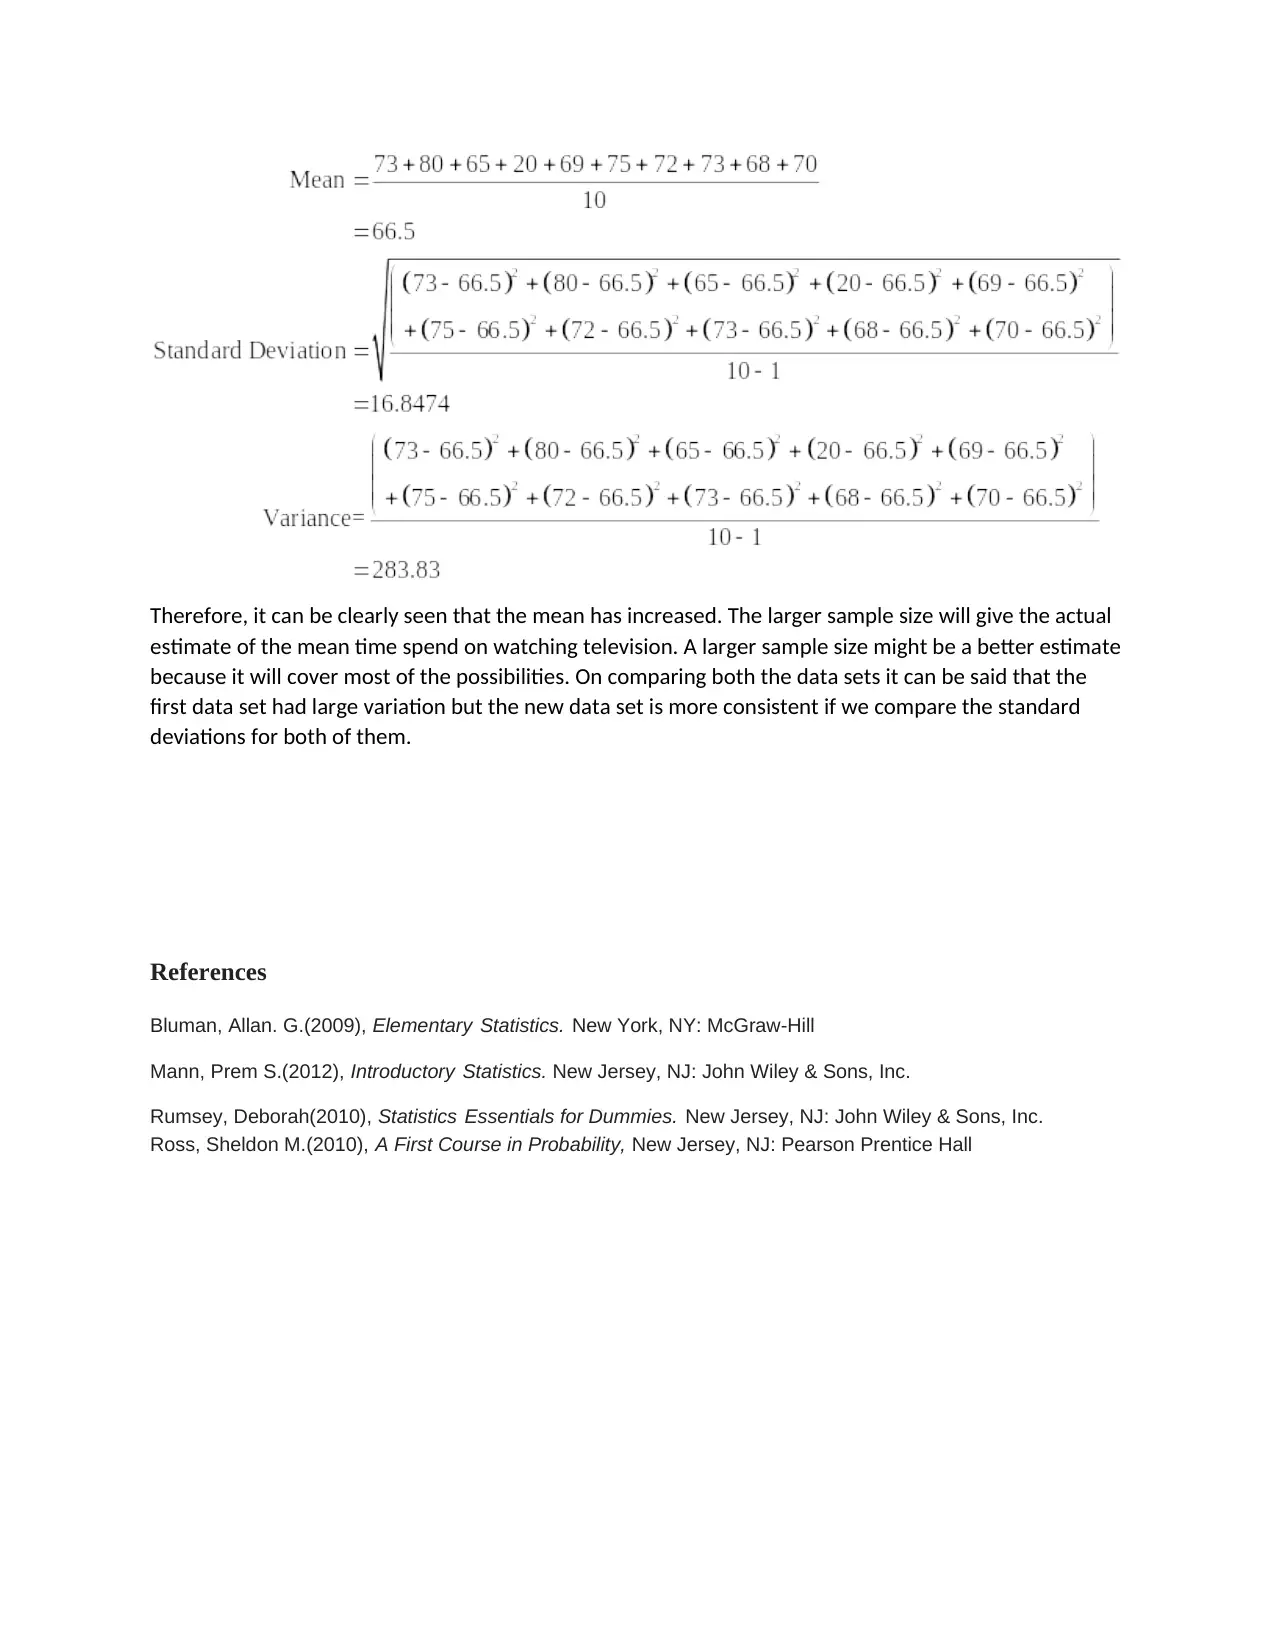
This assignment focuses on the statistical analysis of two datasets, calculating and comparing the mean, standard deviation, and variance. The assignment begins by presenting a dataset of television watching times and then calculates the mean, standard deviation, and variance for this data. The solution includes the steps for calculating these values and then compares the results with an older dataset. The assignment concludes by discussing the impact of sample size on the accuracy of the mean, highlighting the importance of a larger sample for a more reliable estimate. References to statistical texts are provided to support the analysis.
Document Page
The data collected for another ten days of time in minutes I spend watching television is as shown
below:
Day1 73 Minutes
Day2 80 Minutes
Day3 65 Minutes
Day4 20 Minutes
Day5 69 Minutes
Day6 75 Minutes
Day7 72 Minutes
Day8 73 Minutes
Day9 68 Minutes
Day10 70 Minutes
Frequency distribution table of the above data:
Time Frequency
20
Minutes
1
65
Minutes
1
68
Minutes
1
69
Minutes
1
tabler-icon-diamond-filled.svg

Secure Best Marks with AI Grader

Need help grading? Try our AI Grader for instant feedback on your assignments.
Document Page
70
Minutes
1
72
Minutes
1
73
Minutes
2
75
Minutes
1
80
Minutes
1
The calculation of mean, standard deviation, and variance for new data in Excel is as shown below:
The calculation of mean, standard deviation, and variance for old data in Excel is as shown below:
Document Page
Therefore, it can be clearly seen that the mean has increased. The larger sample size will give the actual
estimate of the mean time spend on watching television. A larger sample size might be a better estimate
because it will cover most of the possibilities. On comparing both the data sets it can be said that the
first data set had large variation but the new data set is more consistent if we compare the standard
deviations for both of them.
References
Bluman, Allan. G.(2009), Elementary Statistics. New York, NY: McGraw-Hill
Mann, Prem S.(2012), Introductory Statistics. New Jersey, NJ: John Wiley & Sons, Inc.
Rumsey, Deborah(2010), Statistics Essentials for Dummies. New Jersey, NJ: John Wiley & Sons, Inc.
Ross, Sheldon M.(2010), A First Course in Probability, New Jersey, NJ: Pearson Prentice Hall
chevron_up_icon
1 out of 3
circle_padding
hide_on_mobile
zoom_out_icon
logo.png

Your All-in-One AI-Powered Toolkit for Academic Success.

Available 24*7 on WhatsApp / Email

[object Object]