Statistical Analysis Assignment: Chapters 6 and 7 Problem Solving

Verified

Added on  2022/11/26

|5
|539
|169
Homework Assignment
AI Summary
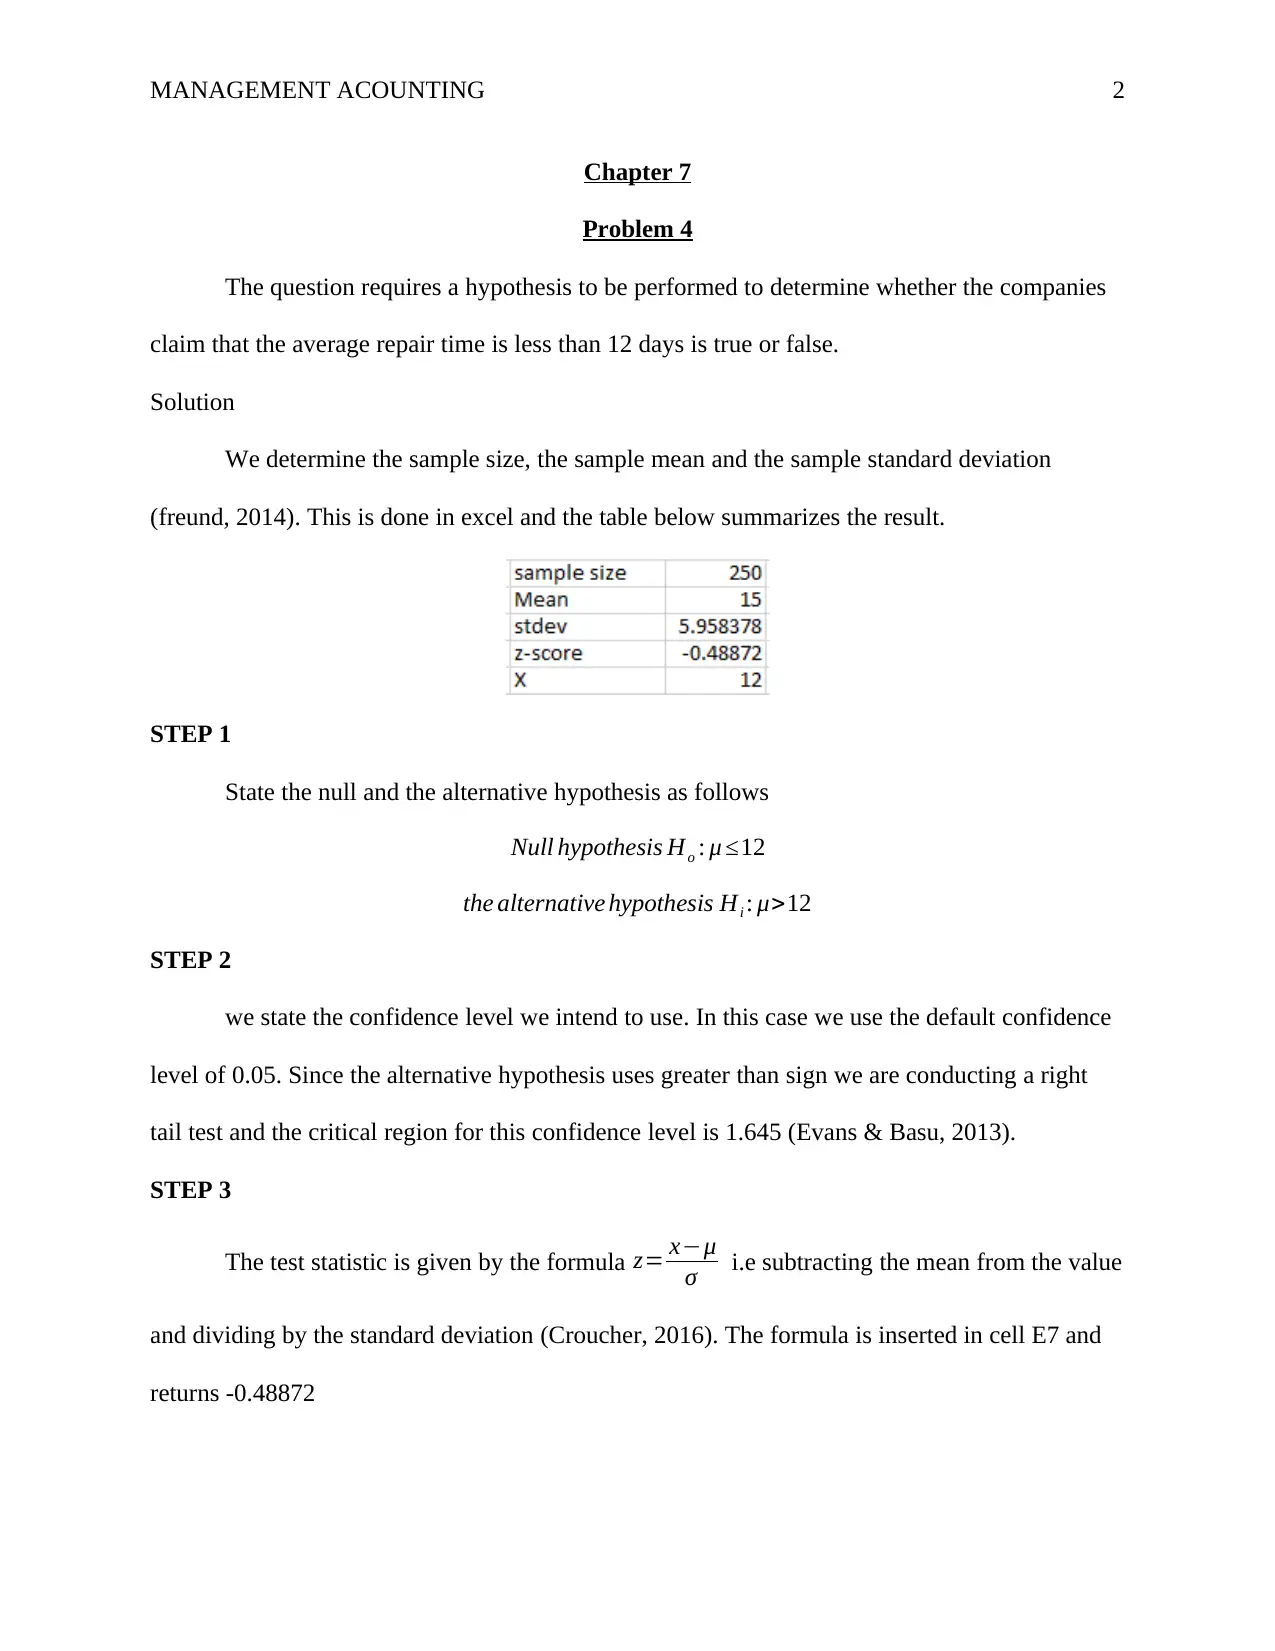
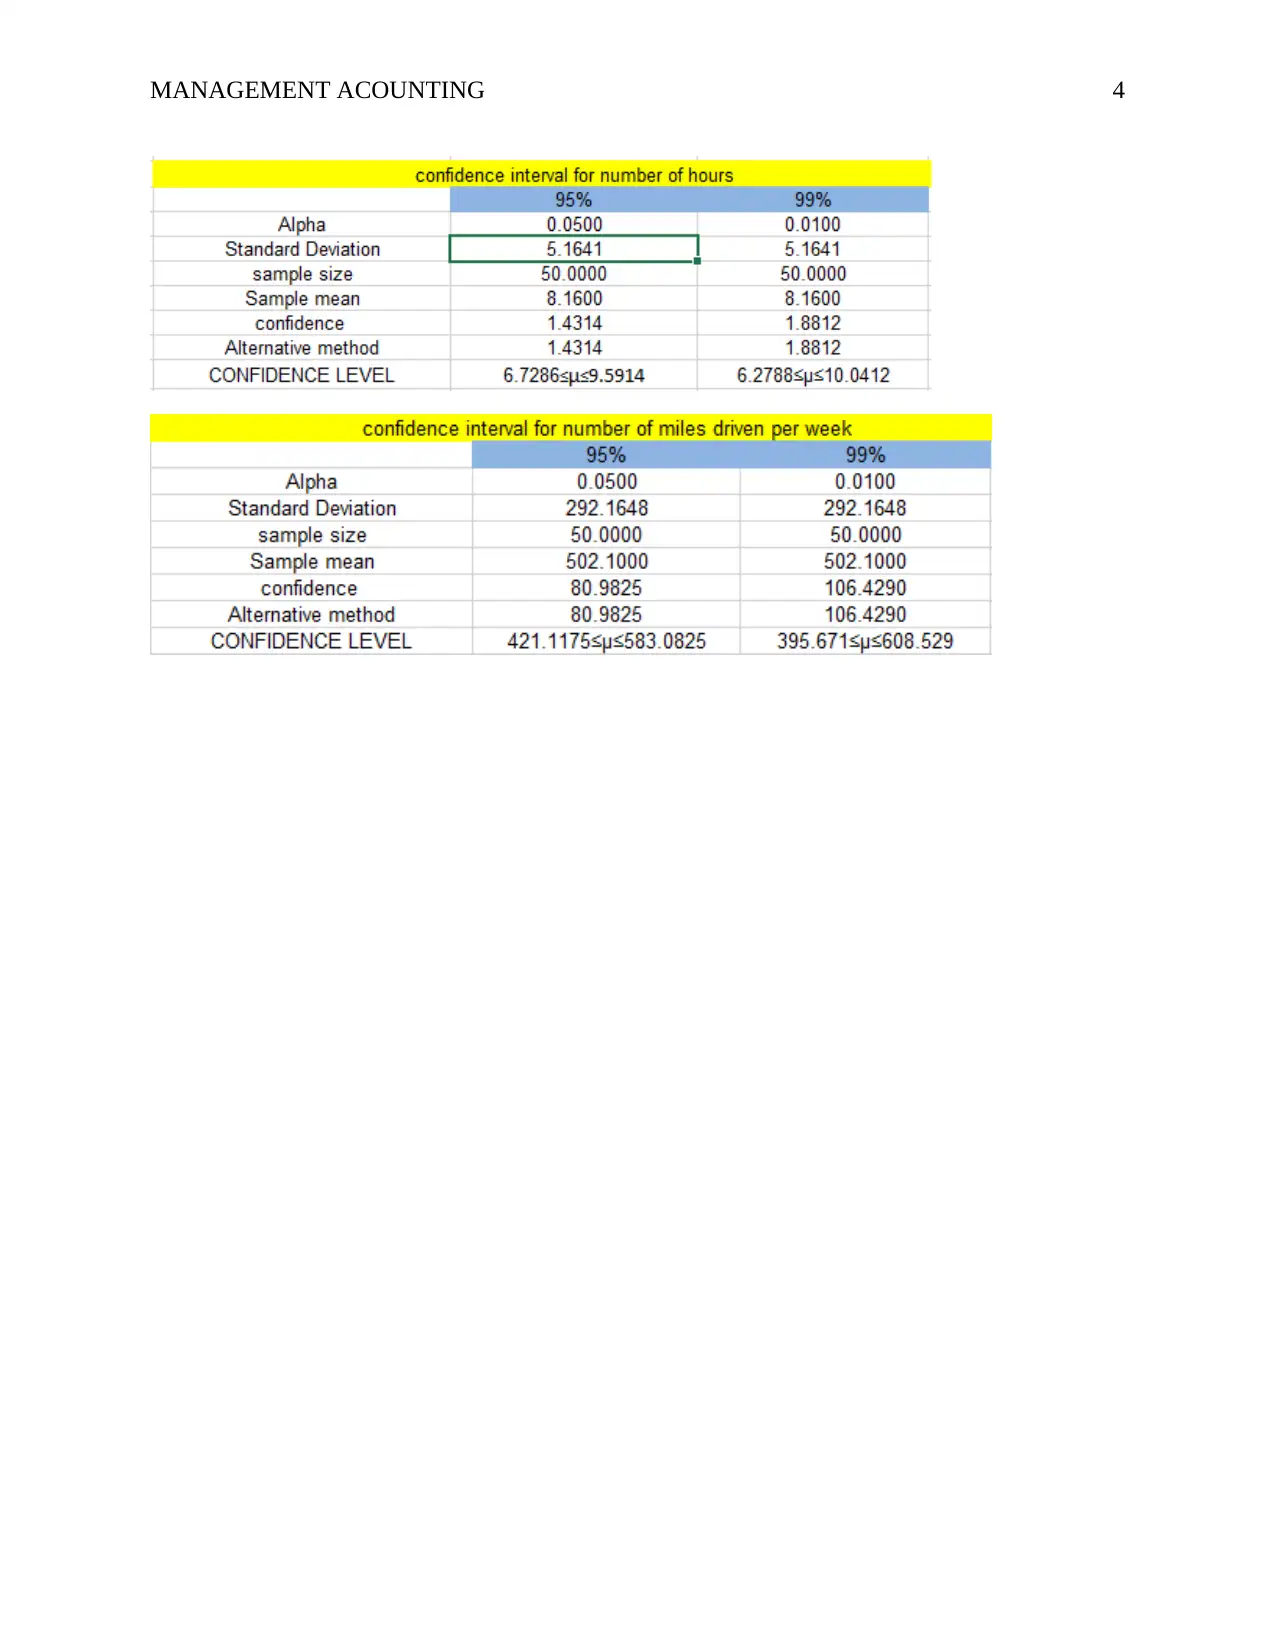
This document presents solutions to a statistics assignment focusing on hypothesis testing and confidence intervals. The assignment addresses two key problems: Chapter 7, Problem 4, involves testing a hypothesis about average repair time using sample data and determining whether the claim that the average repair time is less than 12 days is true or false, including the use of excel to determine the sample size, mean and standard deviation, and test statistics. Chapter 6, Problem 19, requires the development of 95% and 99% prediction intervals for the hours per week an individual spends in their vehicle and the number of miles driven, also including the excel implementation using the CONFIDENCE.NORM and NORMINV functions. The solutions detail the steps, formulas, and excel functions used to arrive at the statistical conclusions, providing a comprehensive analysis of the given data sets.
Document Page
Running head: MANAGEMENT ACCOUNTING 1
Management Accounting
Student Name
Professor’s Name
University Name
Date
tabler-icon-diamond-filled.svg

Paraphrase This Document

Need a fresh take? Get an instant paraphrase of this document with our AI Paraphraser
Document Page
MANAGEMENT ACOUNTING 2
Chapter 7
Problem 4
The question requires a hypothesis to be performed to determine whether the companies
claim that the average repair time is less than 12 days is true or false.
Solution
We determine the sample size, the sample mean and the sample standard deviation
(freund, 2014). This is done in excel and the table below summarizes the result.
STEP 1
State the null and the alternative hypothesis as follows
Null hypothesis Ho : μ 12
the alternative hypothesis Hi : μ>12
STEP 2
we state the confidence level we intend to use. In this case we use the default confidence
level of 0.05. Since the alternative hypothesis uses greater than sign we are conducting a right
tail test and the critical region for this confidence level is 1.645 (Evans & Basu, 2013).
STEP 3
The test statistic is given by the formula z= xμ
σ i.e subtracting the mean from the value
and dividing by the standard deviation (Croucher, 2016). The formula is inserted in cell E7 and
returns -0.48872
Document Page
MANAGEMENT ACOUNTING 3
STEP 4
We check whether the value of test statistic is greater of less than the critical value. If
greater than we reject the null hypothesis else we don't reject the null hypothesis (Hinton, 2014).
In this case -0.48842<1.645 hence we don't reject the null hypothesis and can confidently
conclude that the average service time is less than 12 days,
CHAPTER 6
PROBLEM 19
The question requires us to develop a 95% and 99% prediction interval for the hours per
week that an individual will spend in his or her vehicle and the number of miles driven per week.
Procedure
Step1: Determine the sample size, sample mean and the sample standard deviation in excel.
Step 2: Determine the alpha vale which is equivalent to (1-confidence level as a decimal) I.e.
alpha for 95% confidence level will be (1-0.95=0.05) and for 99% it will be (1-0.99=0.01).
Solution
Method 1: Use the CONFIDENCE.NORM function in excel as follows.
CONFIDENCE= CONFIDENCE.NORM(ALPHA, STDEV, SAMPLE SIZE)
Method 2: Use the NORMINV function in excel as follows:
CONFIDENCE =NORMINV(1-ALPHA/2) *STDEV/SQRT (SAMPLE SIZE)
To get the confidence level add and subtract the confidence obtained from mean respectively.
The table summarizes the results for both cases.
Document Page
MANAGEMENT ACOUNTING 4
tabler-icon-diamond-filled.svg

Paraphrase This Document

Need a fresh take? Get an instant paraphrase of this document with our AI Paraphraser
Document Page
MANAGEMENT ACOUNTING 5
References
Croucher, J. S. (2016). Introductory mathematics & statistics (6th ed.). Australia: North Ryde,
N.S.W. McGraw-Hill Education.
Evans, J. R., & Basu, A. (2013). Statistics, data analysis, and decision modeling (5th ed.).
Boston: Pearson.
Freund, J. E. (2014). Modern elementary statistics (12th ed.). Boston: Pearson.
Hinton, P. R. (2014). Statistics explained (3rd ed.). London: Routledge, Taylor & Francis Group.
chevron_up_icon
1 out of 5
circle_padding
hide_on_mobile
zoom_out_icon
[object Object]