Comprehensive Statistics Assignment Solution & Data Analysis

Verified

Added on  2023/04/23

|12
|866
|237
Homework Assignment
AI Summary
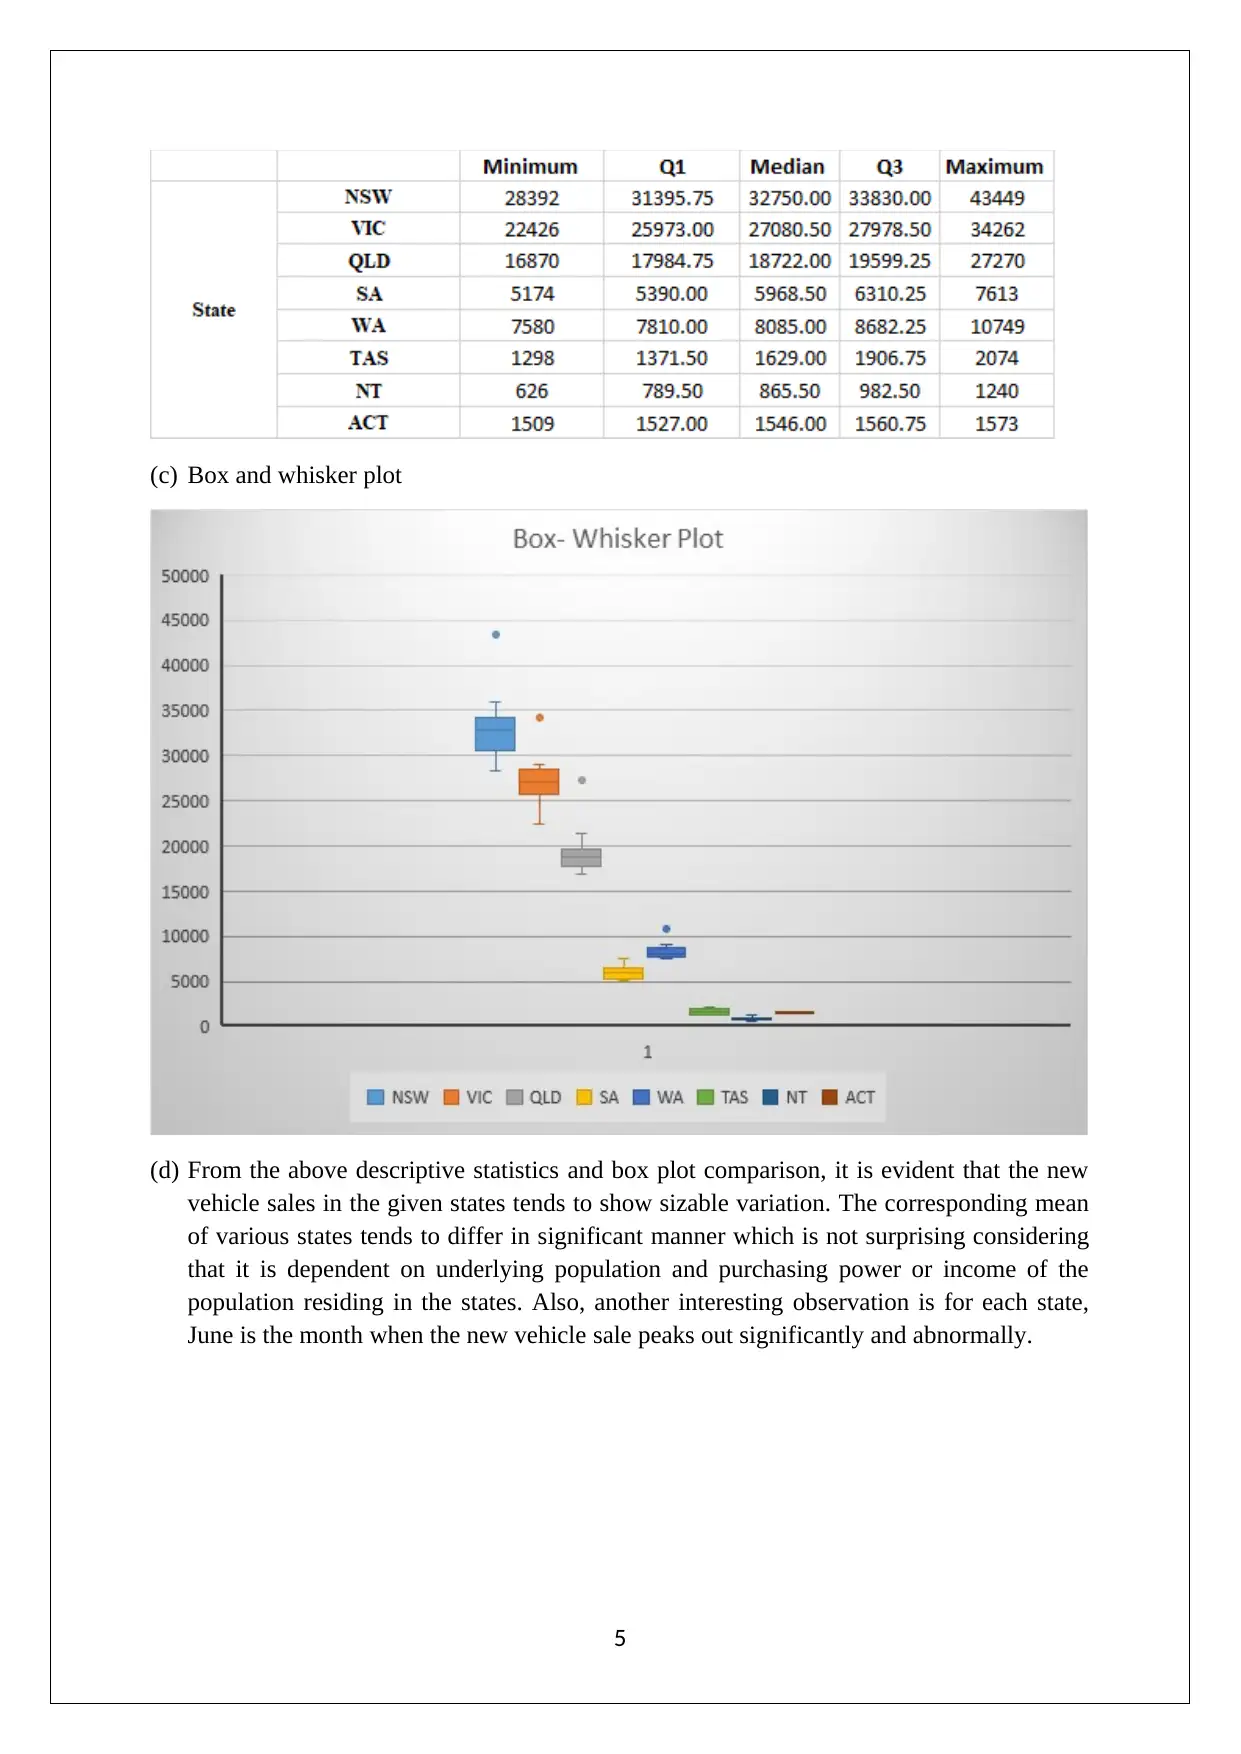
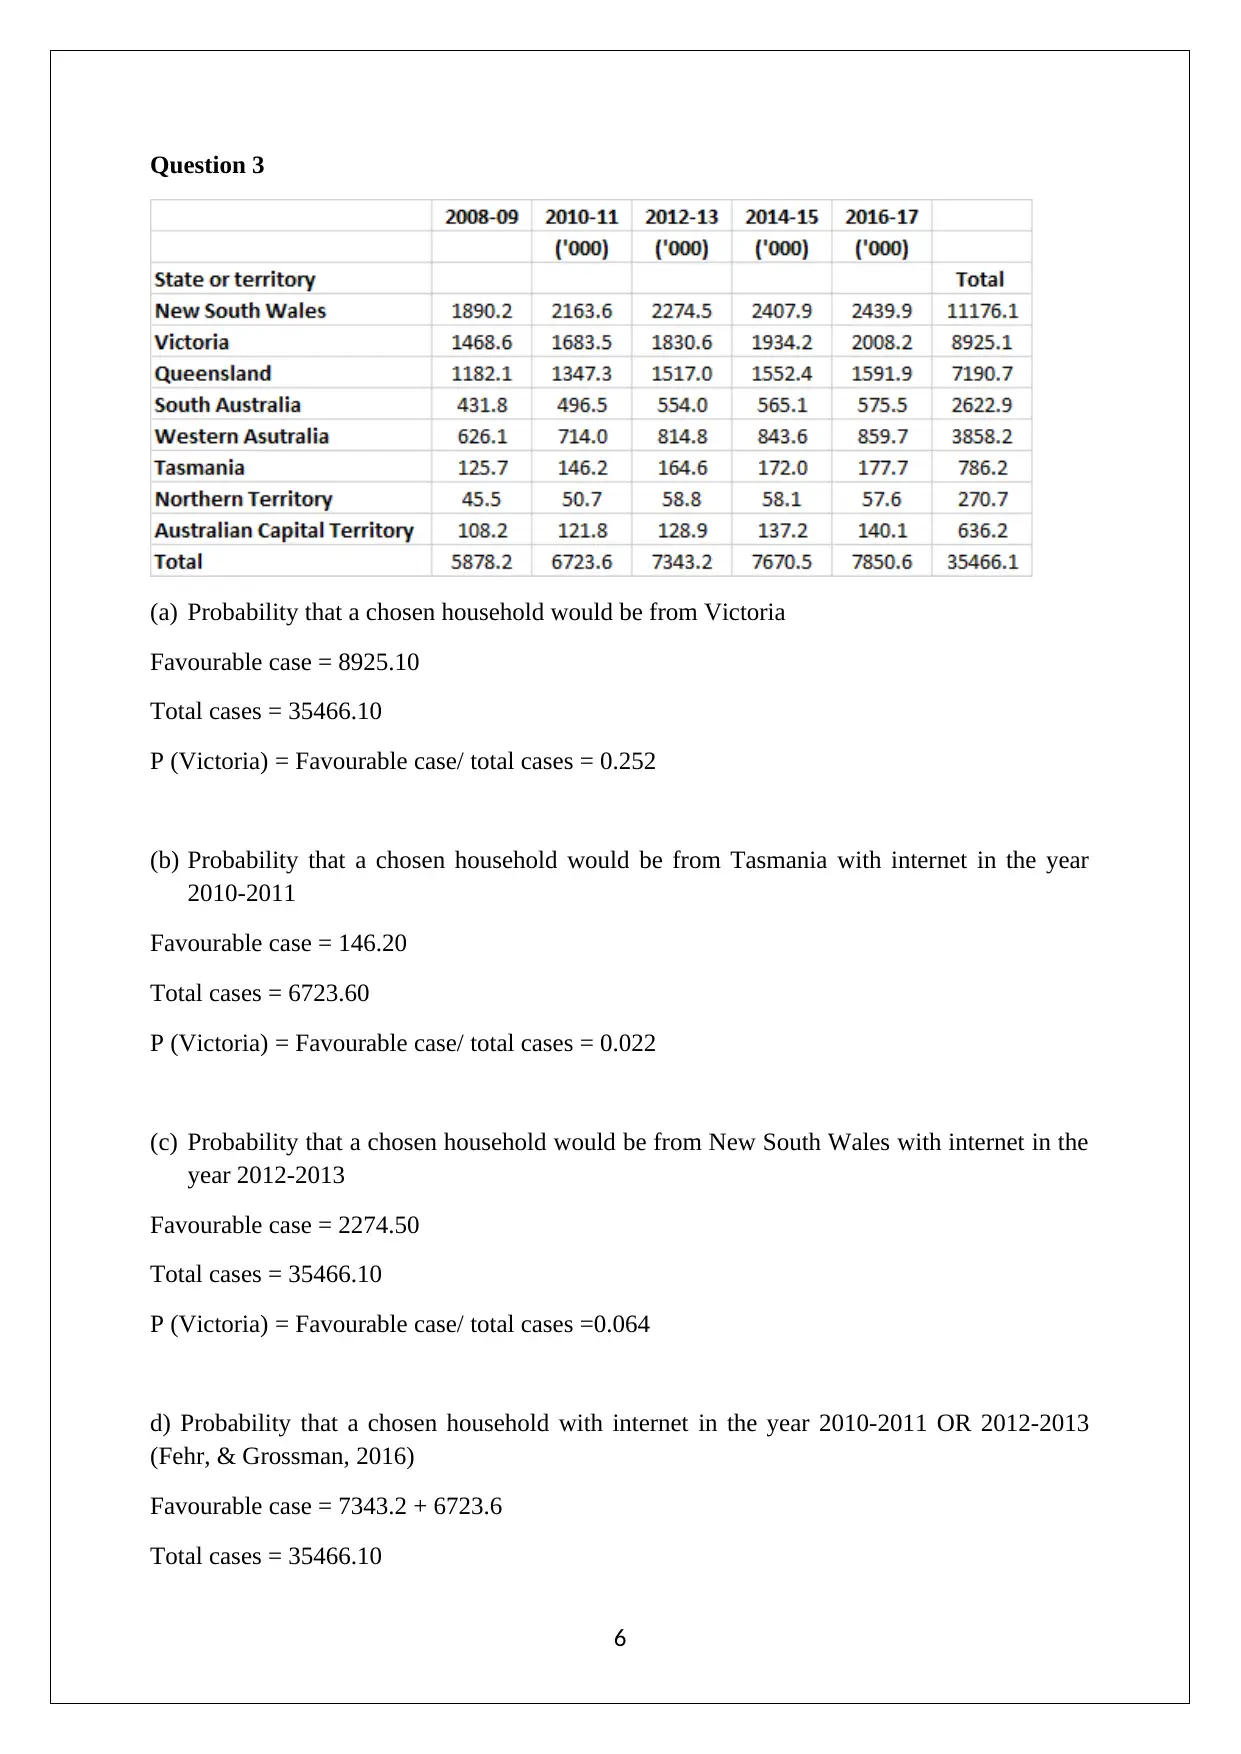
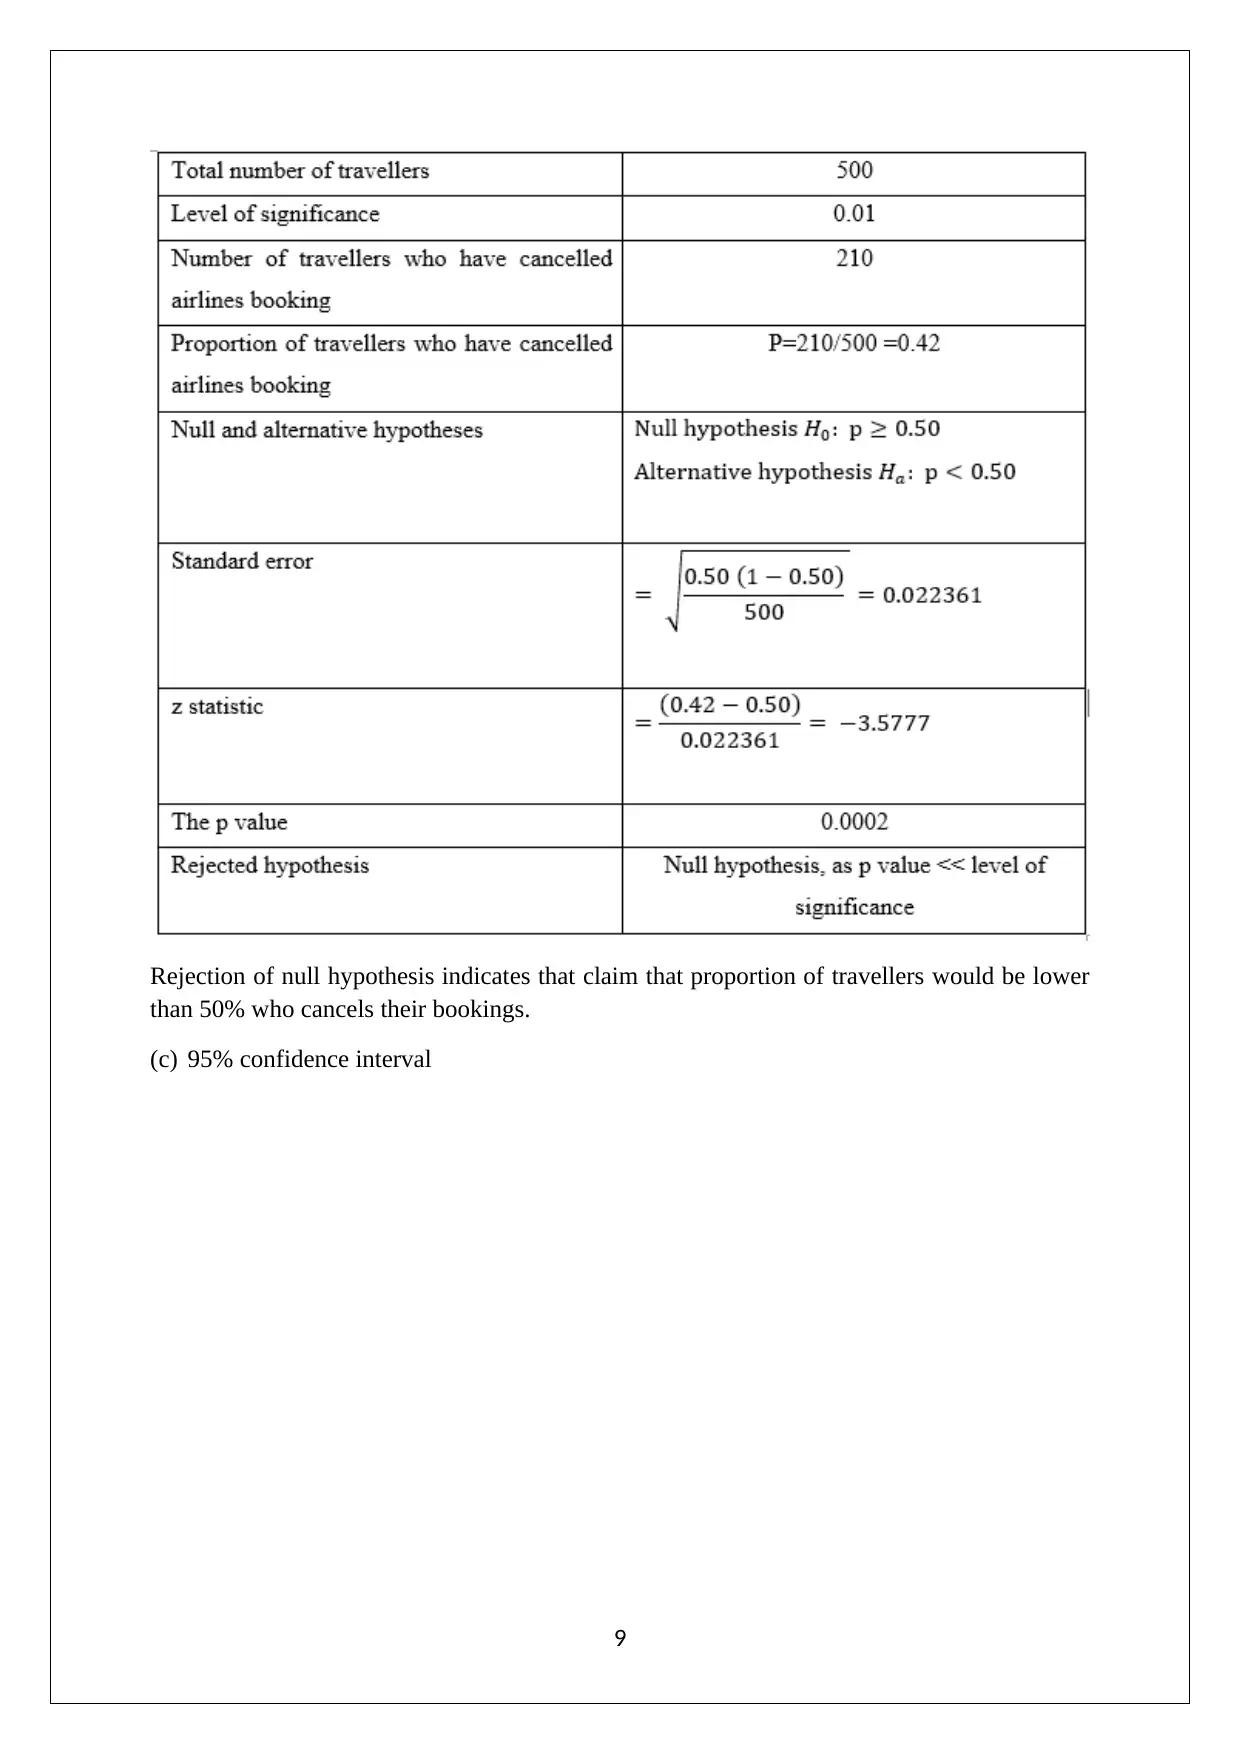
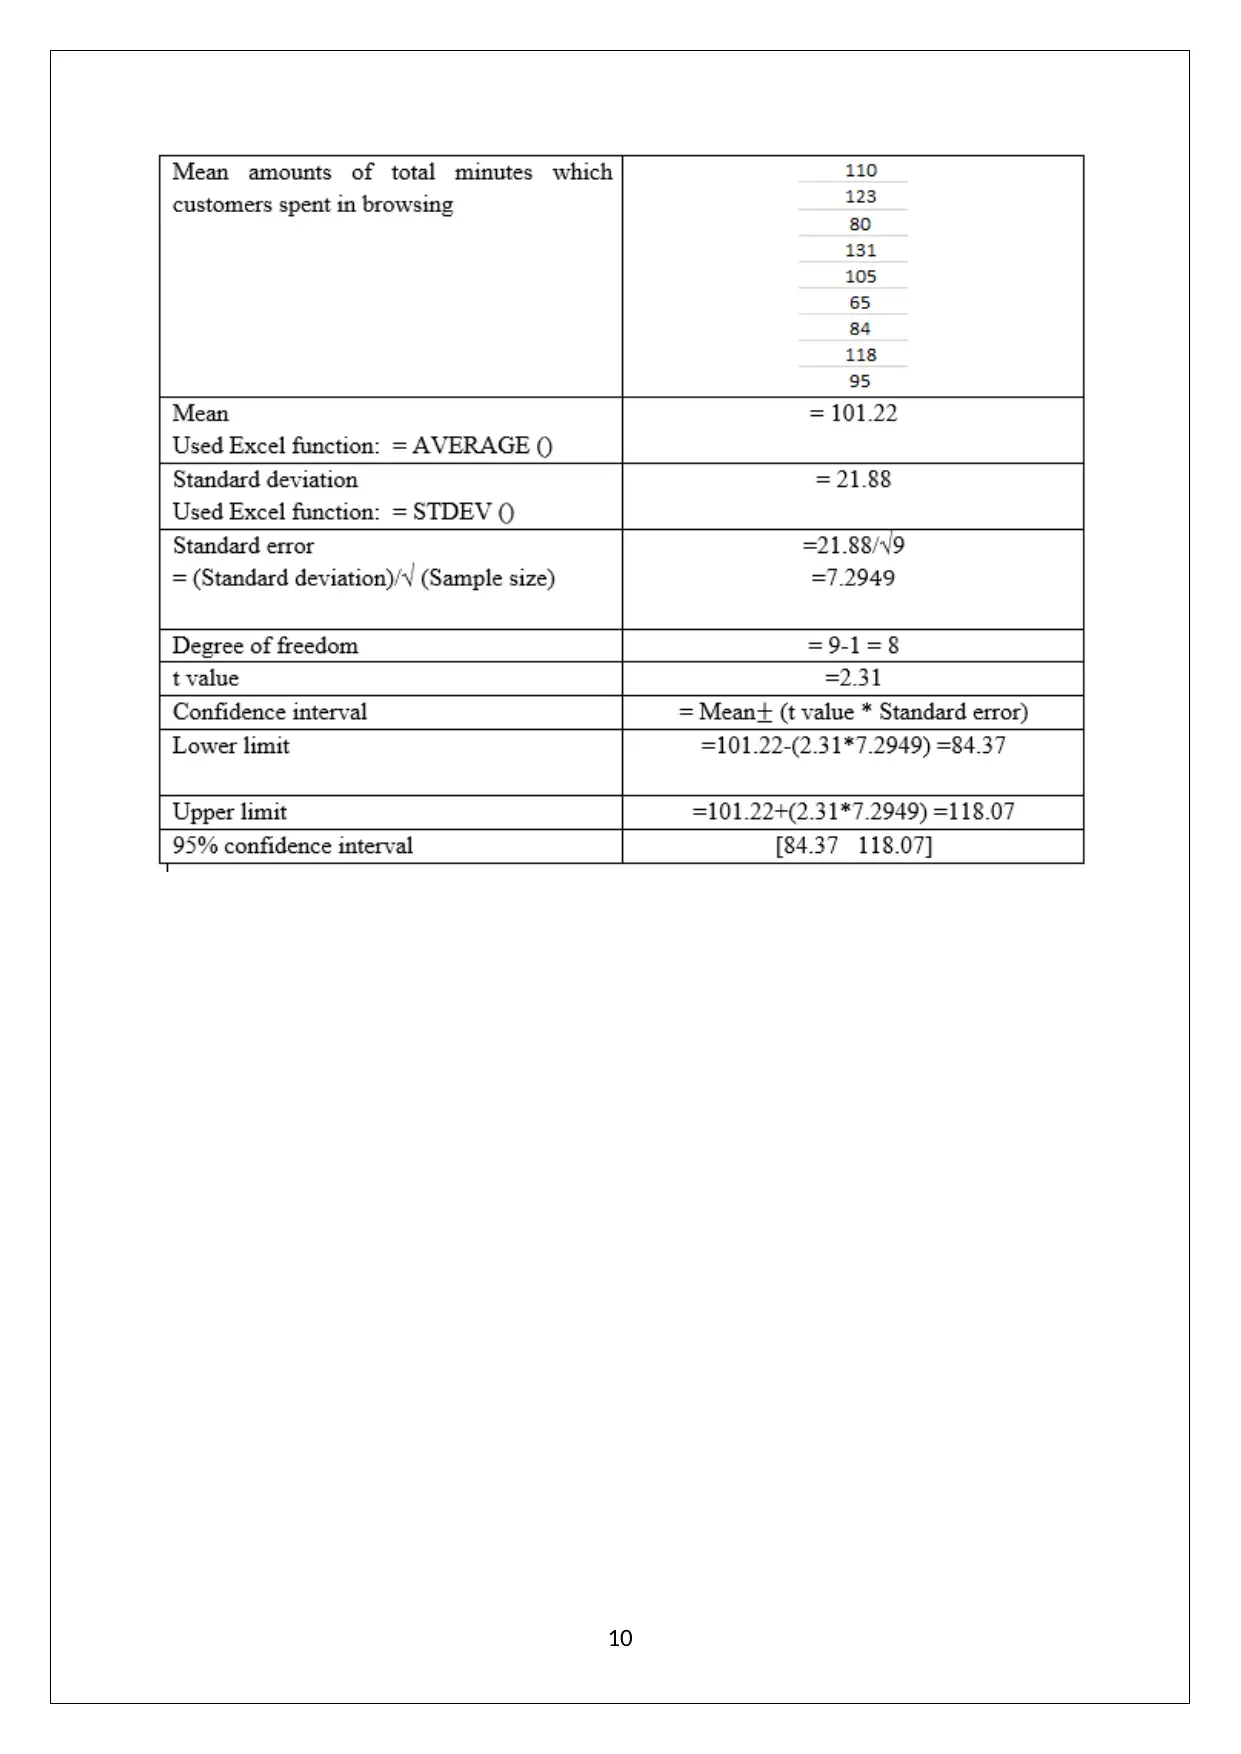
This document presents a comprehensive solution to a statistics assignment, addressing various concepts and techniques. It begins with an analysis of stock prices using stem-and-leaf plots, relative frequency histograms, and frequency polygons, followed by a comparison of analyst ratings for informed investment decisions. The solution then delves into descriptive statistics, calculating mean, standard deviation, quartiles, and creating box-and-whisker plots to compare new vehicle sales across different states. Probability calculations are performed for household demographics and internet usage. Furthermore, the assignment tackles probability distributions, including uniform and normal distributions, and concludes with hypothesis testing related to travel booking cancellations. The document uses excel functions and provides detailed explanations, making it a valuable resource for understanding statistical analysis. Desklib offers more solved assignments and study tools for students.
Document Page
Statistics
[DATE]
tabler-icon-diamond-filled.svg

Paraphrase This Document

Need a fresh take? Get an instant paraphrase of this document with our AI Paraphraser
Document Page
Question 1
(a) Opening price (Quarterly)
Stem and leaf plot
NAB on right leaf and WBC on left leaf
(b) Graph
NAB: Relative frequency histogram
WBC: Frequency polygon
1
Document Page
(c) Total assets for the ASX companies for the year end 2017 in the form of bar chart is given
below.
(d) In order to decide on whether to make purchase from the two shares on offer, it is
imperative to draw a comparison of the most recent analyst ratings on the two stocks
which has been obtained from Reuters.
WBC Aggregate Rating
2
Document Page
Source: https://www.reuters.com/finance/stocks/analyst/WBC.AX
NAB Aggregate Rating
Source: https://www.reuters.com/finance/stocks/analyst/NAB.AX
Conclusion
The two aggregate ratings when compared clearly reflect a lower score for NAB with a mean rating of
2.21. A lower rating is symbolic of bullish prediction as higher values are associated with the stock
underperforming. As a result, it makes sense to buy NAB over WBC
3
tabler-icon-diamond-filled.svg

Paraphrase This Document

Need a fresh take? Get an instant paraphrase of this document with our AI Paraphraser
Document Page
Question 2
(a) Computation of mean
Used Excel function: = AVERAGE ()
Computation of standard deviation
Used Excel function: = STDEV ()
(b) Computation of minimum, maximum, first and third quartile and median (Harmon, 2015)
Used Excel function:
Minimum = MIN (),
Maximum = MAX (),
Median = MEDIAN (),
First quartile (Q1) =QUARTILE (,1)
Third quartile (Q3) =QUARTILE (,3)
4
Document Page
(c) Box and whisker plot
(d) From the above descriptive statistics and box plot comparison, it is evident that the new
vehicle sales in the given states tends to show sizable variation. The corresponding mean
of various states tends to differ in significant manner which is not surprising considering
that it is dependent on underlying population and purchasing power or income of the
population residing in the states. Also, another interesting observation is for each state,
June is the month when the new vehicle sale peaks out significantly and abnormally.
5
Document Page
Question 3
(a) Probability that a chosen household would be from Victoria
Favourable case = 8925.10
Total cases = 35466.10
P (Victoria) = Favourable case/ total cases = 0.252
(b) Probability that a chosen household would be from Tasmania with internet in the year
2010-2011
Favourable case = 146.20
Total cases = 6723.60
P (Victoria) = Favourable case/ total cases = 0.022
(c) Probability that a chosen household would be from New South Wales with internet in the
year 2012-2013
Favourable case = 2274.50
Total cases = 35466.10
P (Victoria) = Favourable case/ total cases =0.064
d) Probability that a chosen household with internet in the year 2010-2011 OR 2012-2013
(Fehr, & Grossman, 2016)
Favourable case = 7343.2 + 6723.6
Total cases = 35466.10
6
tabler-icon-diamond-filled.svg

Paraphrase This Document

Need a fresh take? Get an instant paraphrase of this document with our AI Paraphraser
Document Page
P (Victoria) = Favourable case/ total cases =0.397
Question 4
(a) Assuming x minutes is the time that upper the 5% of time exceeded. In this case, the
cumulative probability with resect to x would be 0.95.
(b) Let T1 = 12oC and T2=25 o C, uniform distribution has been found between T1 and T2.
Therefore, it can be said that all 100% of the values of the temperature will fall within
13oC of the temperature 12oC values. Hence, the 21oC would be 9oC higher than lower
temperature value which is T1 (Koch, 2013).
Hence, probability will be 0.5385.
(c) (i) Probability that higher than 65% of responded that identified correctly =?
Hence, the probability would be 0.00001.
(ii) Probability sample would be 50% or 60% of responded will identified correctly (Medhi,
2015).
7
Document Page
Hence, the probability will be 0.497.
Question 5
(a) P (succeeding in trials between 280 times and 355 times) =?
Hence, the probability will be 0.6879.
(b) Hypothesis testing
8
Document Page
Rejection of null hypothesis indicates that claim that proportion of travellers would be lower
than 50% who cancels their bookings.
(c) 95% confidence interval
9
tabler-icon-diamond-filled.svg

Paraphrase This Document

Need a fresh take? Get an instant paraphrase of this document with our AI Paraphraser
Document Page
10
Document Page
References
Fehr, F. H., & Grossman, G. (2016). An introduction to sets, probability and hypothesis
testing (3rd ed.). Ohio: Heath.
Harmon, M. (2015). Hypothesis Testing in Excel - The Excel Statistical Master (7th ed.).
Florida: Mark Harmon.
Koch, K.R. (2013). Parameter Estimation and Hypothesis Testing in Linear Models (2nd ed.).
London: Springer Science & Business Media.
Medhi, J. (2015). Statistical Methods: An Introductory Text (4th ed.). Sydney: New Age
International.
11
chevron_up_icon
1 out of 12
circle_padding
hide_on_mobile
zoom_out_icon
[object Object]