Statistical Analysis of Australian Fuel Prices - BUS708

Verified

Added on  2023/04/04

|10
|1319
|112
Report
AI Summary
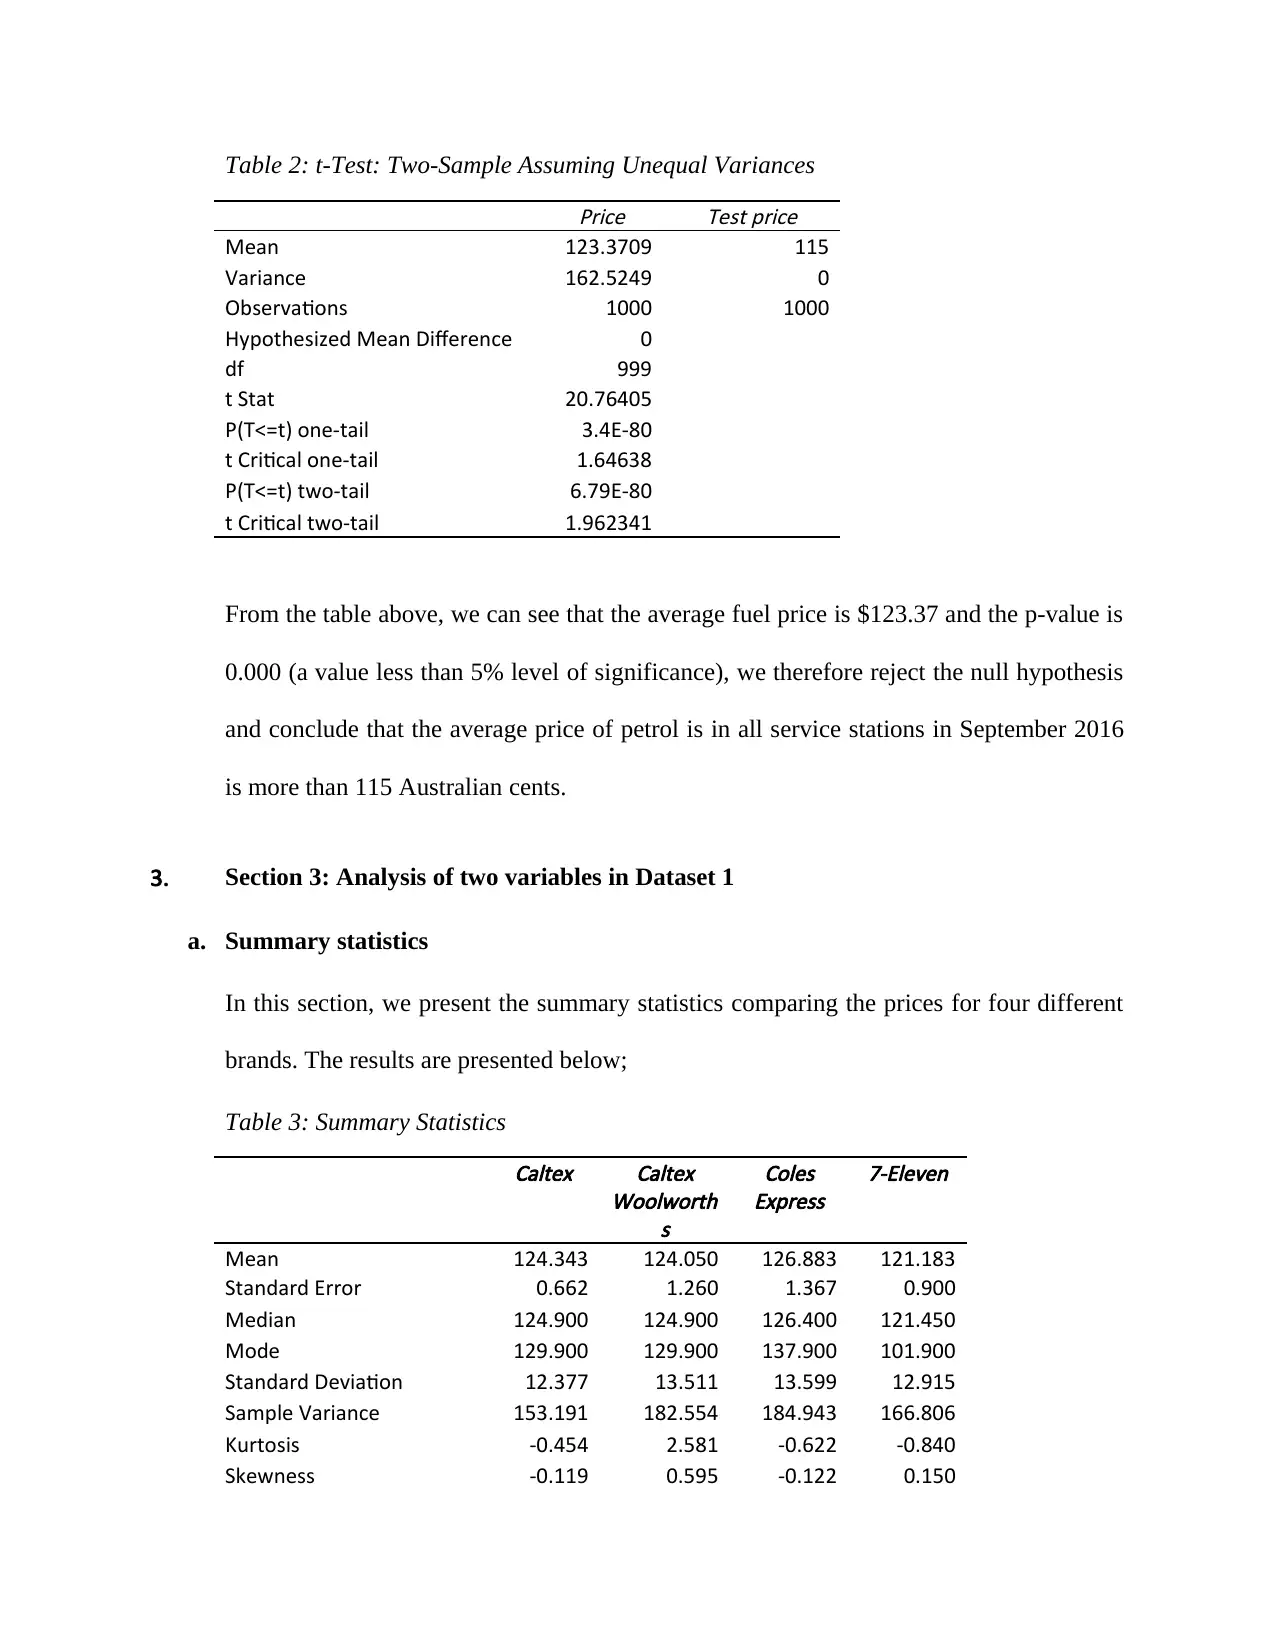
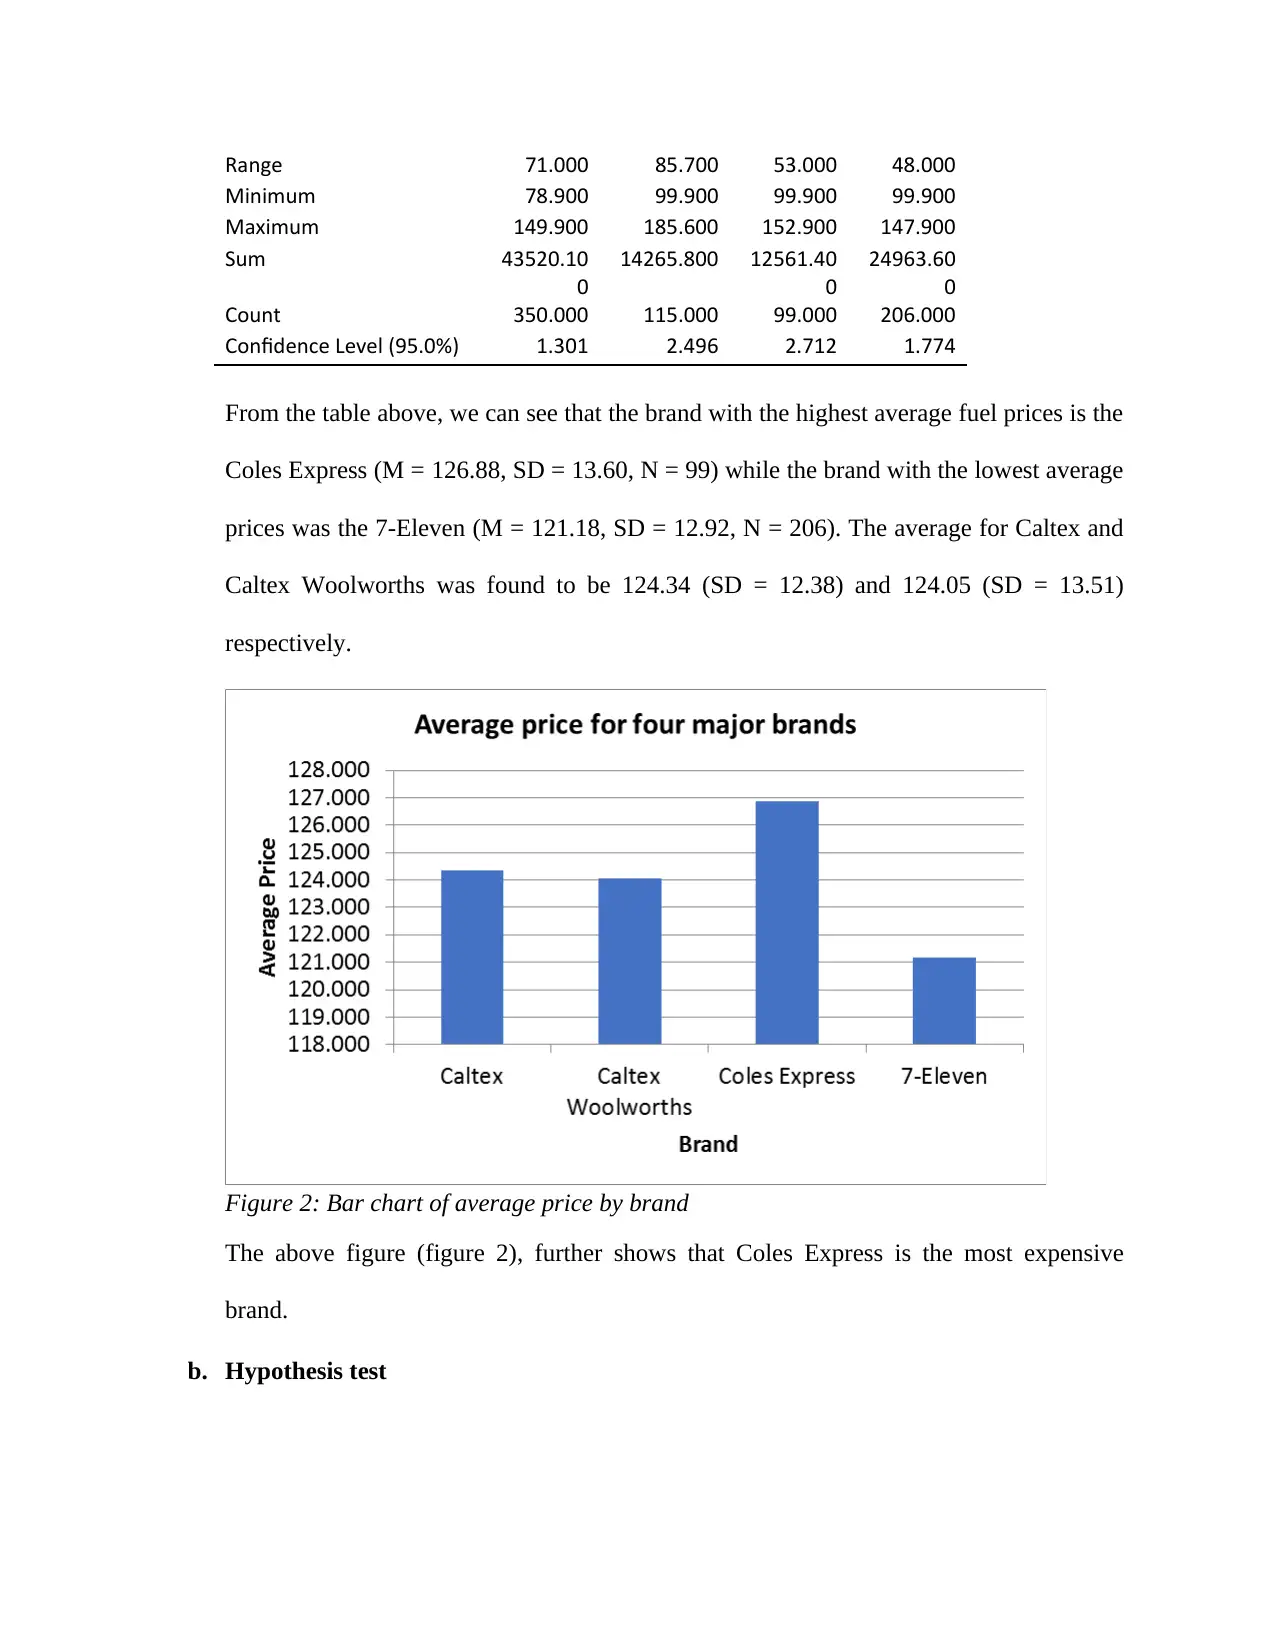
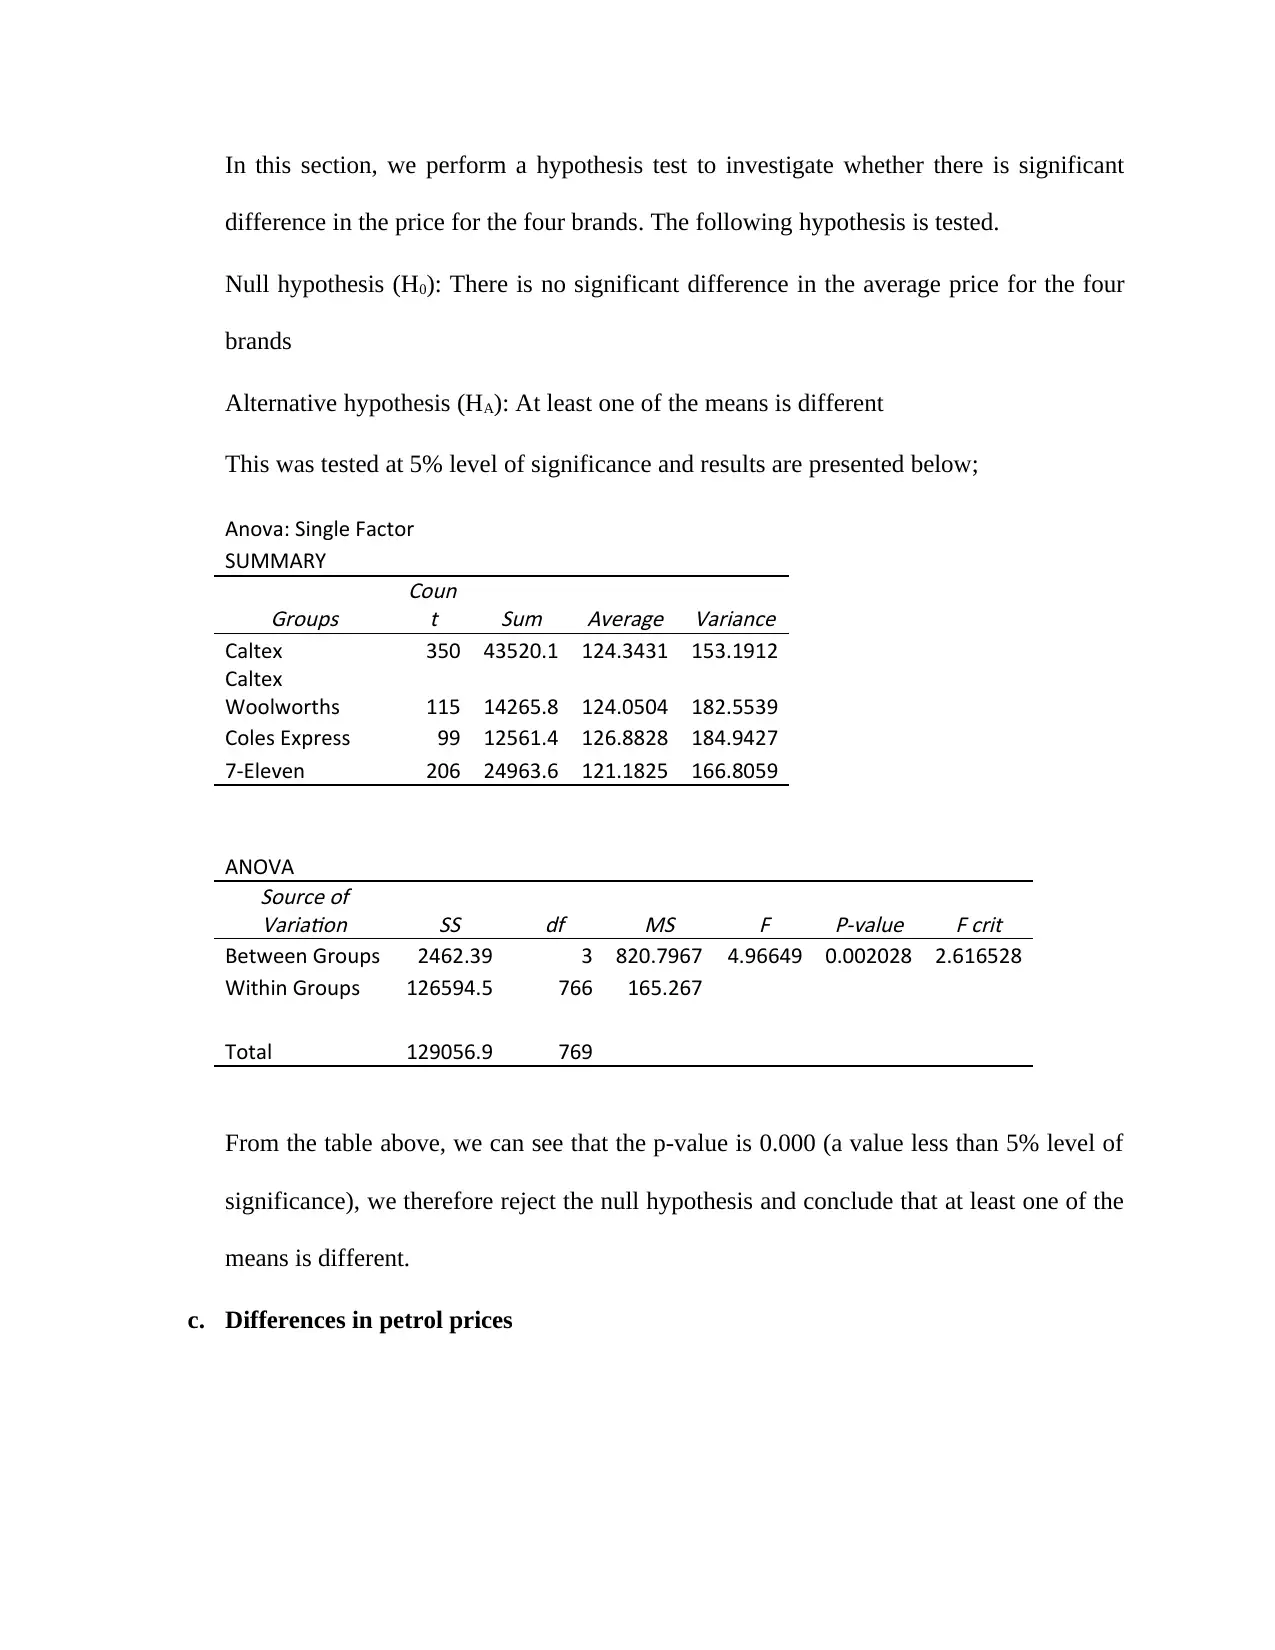
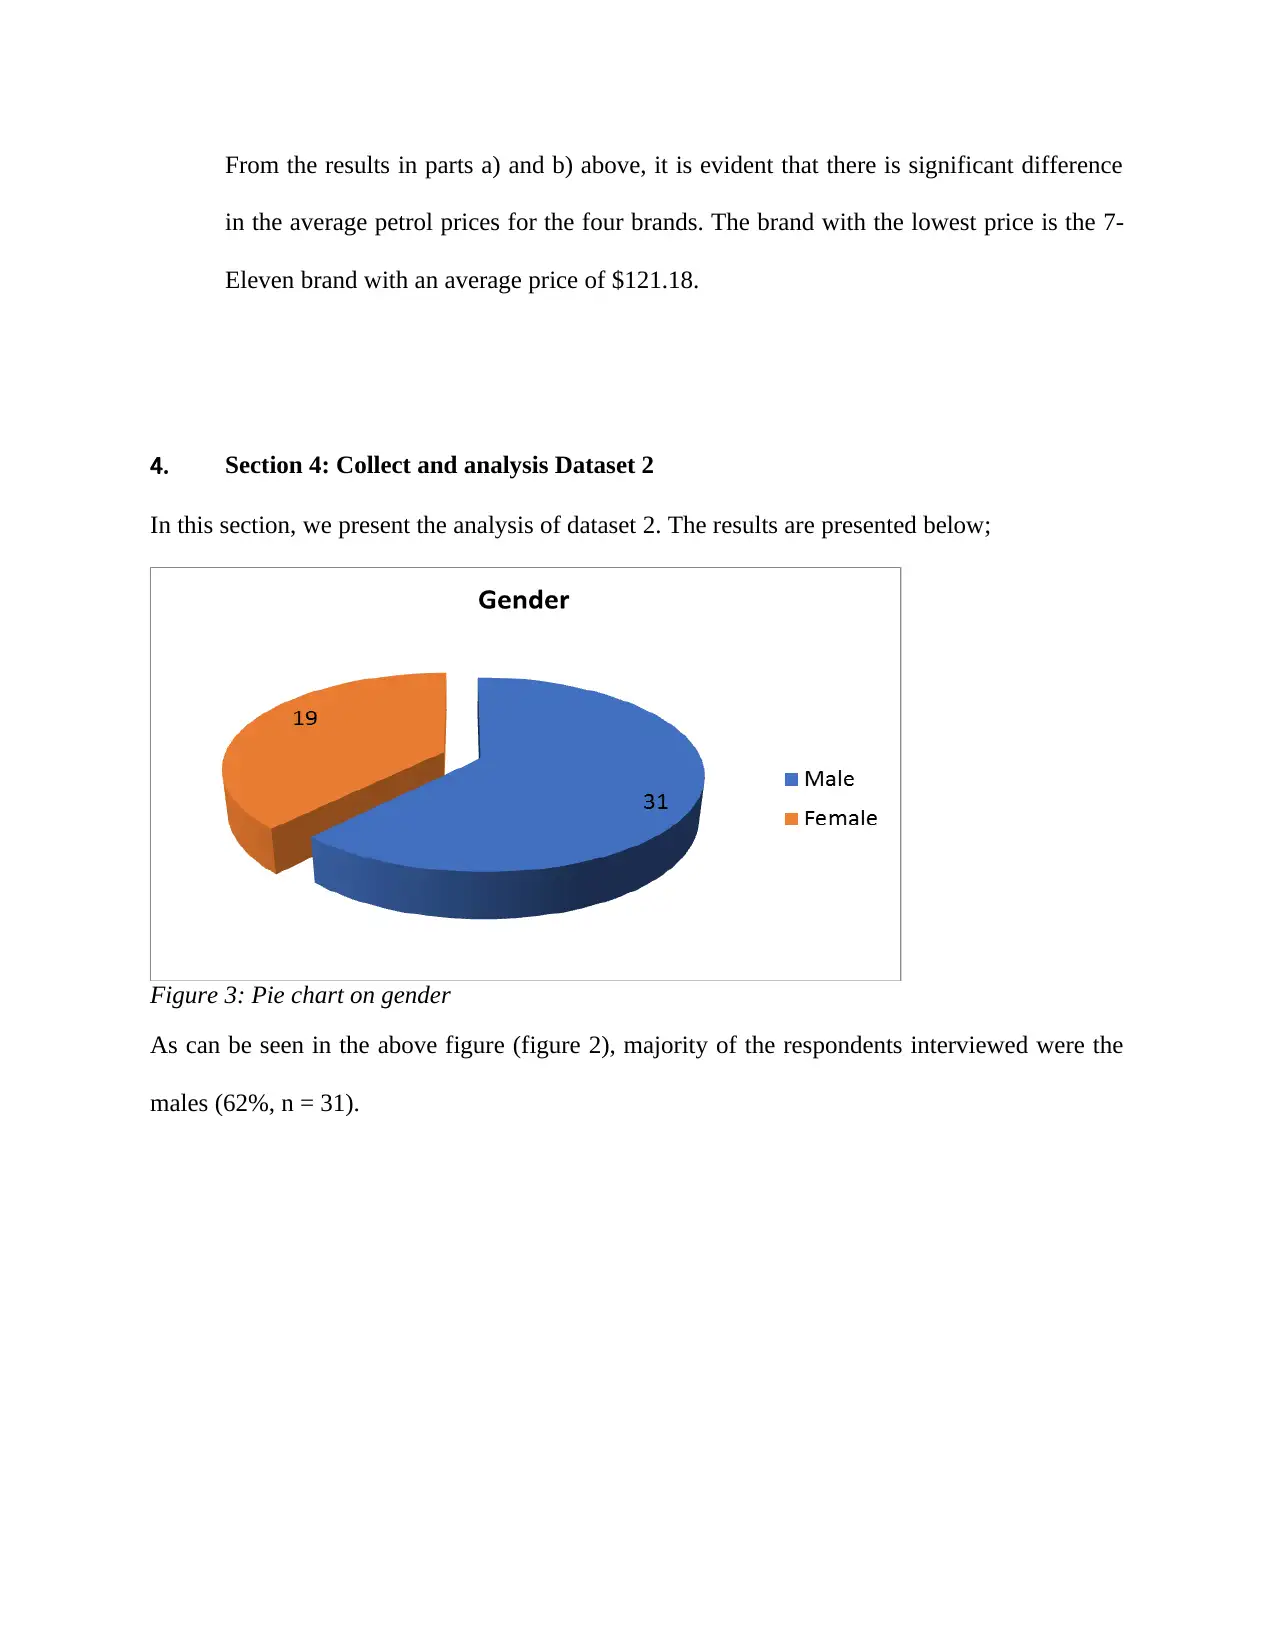
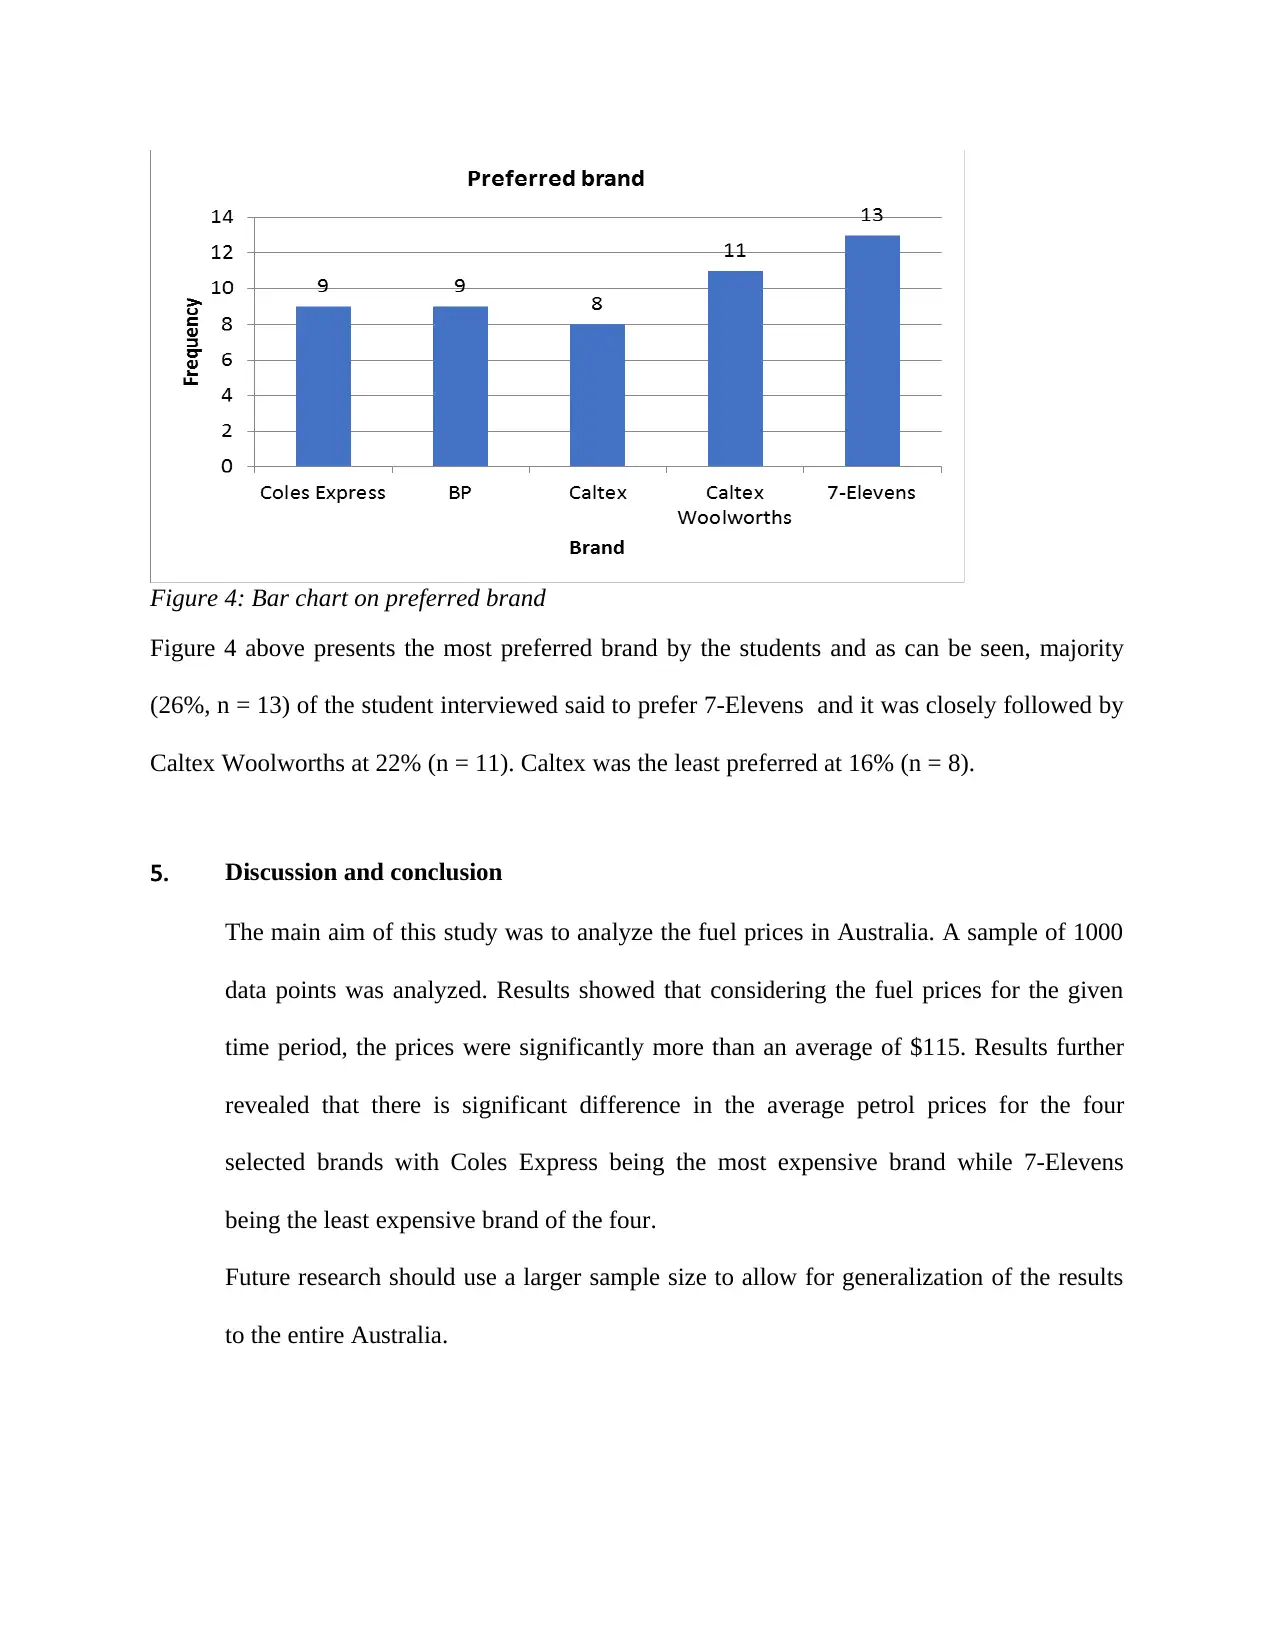
This report presents a statistical analysis of fuel prices in Australia, addressing a business problem for an agency providing information to NRMA. The analysis utilizes two datasets: a secondary dataset with 1000 cases and six variables, and a primary dataset with 50 cases and two variables. The report includes descriptive statistics of fuel prices, hypothesis testing (one-sample t-test to compare the average price with a benchmark and ANOVA to compare prices across brands), and graphical representations (histograms and bar charts). Findings reveal that the average fuel price in September 2016 was significantly more than 115 Australian cents, with significant price differences among different brands, where Coles Express was the most expensive and 7-Elevens the least expensive. The report concludes with recommendations for future research, suggesting a larger sample size for broader generalization.
Document Page
Statistics
Student Name:
Student ID:
24th May 2019
tabler-icon-diamond-filled.svg

Secure Best Marks with AI Grader

Need help grading? Try our AI Grader for instant feedback on your assignments.
Document Page
1. Section 1: Introduction
a. Brief introduction
Fluctuations in the global oil prices greatly affect the prices of fuel in Australia. The
Australian energy policy is subject to the fiscal and regulatory influence of all the three
government levels, however, only the Federal and State levels are allowed to determine
the primary policy industries such as coal (Byrnes, Brown, Wagner, & Foster, 2016).
There have been reports that there are some petrol stations that sell petrol at higher prices
than the others. This study therefore sought to analyze the fuel prices for different petrol
stations in Australia.
a. Dataset 1:
This data is a secondary data where the data is obtained from a data that had been
collected earlier on. There are six variables in this dataset where the variables are of
different data types. Four of the variables are nominal variables while one variable is a
continuous variable (price) while the other variable is a discrete variable. There are 1000
cases in this dataset.
b. Dataset 2:
This dataset is a primary dataset since the data is collected one on one from the
respondents. This dataset has two variables (gender and preferred petrol station). The two
variables are nominal variables. There are 50 cases in this dataset.
Document Page
2. Section 2: Analysis of single variable in Dataset 1.
a. Summary statistics of price
In this section, we present the summary statistics for the price. The results are presented
in the table below;
Table 1: Summary (descriptive) statistics
Price
Mean 123.371
Standard Error 0.403
Median 123.900
Mode 129.900
Standard Deviation 12.749
Sample Variance 162.525
Kurtosis -0.184
Skewness 0.101
Range 106.700
Minimum 78.900
Maximum 185.600
Sum 123370.900
Count 1000.000
Confidence Level (95.0%) 0.791
The table above (table 1) presents the summary statistics for petrol price where it can be
seen that the average fuel price is $123.37 with the most frequent price being $129.90
and the median price being $123.90. These measures are referred to measures of central
tendency (location) and as can be seen the median price is very close to the mean price
which shows that the data is close to a normal distribution. The standard deviation is
given as 12.749 which show not a wide variation of the data points from the mean. The
Skewness value is 0.101 (a value closer to zero), which further confirms that the
distribution of the petrol price is close to normal distribution.
Document Page
Figure 1: Histogram for price
Figure 1 above presents the histogram for the variable price and as can be seen, the above
histogram further confirms that the distribution of the variable price is close to a normal
distribution.
b. One-sample t-test
In this section we sought to test whether the average price of petrol is in all service
stations in September 2016 is more than 115 Australian cents. The hypothesis we sought
to test for this section is given below;
Null hypothesis (H0): The average price of petrol is in all service stations in September
2016 is equal to 115 Australian cents.
Alternative hypothesis (HA): The average price of petrol is in all service stations in
September 2016 is more than 115 Australian cents.
This was tested at 5% level of significance and the results are presented below;
tabler-icon-diamond-filled.svg

Secure Best Marks with AI Grader

Need help grading? Try our AI Grader for instant feedback on your assignments.
Document Page
Table 2: t-Test: Two-Sample Assuming Unequal Variances
Price Test price
Mean 123.3709 115
Variance 162.5249 0
Observations 1000 1000
Hypothesized Mean Difference 0
df 999
t Stat 20.76405
P(T<=t) one-tail 3.4E-80
t Critical one-tail 1.64638
P(T<=t) two-tail 6.79E-80
t Critical two-tail 1.962341
From the table above, we can see that the average fuel price is $123.37 and the p-value is
0.000 (a value less than 5% level of significance), we therefore reject the null hypothesis
and conclude that the average price of petrol is in all service stations in September 2016
is more than 115 Australian cents.
3. Section 3: Analysis of two variables in Dataset 1
a. Summary statistics
In this section, we present the summary statistics comparing the prices for four different
brands. The results are presented below;
Table 3: Summary Statistics
Caltex Caltex
Woolworth
s
Coles
Express
7-Eleven
Mean 124.343 124.050 126.883 121.183
Standard Error 0.662 1.260 1.367 0.900
Median 124.900 124.900 126.400 121.450
Mode 129.900 129.900 137.900 101.900
Standard Deviation 12.377 13.511 13.599 12.915
Sample Variance 153.191 182.554 184.943 166.806
Kurtosis -0.454 2.581 -0.622 -0.840
Skewness -0.119 0.595 -0.122 0.150
Document Page
Range 71.000 85.700 53.000 48.000
Minimum 78.900 99.900 99.900 99.900
Maximum 149.900 185.600 152.900 147.900
Sum 43520.10
0
14265.800 12561.40
0
24963.60
0
Count 350.000 115.000 99.000 206.000
Confidence Level (95.0%) 1.301 2.496 2.712 1.774
From the table above, we can see that the brand with the highest average fuel prices is the
Coles Express (M = 126.88, SD = 13.60, N = 99) while the brand with the lowest average
prices was the 7-Eleven (M = 121.18, SD = 12.92, N = 206). The average for Caltex and
Caltex Woolworths was found to be 124.34 (SD = 12.38) and 124.05 (SD = 13.51)
respectively.
Figure 2: Bar chart of average price by brand
The above figure (figure 2), further shows that Coles Express is the most expensive
brand.
b. Hypothesis test
Document Page
In this section, we perform a hypothesis test to investigate whether there is significant
difference in the price for the four brands. The following hypothesis is tested.
Null hypothesis (H0): There is no significant difference in the average price for the four
brands
Alternative hypothesis (HA): At least one of the means is different
This was tested at 5% level of significance and results are presented below;
Anova: Single Factor
SUMMARY
Groups
Coun
t Sum Average Variance
Caltex 350 43520.1 124.3431 153.1912
Caltex
Woolworths 115 14265.8 124.0504 182.5539
Coles Express 99 12561.4 126.8828 184.9427
7-Eleven 206 24963.6 121.1825 166.8059
ANOVA
Source of
Variation
SS df MS F P-value F crit
Between Groups 2462.39 3 820.7967 4.96649 0.002028 2.616528
Within Groups 126594.5 766 165.267
Total 129056.9 769
From the table above, we can see that the p-value is 0.000 (a value less than 5% level of
significance), we therefore reject the null hypothesis and conclude that at least one of the
means is different.
c. Differences in petrol prices
tabler-icon-diamond-filled.svg

Paraphrase This Document

Need a fresh take? Get an instant paraphrase of this document with our AI Paraphraser
Document Page
From the results in parts a) and b) above, it is evident that there is significant difference
in the average petrol prices for the four brands. The brand with the lowest price is the 7-
Eleven brand with an average price of $121.18.
4. Section 4: Collect and analysis Dataset 2
In this section, we present the analysis of dataset 2. The results are presented below;
Figure 3: Pie chart on gender
As can be seen in the above figure (figure 2), majority of the respondents interviewed were the
males (62%, n = 31).
Document Page
Figure 4: Bar chart on preferred brand
Figure 4 above presents the most preferred brand by the students and as can be seen, majority
(26%, n = 13) of the student interviewed said to prefer 7-Elevens and it was closely followed by
Caltex Woolworths at 22% (n = 11). Caltex was the least preferred at 16% (n = 8).
5. Discussion and conclusion
The main aim of this study was to analyze the fuel prices in Australia. A sample of 1000
data points was analyzed. Results showed that considering the fuel prices for the given
time period, the prices were significantly more than an average of $115. Results further
revealed that there is significant difference in the average petrol prices for the four
selected brands with Coles Express being the most expensive brand while 7-Elevens
being the least expensive brand of the four.
Future research should use a larger sample size to allow for generalization of the results
to the entire Australia.
Document Page
Works Cited
Byrnes, L., Brown, C., Wagner, L., & Foster, J. (2016). Reviewing the viability of renewable
energy in community electrification: The case of remote Western Australian
communities. Renewable and Sustainable Energy Reviews, 59, 470–481.
chevron_up_icon
1 out of 10
circle_padding
hide_on_mobile
zoom_out_icon
logo.png

Your All-in-One AI-Powered Toolkit for Academic Success.

Available 24*7 on WhatsApp / Email

[object Object]