Group Assignment: Statistical Analysis and Interpretation for HI6007

Verified

Added on  2021/06/16

|10
|867
|247
Homework Assignment
AI Summary
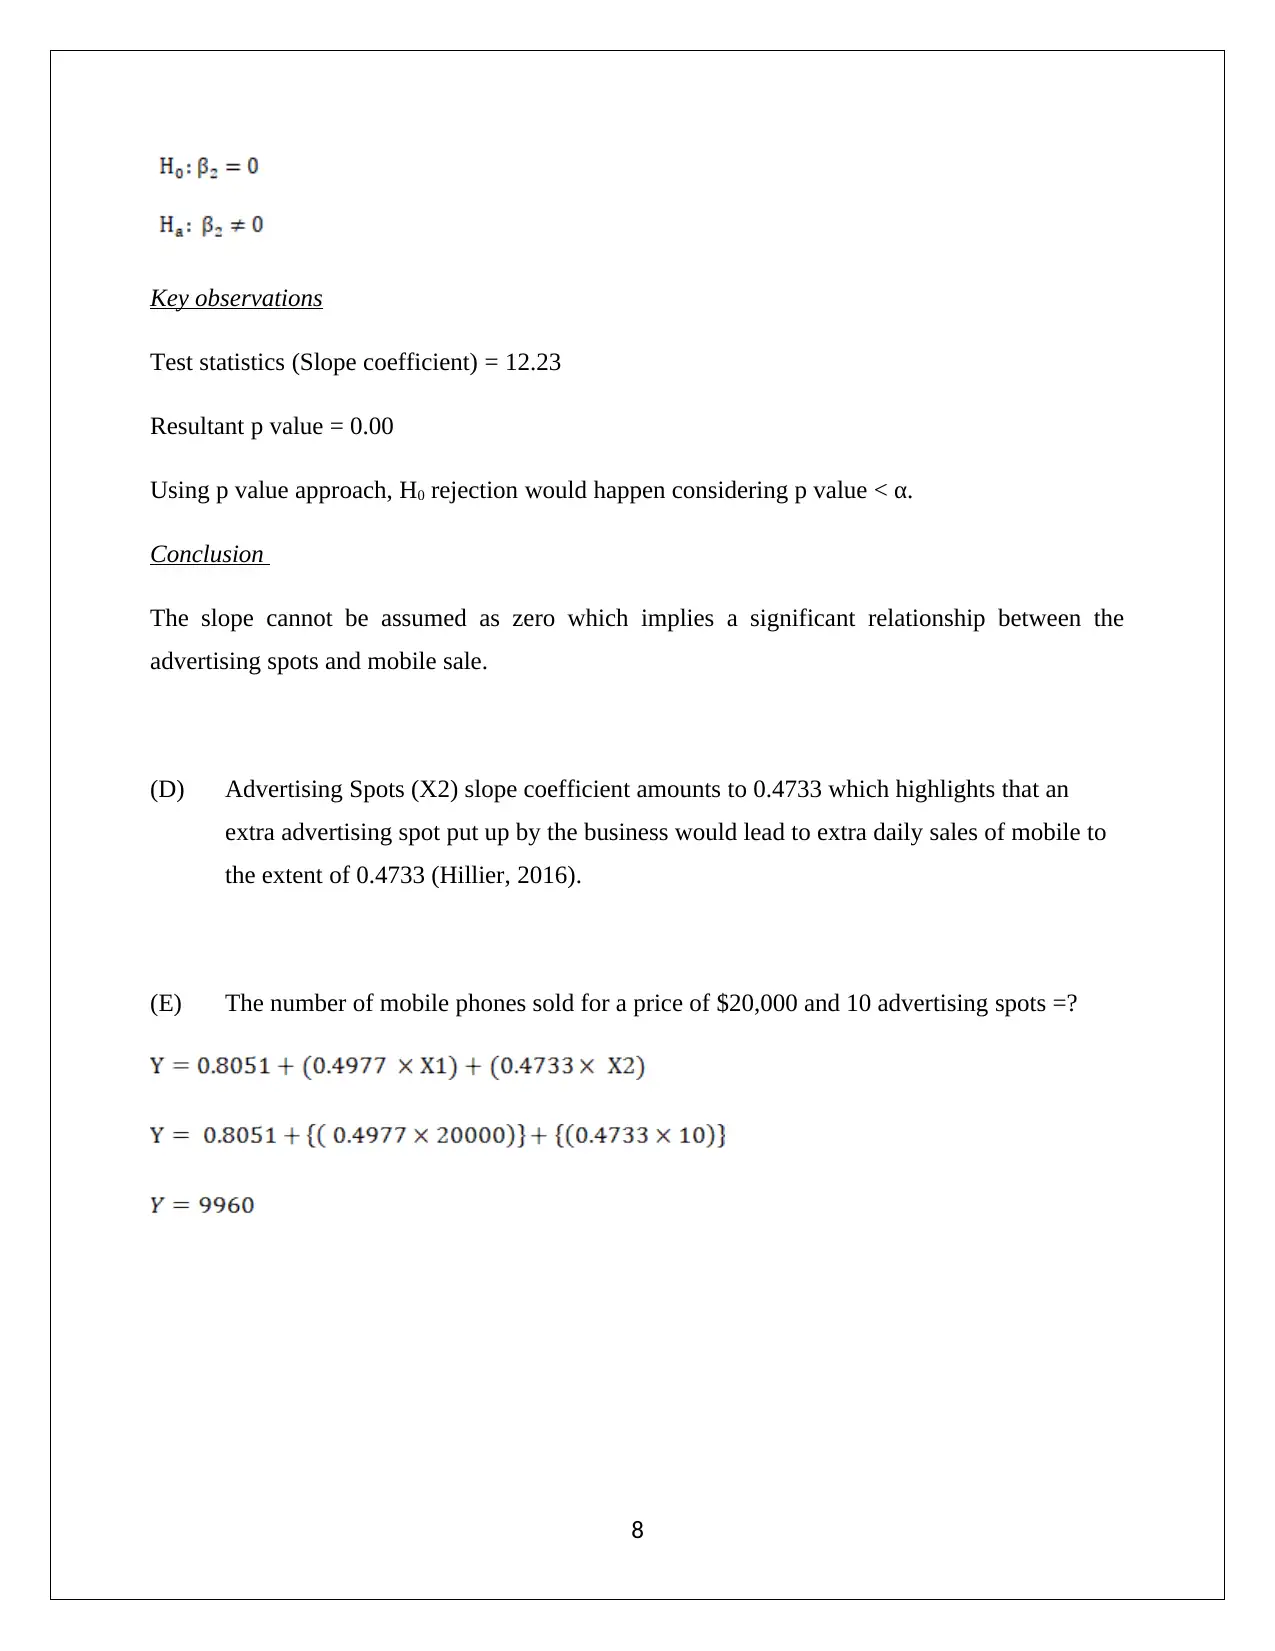
This document presents a comprehensive solution to a statistics assignment, likely for a course like HI6007. The assignment covers several key statistical concepts and techniques, including frequency distribution analysis, interpretation of histograms, and the selection of appropriate measures of central tendency. It also delves into ANOVA (Analysis of Variance) tables, interpreting test statistics, and p-values to determine the significance of results. The solution further explores regression analysis, examining slope coefficients, R-squared values, and correlation coefficients to understand relationships between variables. The document includes the formulation and testing of hypotheses, particularly within the context of multiple linear regression models. Detailed interpretations of regression equations and coefficient significance are provided, along with practical applications such as predicting sales based on price and advertising efforts. The assignment draws from various statistical resources and texts to support its analysis and conclusions, which are clearly presented with both normal and formula views, aiding understanding and application of statistical principles.
Document Page
STATISTICS
HI6007 GROUP ASSIGNMENT
[Pick the date]
Student Name
tabler-icon-diamond-filled.svg

Paraphrase This Document

Need a fresh take? Get an instant paraphrase of this document with our AI Paraphraser
Document Page
Question 1
(A) Frequency distribution
Normal view of frequency distribution
Formula view of frequency distribution
(B) Histogram
1
Document Page
Shape of the graph: Assymetric
Reason: Right tail > Left tail indicating pesence of positive skew
(C) The appropriate measure of central tendency is linked to the shape of the graph. If the
shape tends to the symmetric, then mean serves as the best indicator of central tendency.
However, in this particular case, the asymmetric shape of the histogram above implies
that median would be a better choice as if there are outliers present in the data, the
median value would not be impacted by their presence (Flick, 2015).
Question 2
Normal view of ANOVA table
2
Document Page
Formula view of frequency distribution
(A)
Key observations
Test statistics (Slope coefficient) = -8.617
Resultant p value = 0.00
Using p value approach, H0 rejection would happen considering p value < α.
3
tabler-icon-diamond-filled.svg

Paraphrase This Document

Need a fresh take? Get an instant paraphrase of this document with our AI Paraphraser
Document Page
Conclusion
The slope cannot be assumed as zero which implies a significant relationship between the
dependent and indepndent variable (Hillier, 2016).
(B) R square (Coefficient of determination)
Interpretation
For the given model, 61.71% variation in the value of the dependent variable i.e. unit price can
be accounted for by corresponding alterations in the independent variable i..e. price (Eriksson
and Kovalainen, 2015).
(C) R (Coefficient of correlation)
Conclusion
The correlation coefficient has a value of -0.786 which implies strong inverse relationship
between unit demand and price. The negative correlation coefficient is chosen ahead of the
positive value since the regression output indicatesd the presence of a negative slope coefficient
(Harmon, 2015).
Question 3
Normal view of ANOVA table
4
Document Page
Formula view of frequency distribution
No significant difference is apaprent between the means of the three populations
Ha: Out of the three population means considered, there is atleast one population mean which has
significant deviation from the others.
Key observations
Test statistics (F value) = 25.89
Resultant p value = 0.00
Using p value approach, H0 rejection would happen considering p value < α.
Conclusion
There does exist statistically significant difference between the average values of the three
popualtion and they cannot be assumed to be same (Flick, 2015).
5
Document Page
Question 4
Normal view of regression model
Formula view of frequency distribution
(A) Regression equation for the regression model
(B)
Both the slope coefficients are insignificant and hence can be taken as zero.
Ha: There does exist at a minimum one slope coefficient which is significant and hence cannot be
taken as zero.
Key observations
6
tabler-icon-diamond-filled.svg

Paraphrase This Document

Need a fresh take? Get an instant paraphrase of this document with our AI Paraphraser
Document Page
Test statistics (F value) = 80.12
Resultant p value = 0.00
Using p value approach, H0 rejection would happen considering p value < α.
Conclusion
The mutliple linear regression model outlined above is statistically significant.
(C) Hypotheses
Mobile Price (X1)
Key observations
Test statistics (Slope coefficient) = 1.078
Resultant p value = 0.206
Using p value approach, H0 rejection would not happen considering p value > α.
Conclusion
The slope can be assumed as zero which implies non-existence of significant relationship
between the price and mobile sale.
Advertising Spots (X2)
7
Document Page
Key observations
Test statistics (Slope coefficient) = 12.23
Resultant p value = 0.00
Using p value approach, H0 rejection would happen considering p value < α.
Conclusion
The slope cannot be assumed as zero which implies a significant relationship between the
advertising spots and mobile sale.
(D) Advertising Spots (X2) slope coefficient amounts to 0.4733 which highlights that an
extra advertising spot put up by the business would lead to extra daily sales of mobile to
the extent of 0.4733 (Hillier, 2016).
(E) The number of mobile phones sold for a price of $20,000 and 10 advertising spots =?
8
Document Page
References
Eriksson, P. and Kovalainen, A. (2015) Quantitative methods in business research 3rd ed.
London: Sage Publications.
Flick, U. (2015) Introducing research methodology: A beginner's guide to doing a research
project. 4th ed. New York: Sage Publications.
Harmon, M. (2015) Hypothesis Testing in Excel - The Excel Statistical Master 7th ed. Florida:
Mark Harmon.
Hillier, F. (2016) Introduction to Operations Research 6th ed. New York: McGraw Hill
Publications.
9
chevron_up_icon
1 out of 10
circle_padding
hide_on_mobile
zoom_out_icon
[object Object]