QUA301 Foundations: Quantitative Literacy - Assignment 2 Solution

Verified

Added on  2023/01/19

|10
|1176
|83
Homework Assignment
AI Summary
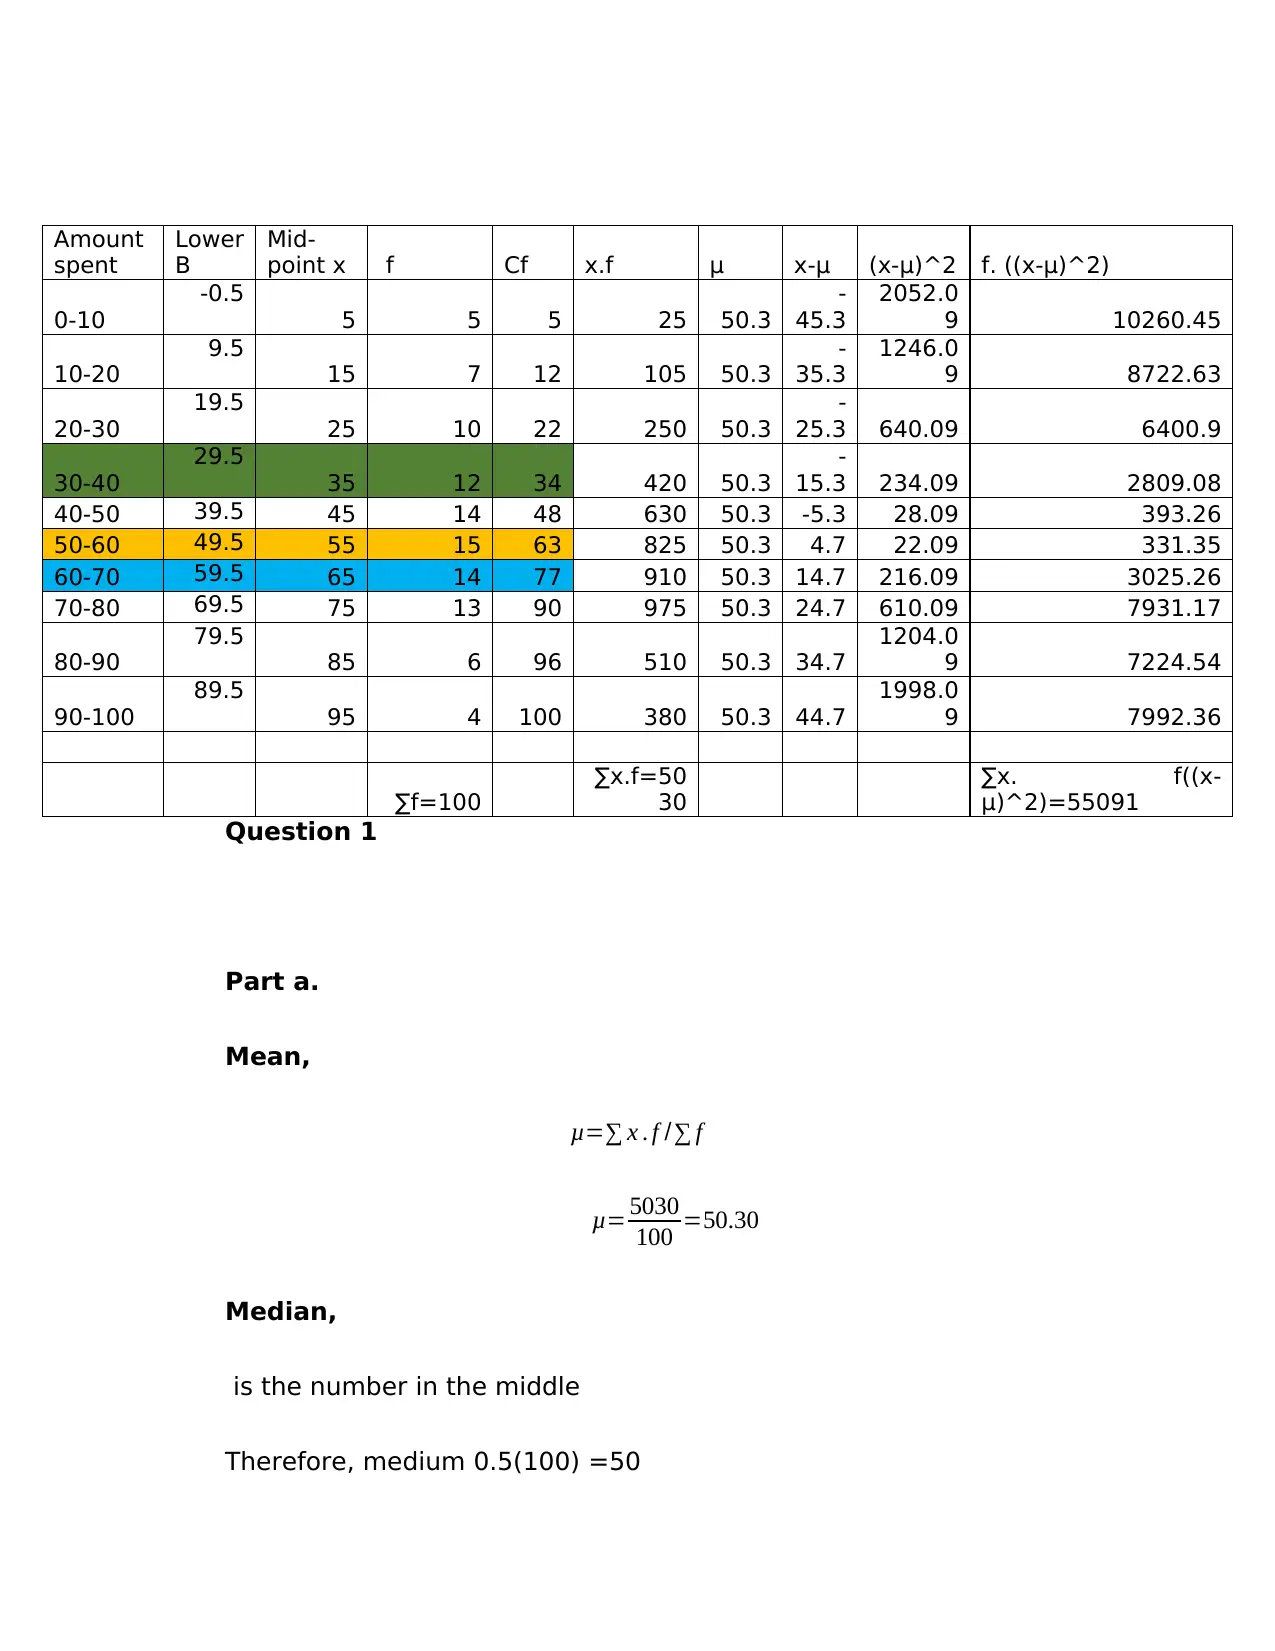
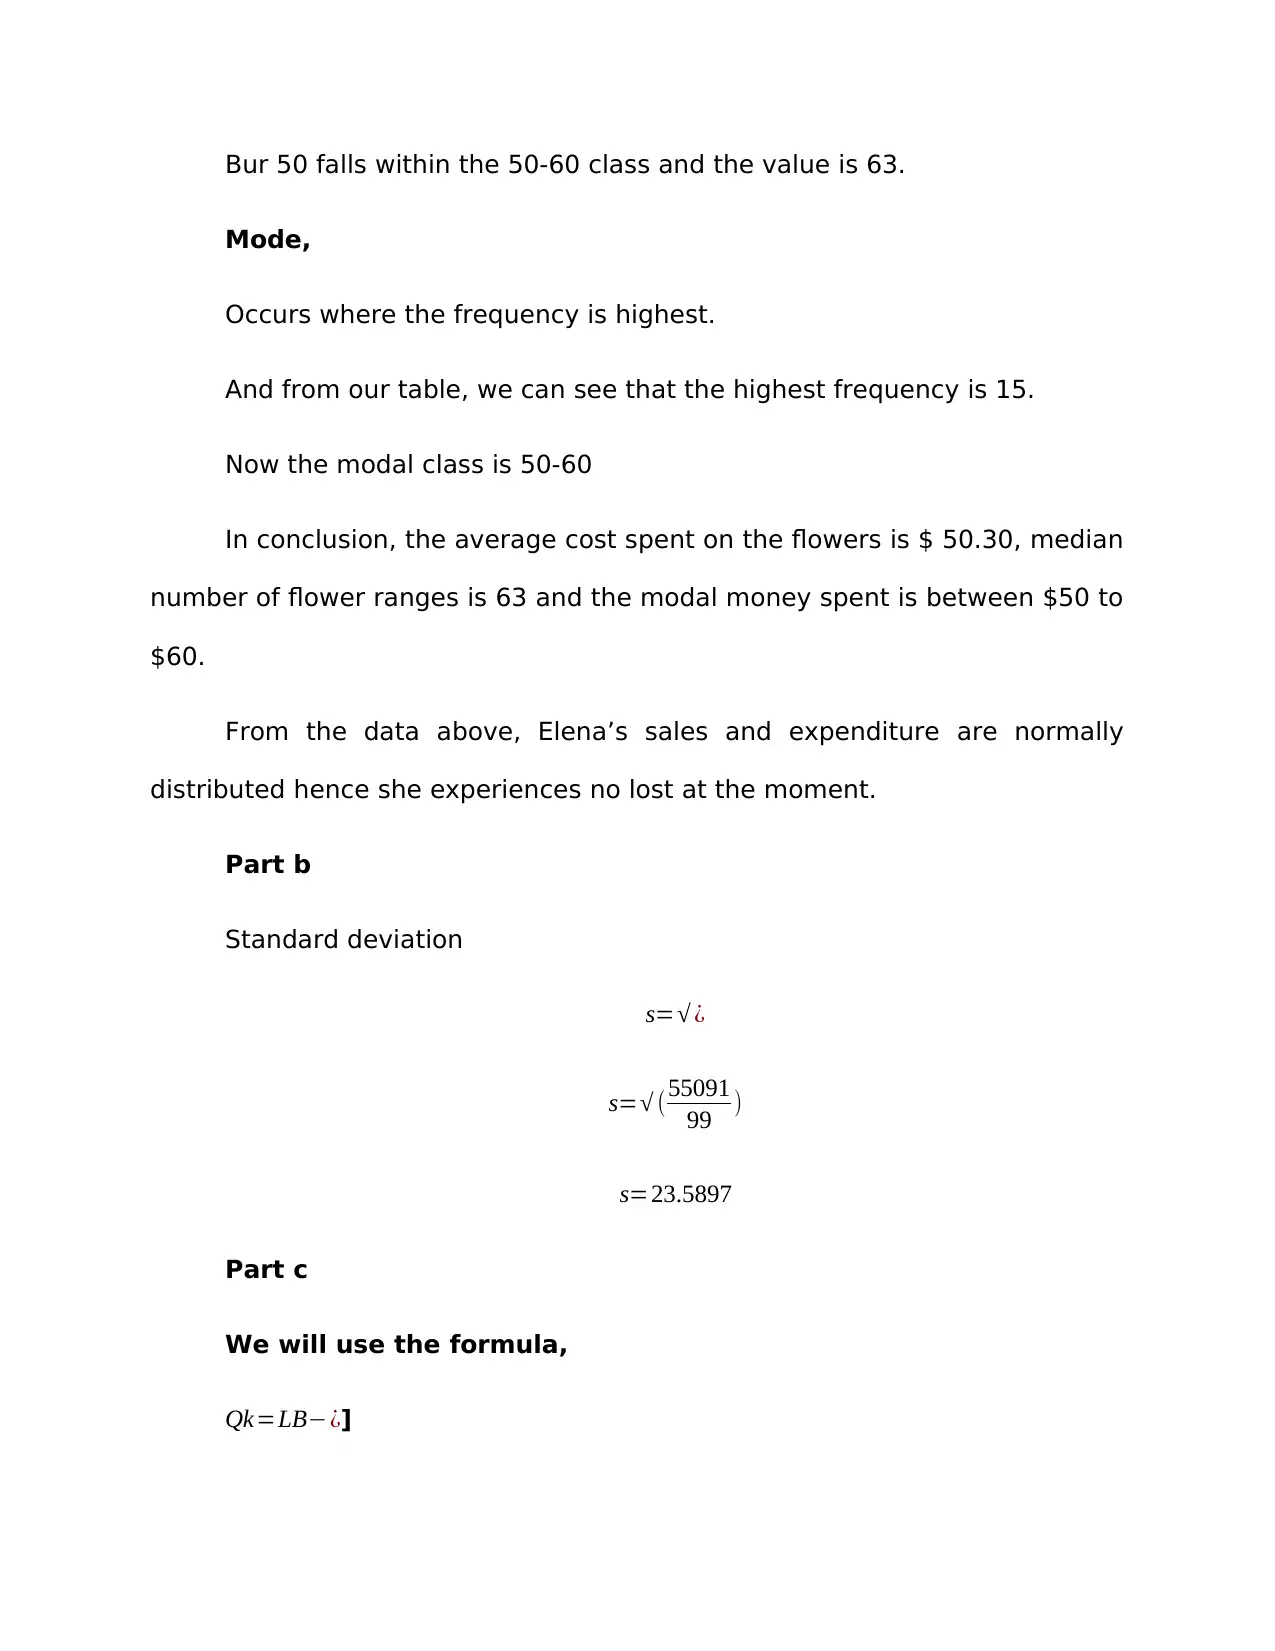
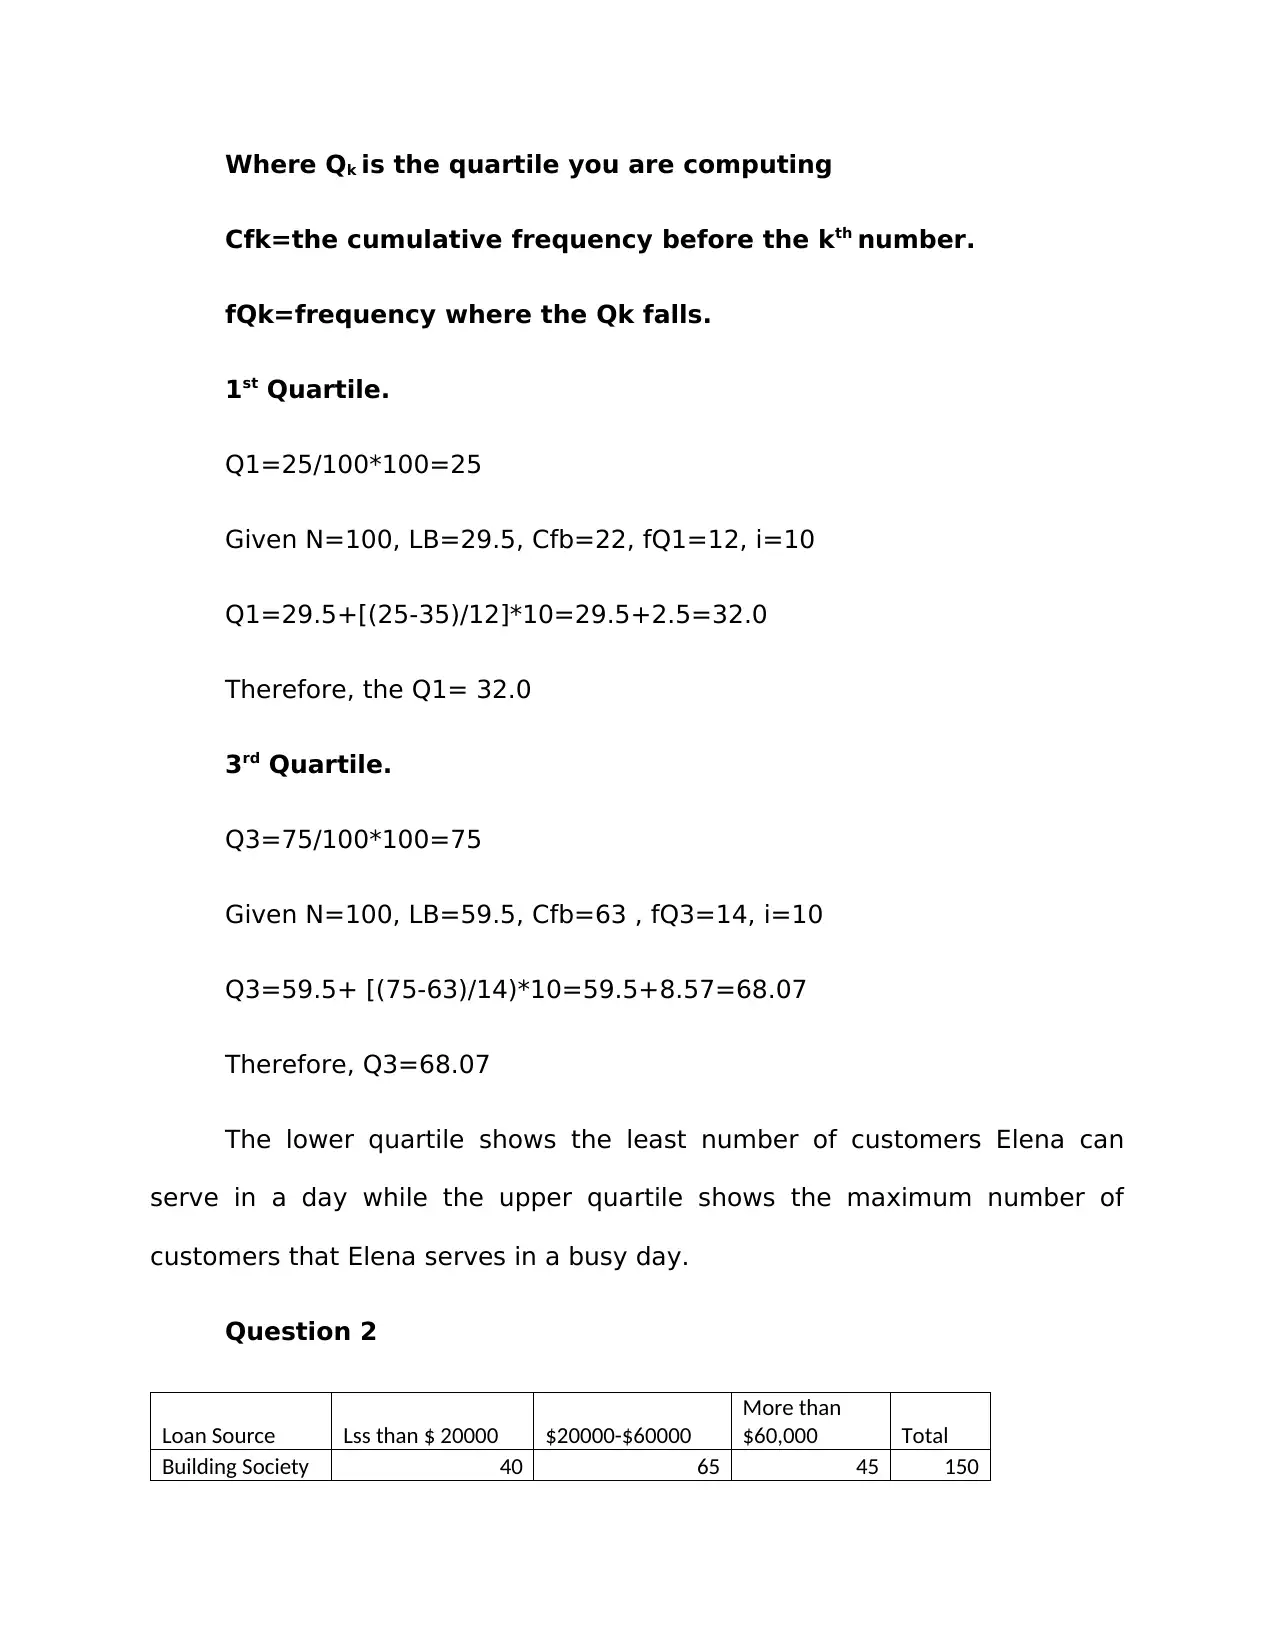
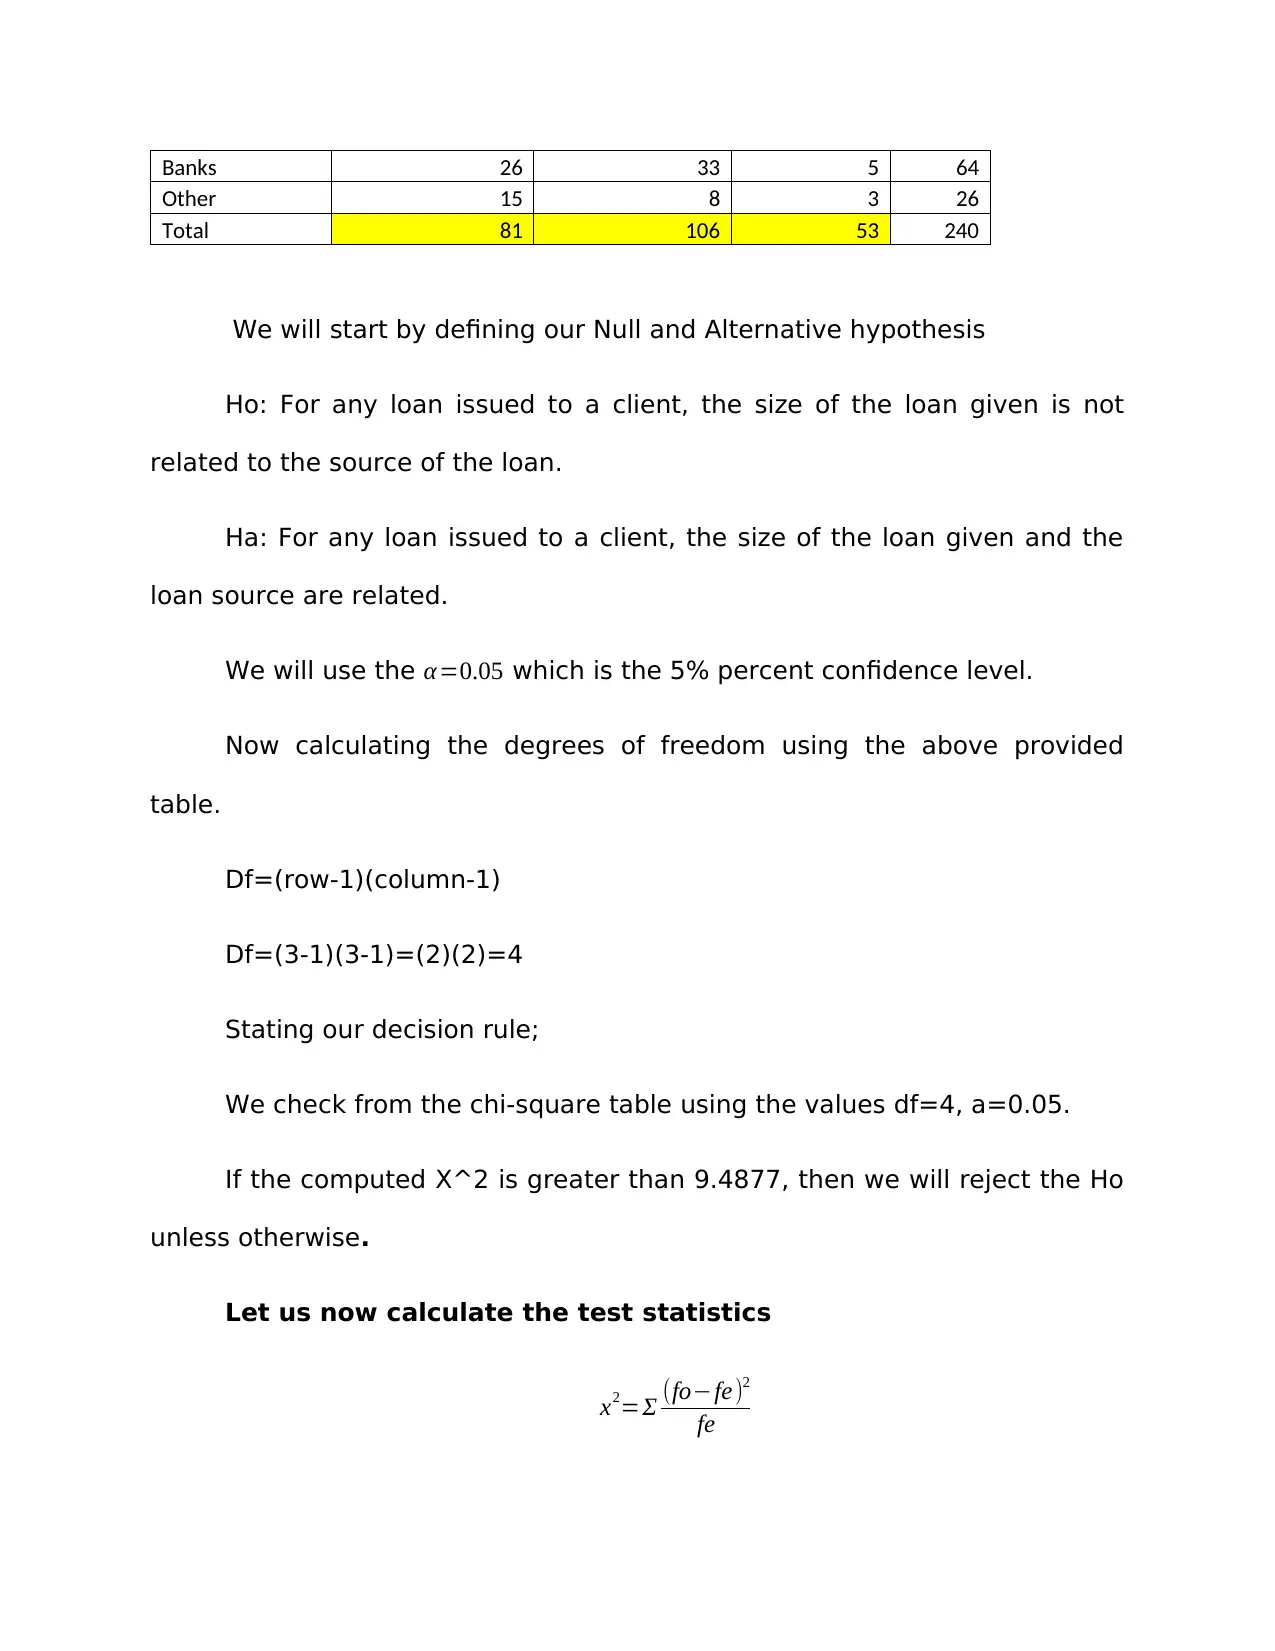
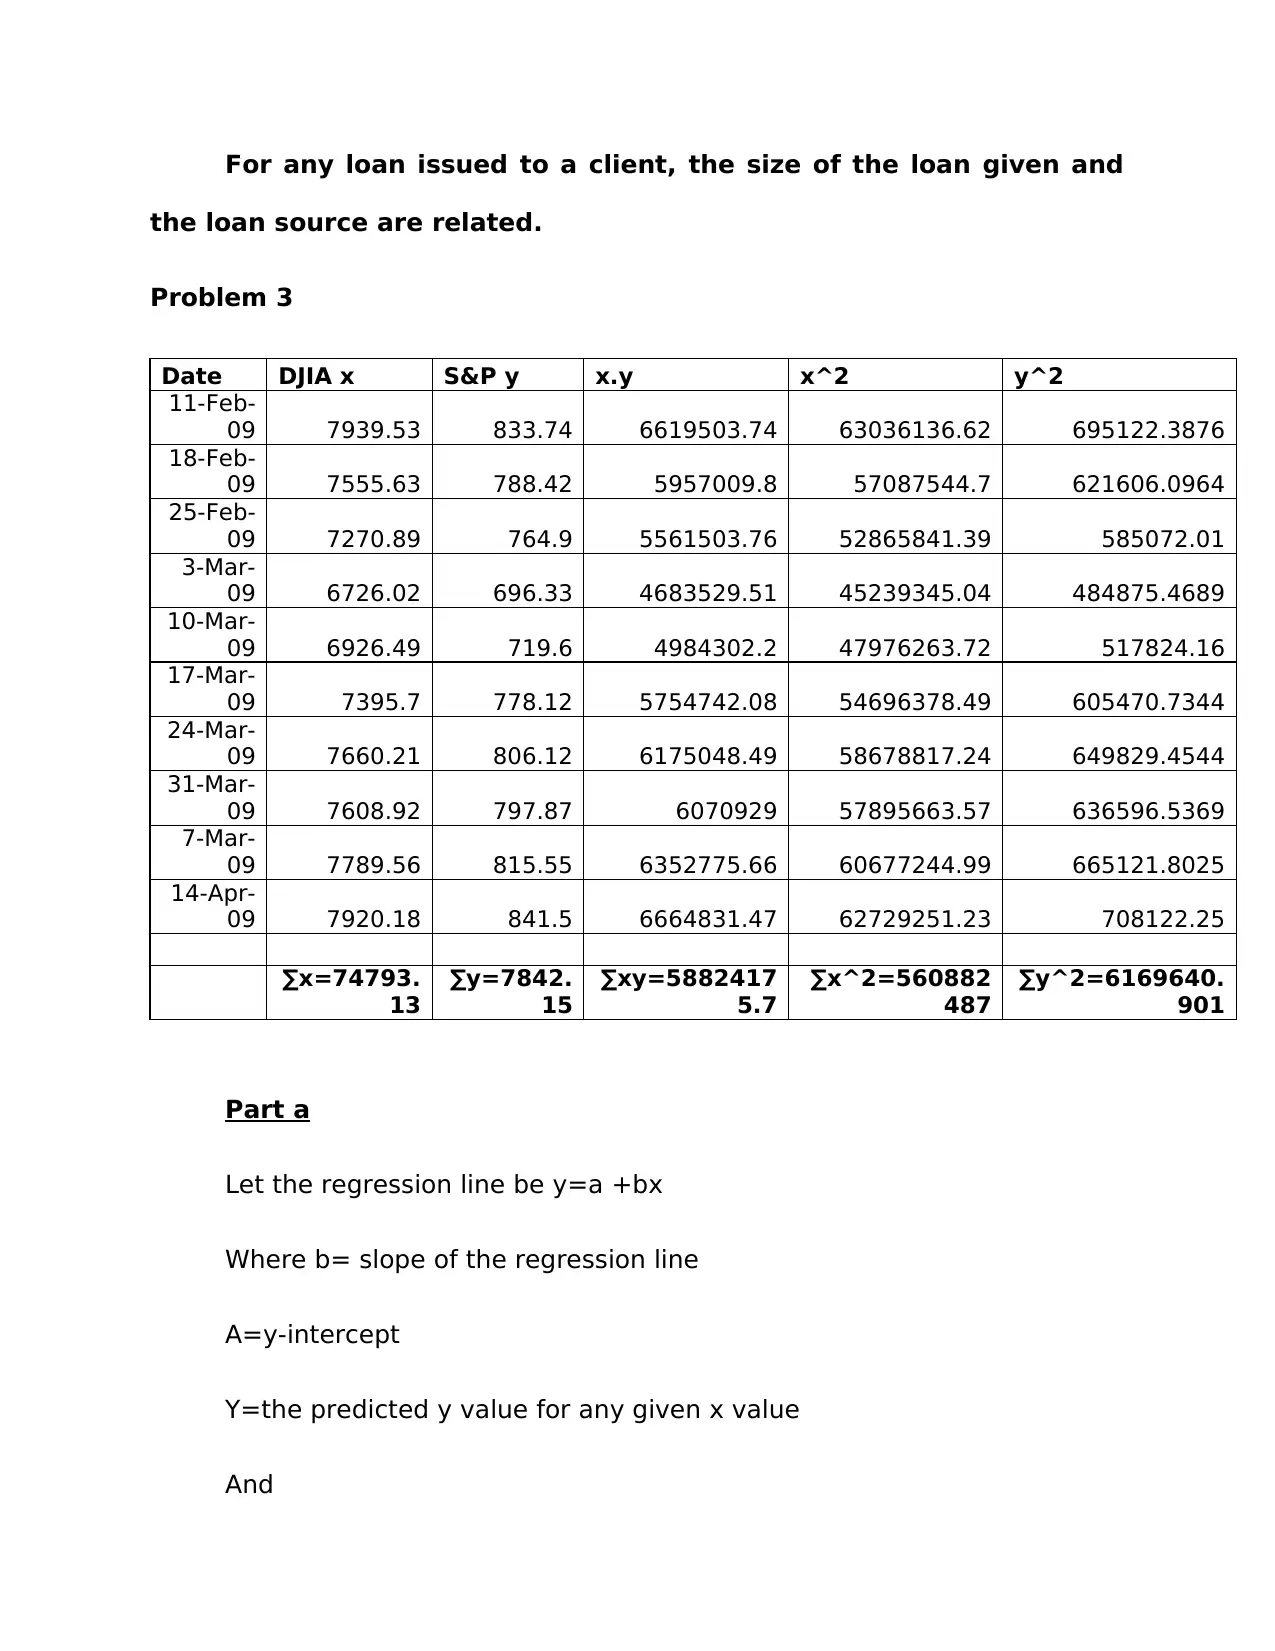
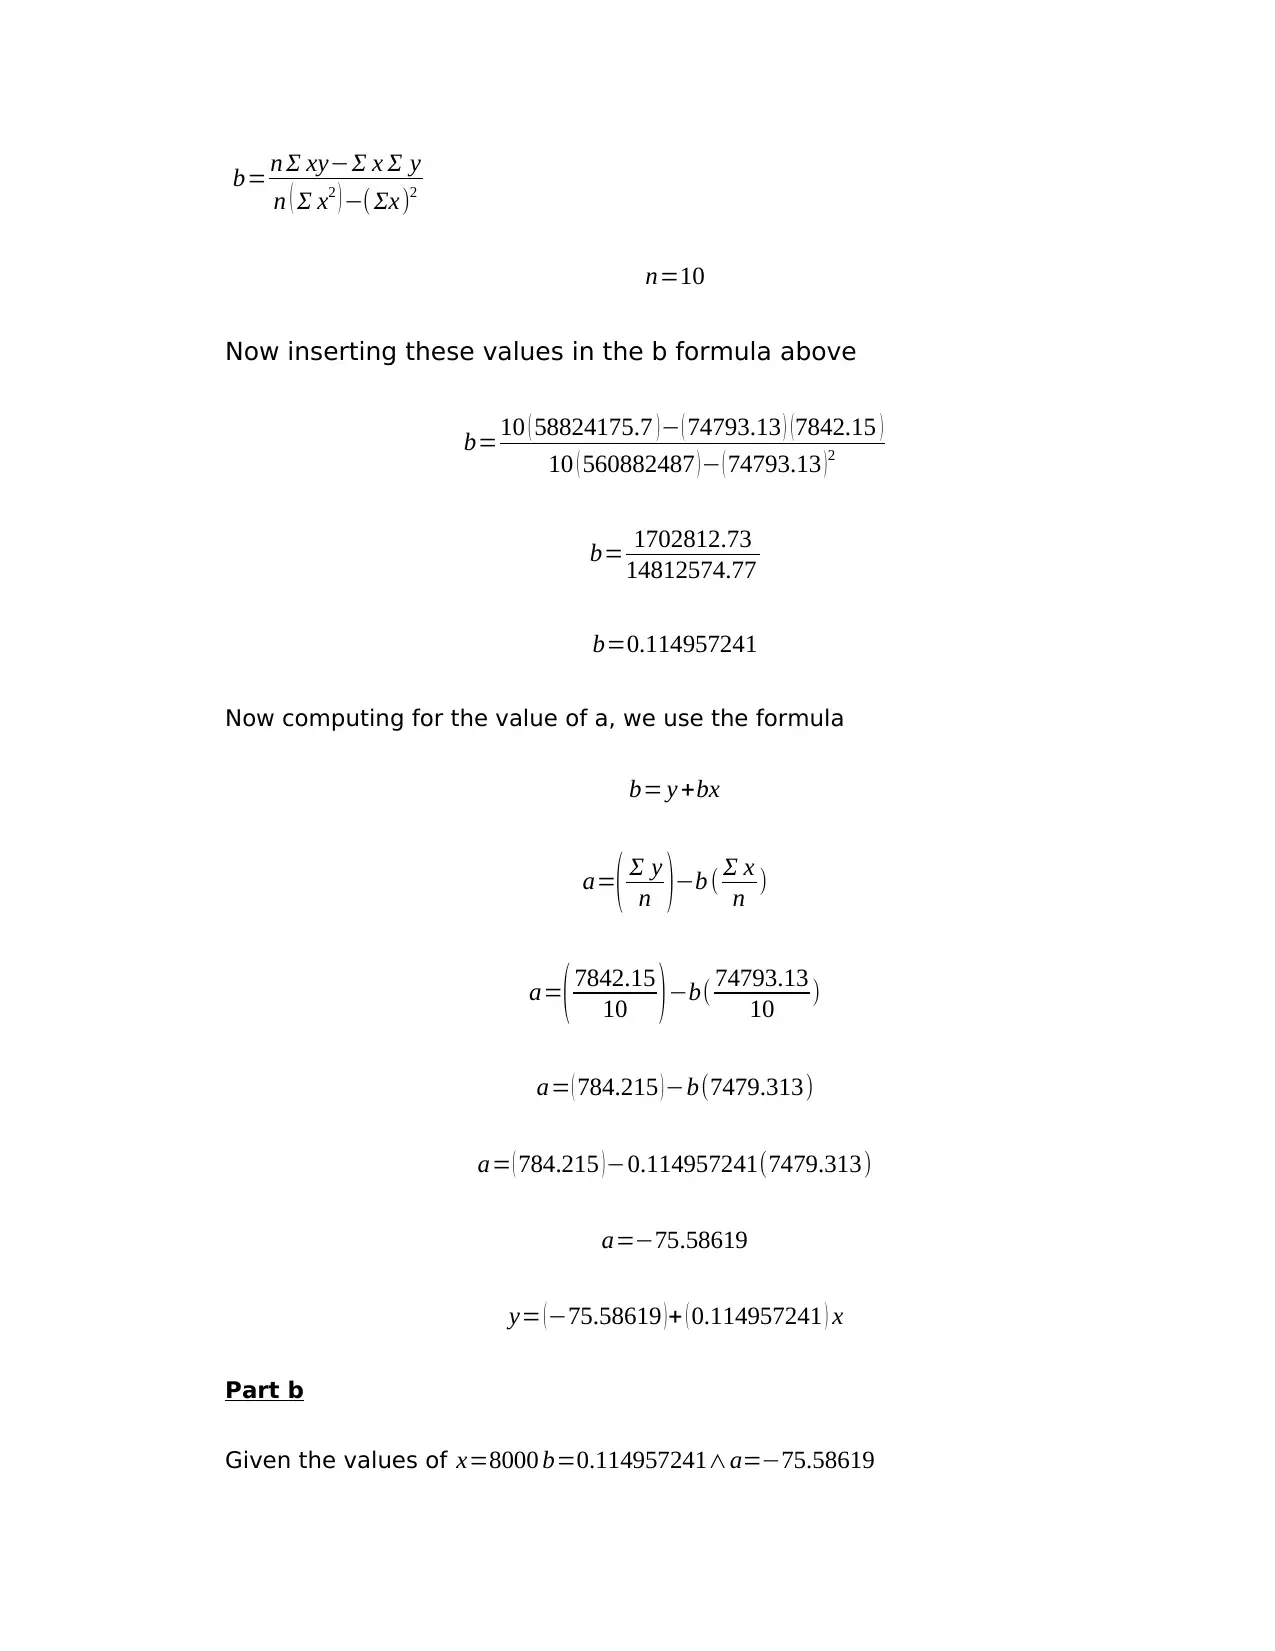
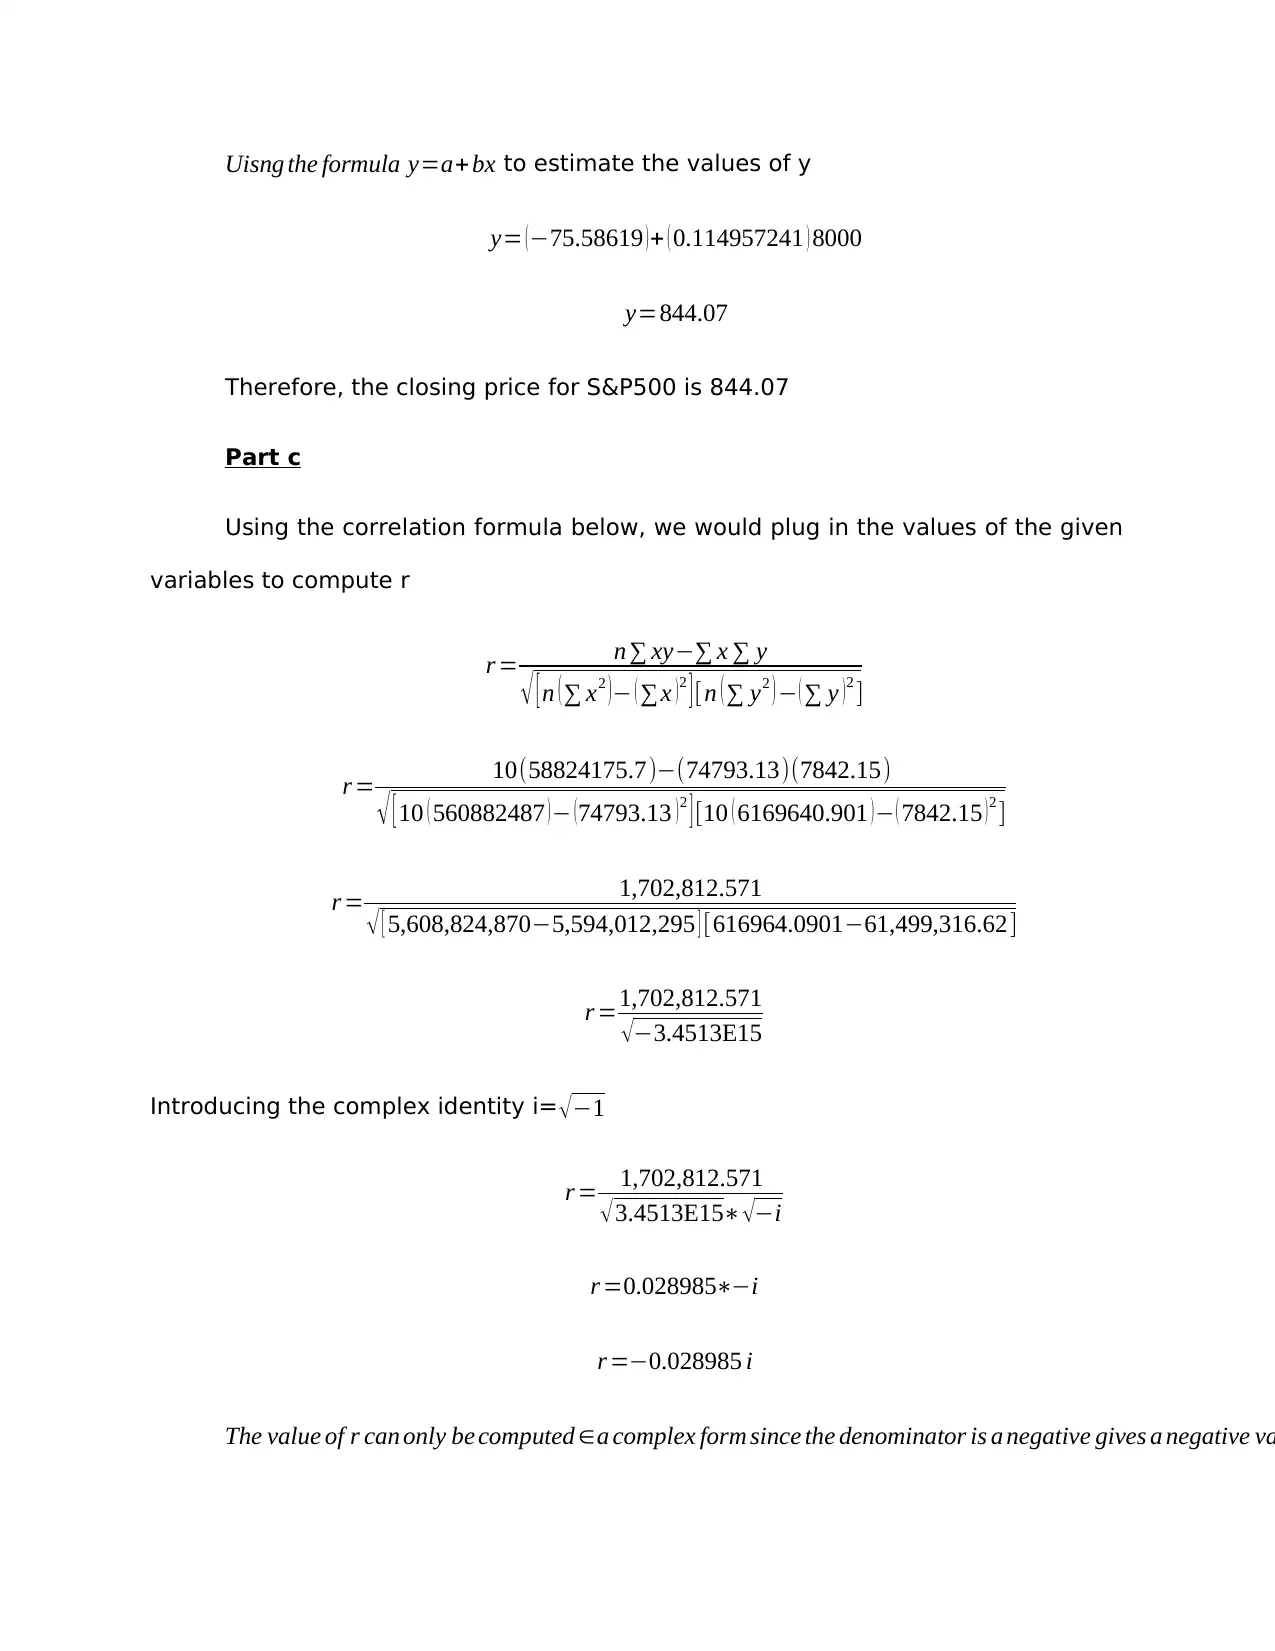
This document provides a comprehensive solution to a QUA301 Foundations of Quantitative Literacy assignment, focusing on data analysis techniques. The solution addresses various statistical concepts, including calculating the mean, median, and mode for a given dataset representing flower sales. It also covers the calculation of standard deviation, quartiles (25th and 75th percentiles), and the interquartile range. Furthermore, the solution delves into hypothesis testing using the chi-square test to analyze the relationship between loan sources and loan sizes, and explores regression analysis to model the relationship between stock market indices. Detailed calculations and explanations are provided throughout the solution, offering a thorough understanding of the statistical methods applied. The assignment also provides insights into practical applications of these statistical concepts in a business context, such as analyzing sales data and making informed business decisions.
Document Page
Amount
spent
Lower
B
Mid-
point x f Cf x.f μ x-μ (x-μ)^2 f. ((x-μ)^2)
0-10
-0.5
5 5 5 25 50.3
-
45.3
2052.0
9 10260.45
10-20
9.5
15 7 12 105 50.3
-
35.3
1246.0
9 8722.63
20-30
19.5
25 10 22 250 50.3
-
25.3 640.09 6400.9
30-40
29.5
35 12 34 420 50.3
-
15.3 234.09 2809.08
40-50 39.5 45 14 48 630 50.3 -5.3 28.09 393.26
50-60 49.5 55 15 63 825 50.3 4.7 22.09 331.35
60-70 59.5 65 14 77 910 50.3 14.7 216.09 3025.26
70-80 69.5 75 13 90 975 50.3 24.7 610.09 7931.17
80-90
79.5
85 6 96 510 50.3 34.7
1204.0
9 7224.54
90-100
89.5
95 4 100 380 50.3 44.7
1998.0
9 7992.36
∑f=100
∑x.f=50
30
∑x. f((x-
μ)^2)=55091
Question 1
Part a.
Mean,
μ= x . f / f
μ= 5030
100 =50.30
Median,
is the number in the middle
Therefore, medium 0.5(100) =50
tabler-icon-diamond-filled.svg

Paraphrase This Document

Need a fresh take? Get an instant paraphrase of this document with our AI Paraphraser
Document Page
Bur 50 falls within the 50-60 class and the value is 63.
Mode,
Occurs where the frequency is highest.
And from our table, we can see that the highest frequency is 15.
Now the modal class is 50-60
In conclusion, the average cost spent on the flowers is $ 50.30, median
number of flower ranges is 63 and the modal money spent is between $50 to
$60.
From the data above, Elena’s sales and expenditure are normally
distributed hence she experiences no lost at the moment.
Part b
Standard deviation
s= ¿
s= (55091
99 )
s=23.5897
Part c
We will use the formula,
Qk=LB¿]
Document Page
Where Qk is the quartile you are computing
Cfk=the cumulative frequency before the kth number.
fQk=frequency where the Qk falls.
1st Quartile.
Q1=25/100*100=25
Given N=100, LB=29.5, Cfb=22, fQ1=12, i=10
Q1=29.5+[(25-35)/12]*10=29.5+2.5=32.0
Therefore, the Q1= 32.0
3rd Quartile.
Q3=75/100*100=75
Given N=100, LB=59.5, Cfb=63 , fQ3=14, i=10
Q3=59.5+ [(75-63)/14)*10=59.5+8.57=68.07
Therefore, Q3=68.07
The lower quartile shows the least number of customers Elena can
serve in a day while the upper quartile shows the maximum number of
customers that Elena serves in a busy day.
Question 2
Loan Source Lss than $ 20000 $20000-$60000
More than
$60,000 Total
Building Society 40 65 45 150
Document Page
Banks 26 33 5 64
Other 15 8 3 26
Total 81 106 53 240
We will start by defining our Null and Alternative hypothesis
Ho: For any loan issued to a client, the size of the loan given is not
related to the source of the loan.
Ha: For any loan issued to a client, the size of the loan given and the
loan source are related.
We will use the α=0.05 which is the 5% percent confidence level.
Now calculating the degrees of freedom using the above provided
table.
Df=(row-1)(column-1)
Df=(3-1)(3-1)=(2)(2)=4
Stating our decision rule;
We check from the chi-square table using the values df=4, a=0.05.
If the computed X^2 is greater than 9.4877, then we will reject the Ho
unless otherwise.
Let us now calculate the test statistics
x2=Σ (fofe)2
fe
tabler-icon-diamond-filled.svg

Paraphrase This Document

Need a fresh take? Get an instant paraphrase of this document with our AI Paraphraser
Document Page
Where
x^2= is the chi-square
fo=observable values
fe=expected values
fe= fcfr
n
To calculate these values effectively; we will generate another
table for expected values.
Expected <$20000 $20000-$60000 >$60000
Building Source 50.63 66.25 33.13
Banks 21.60 28.27 14.13
Other 8.78 11.48 5.74
x2=(4050.63)2
50.63 +(2621.60)2
21.60 +(158.78)2
8.78 + (6566.25)2
66.25 + (3328.27)2
28.27 + (811.48)2
11.48 + (4533.13)2
33.13
x2=2.2318+0.8963+4.4064+0.02358+ 0.7914+1.0549+4.2528+ 5.8993+1.3079
x2=19.5565
Results
Because our chi-square is 19.5565 which is greater than, 9.4877 we
will REJECT the NULL hypothesis.
Conclusion
Document Page
For any loan issued to a client, the size of the loan given and
the loan source are related.
Problem 3
Date DJIA x S&P y x.y x^2 y^2
11-Feb-
09 7939.53 833.74 6619503.74 63036136.62 695122.3876
18-Feb-
09 7555.63 788.42 5957009.8 57087544.7 621606.0964
25-Feb-
09 7270.89 764.9 5561503.76 52865841.39 585072.01
3-Mar-
09 6726.02 696.33 4683529.51 45239345.04 484875.4689
10-Mar-
09 6926.49 719.6 4984302.2 47976263.72 517824.16
17-Mar-
09 7395.7 778.12 5754742.08 54696378.49 605470.7344
24-Mar-
09 7660.21 806.12 6175048.49 58678817.24 649829.4544
31-Mar-
09 7608.92 797.87 6070929 57895663.57 636596.5369
7-Mar-
09 7789.56 815.55 6352775.66 60677244.99 665121.8025
14-Apr-
09 7920.18 841.5 6664831.47 62729251.23 708122.25
∑x=74793.
13
∑y=7842.
15
∑xy=5882417
5.7
∑x^2=560882
487
∑y^2=6169640.
901
Part a
Let the regression line be y=a +bx
Where b= slope of the regression line
A=y-intercept
Y=the predicted y value for any given x value
And
Document Page
b= n Σ xyΣ x Σ y
n ( Σ x2 ) ( Σx)2
n=10
Now inserting these values in the b formula above
b=10 ( 58824175.7 ) ( 74793.13 ) (7842.15 )
10 ( 560882487 ) ( 74793.13 )2
b= 1702812.73
14812574.77
b=0.114957241
Now computing for the value of a, we use the formula
b= y +bx
a=( Σ y
n )b ( Σ x
n )
a=( 7842.15
10 )b( 74793.13
10 )
a= ( 784.215 )b(7479.313)
a= ( 784.215 ) 0.114957241(7479.313)
a=75.58619
y= (75.58619 )+ ( 0.114957241 ) x
Part b
Given the values of x=8000 b=0.114957241a=75.58619
tabler-icon-diamond-filled.svg

Paraphrase This Document

Need a fresh take? Get an instant paraphrase of this document with our AI Paraphraser
Document Page
Uisng the formula y=a+ bx to estimate the values of y
y= (75.58619 )+ ( 0.114957241 ) 8000
y=844.07
Therefore, the closing price for S&P500 is 844.07
Part c
Using the correlation formula below, we would plug in the values of the given
variables to compute r
r = n xy x y
[ n ( x2 ) ( x ) 2 ] [n ( y2 ) ( y ) 2 ]
r = 10(58824175.7)(74793.13)(7842.15)
[ 10 ( 560882487 ) (74793.13 )2 ] [10 ( 6169640.901 ) ( 7842.15 )2 ]
r = 1,702,812.571
[ 5,608,824,8705,594,012,295 ] [616964.090161,499,316.62]
r =1,702,812.571
3.4513E15
Introducing the complex identity i= 1
r = 1,702,812.571
3.4513E15 i
r =0.028985i
r =0.028985 i
The value of r can only be computed a complex form since the denominator is a negative gives a negative va
Document Page
This means that there is insignificant or no correlation between the cost of
flowers and the number of flowers present in the shop.
Document Page
chevron_up_icon
1 out of 10
circle_padding
hide_on_mobile
zoom_out_icon
[object Object]