Statistics Assignment: Analyzing Business Startup Costs and Regression

Verified

Added on  2020/03/16

|10
|481
|54
Report
AI Summary
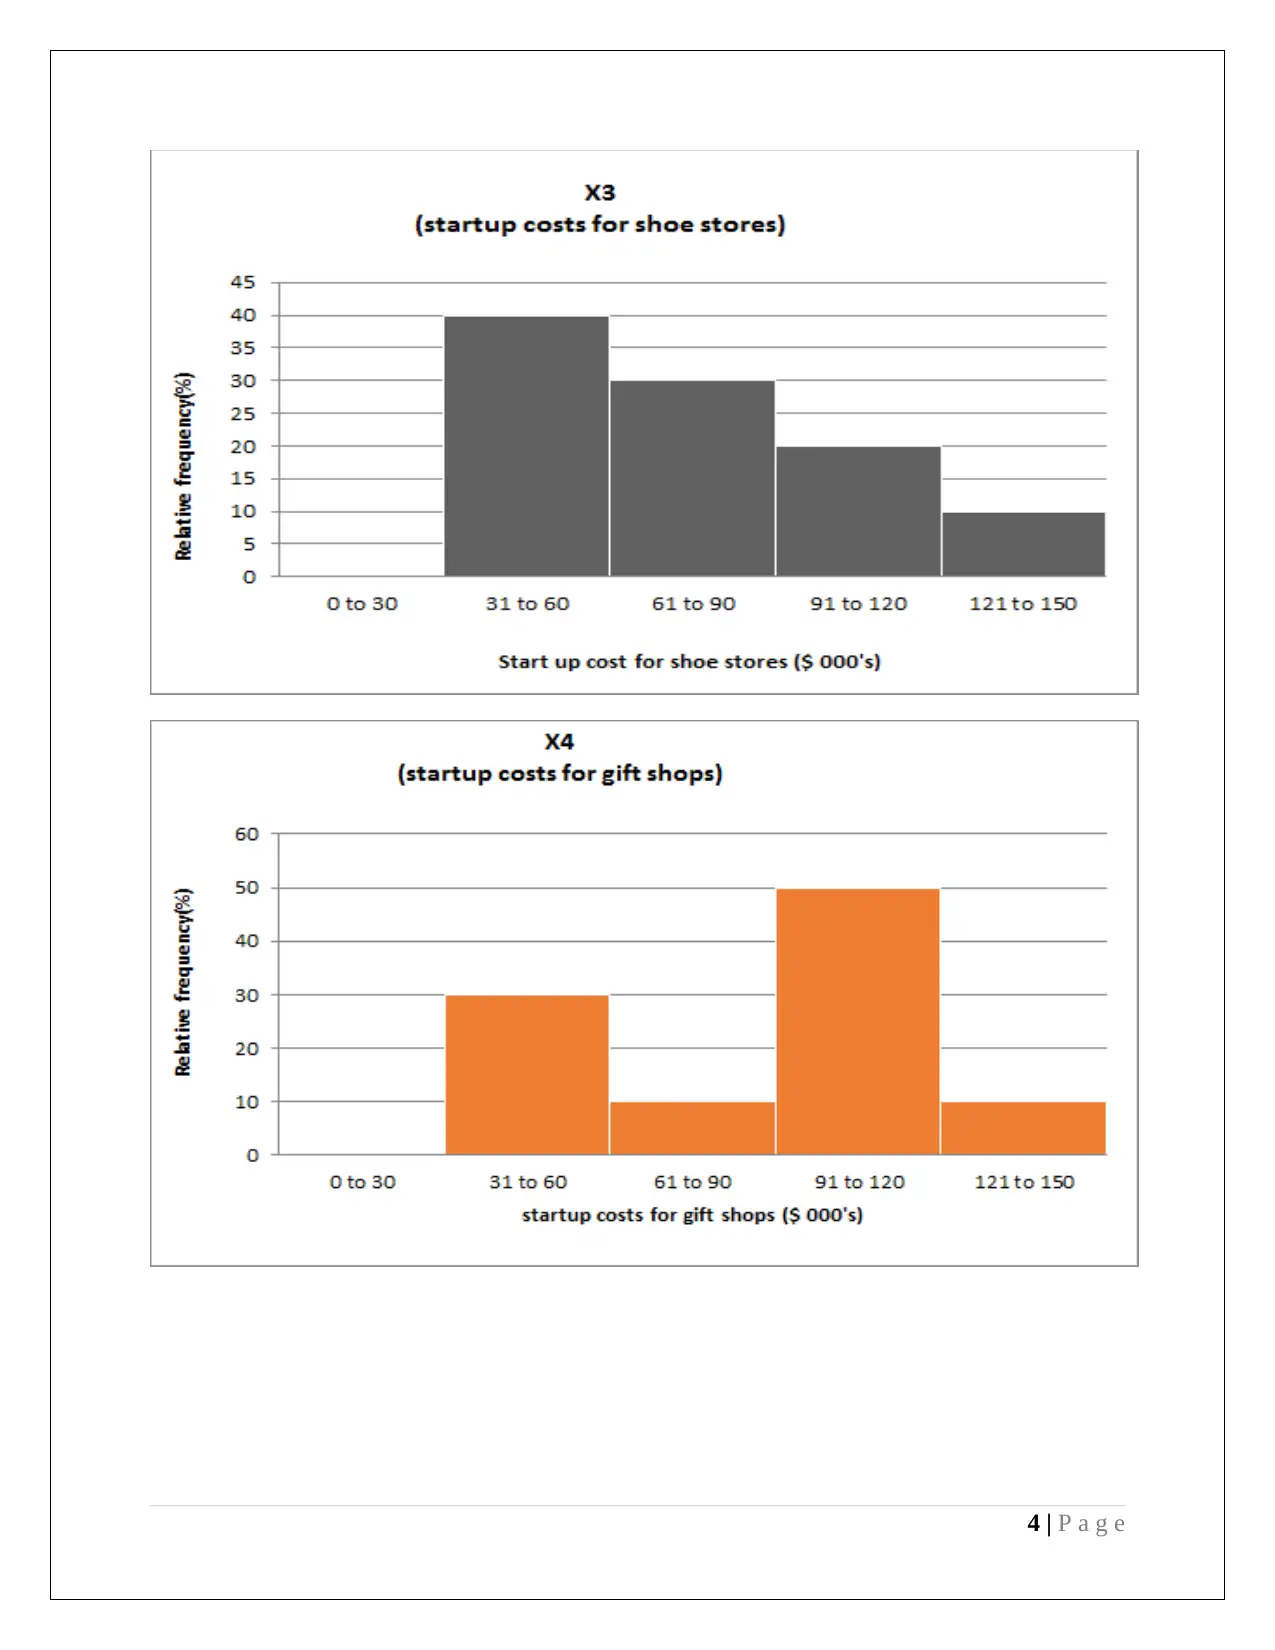
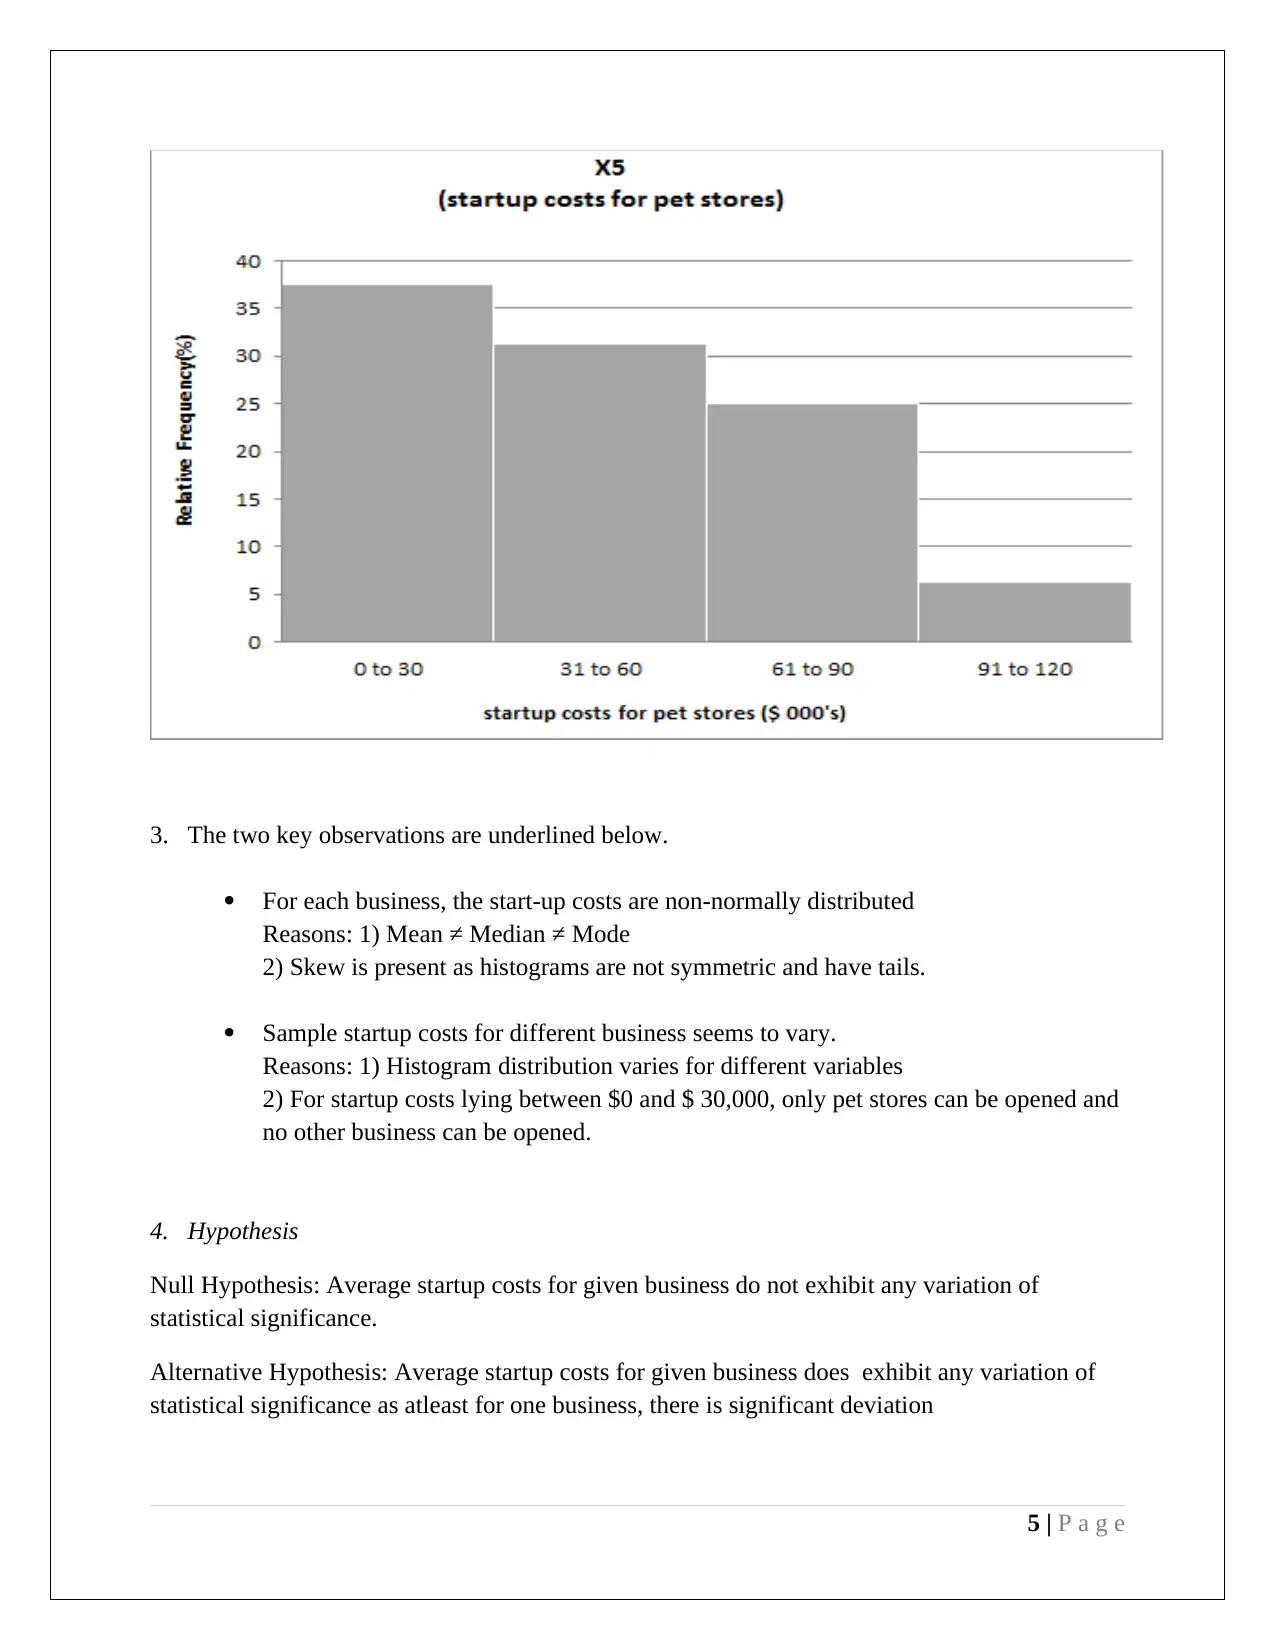
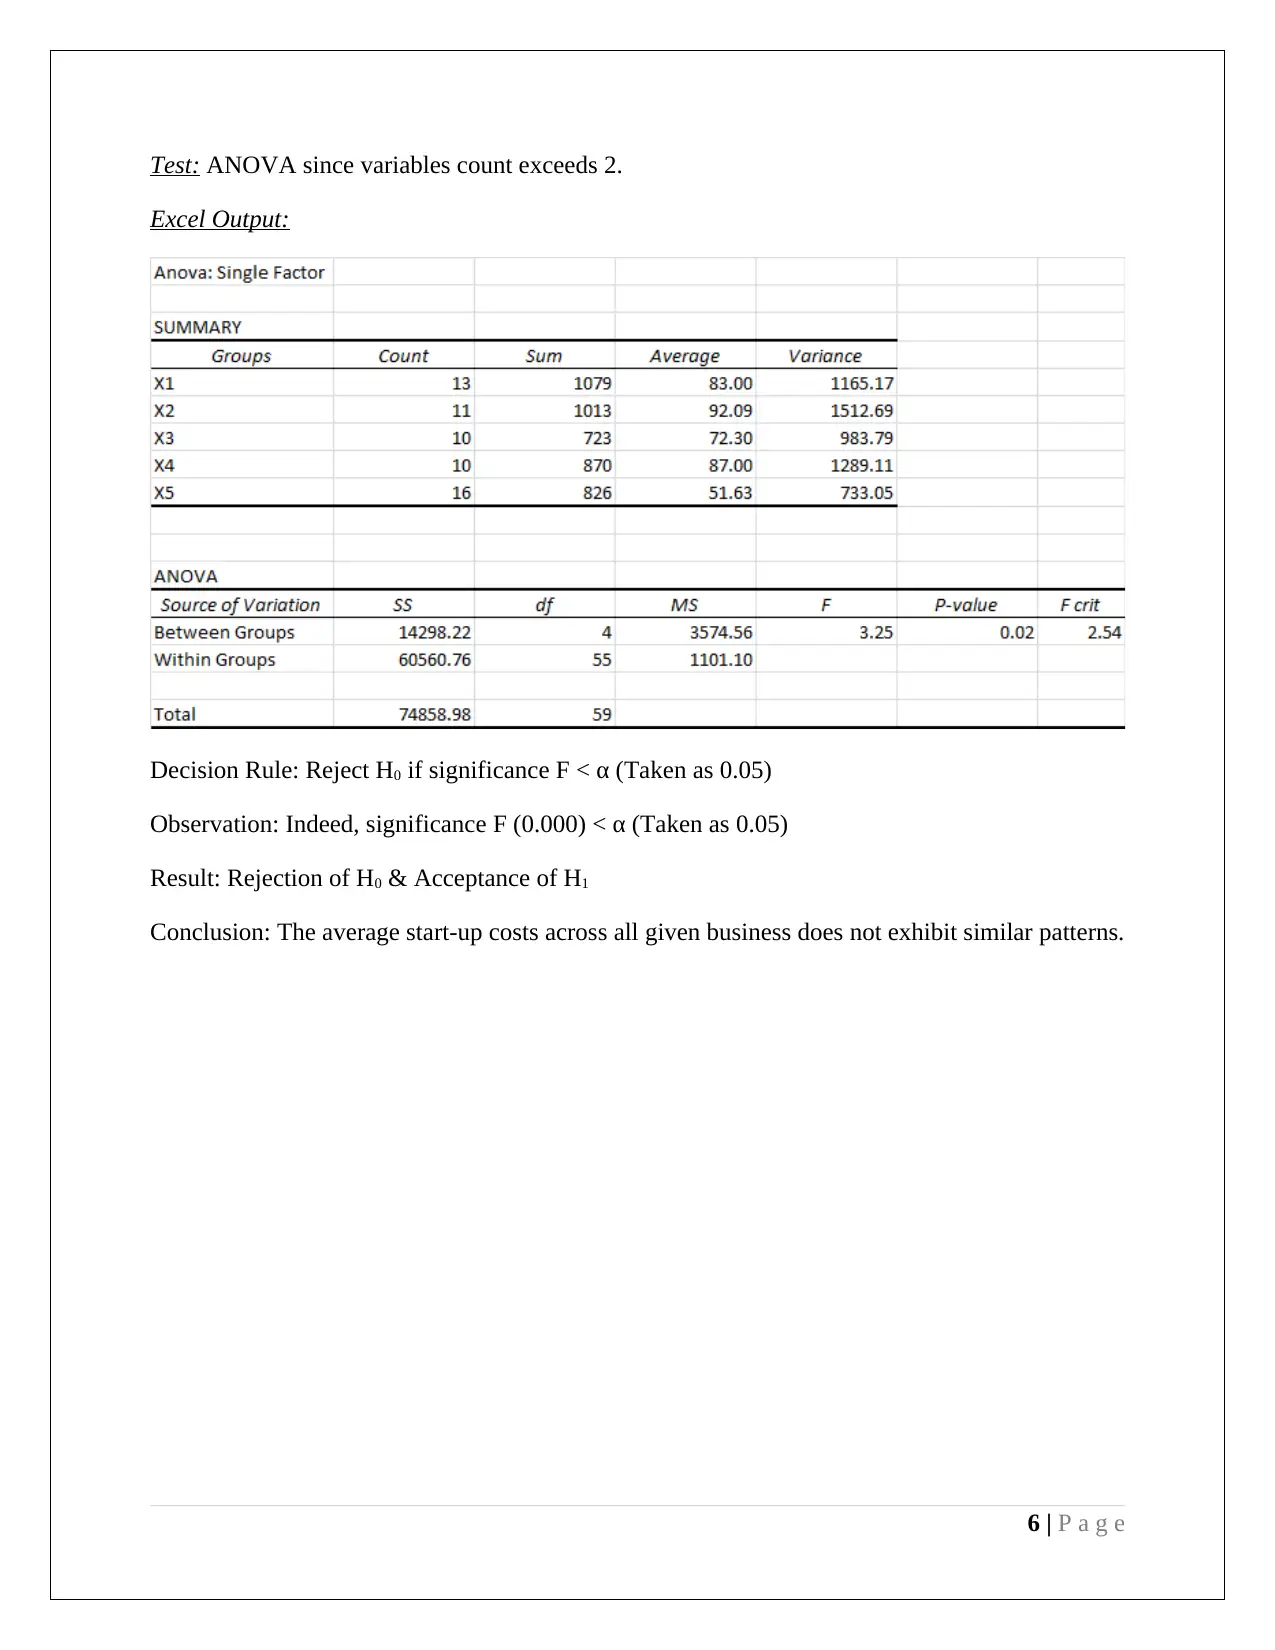
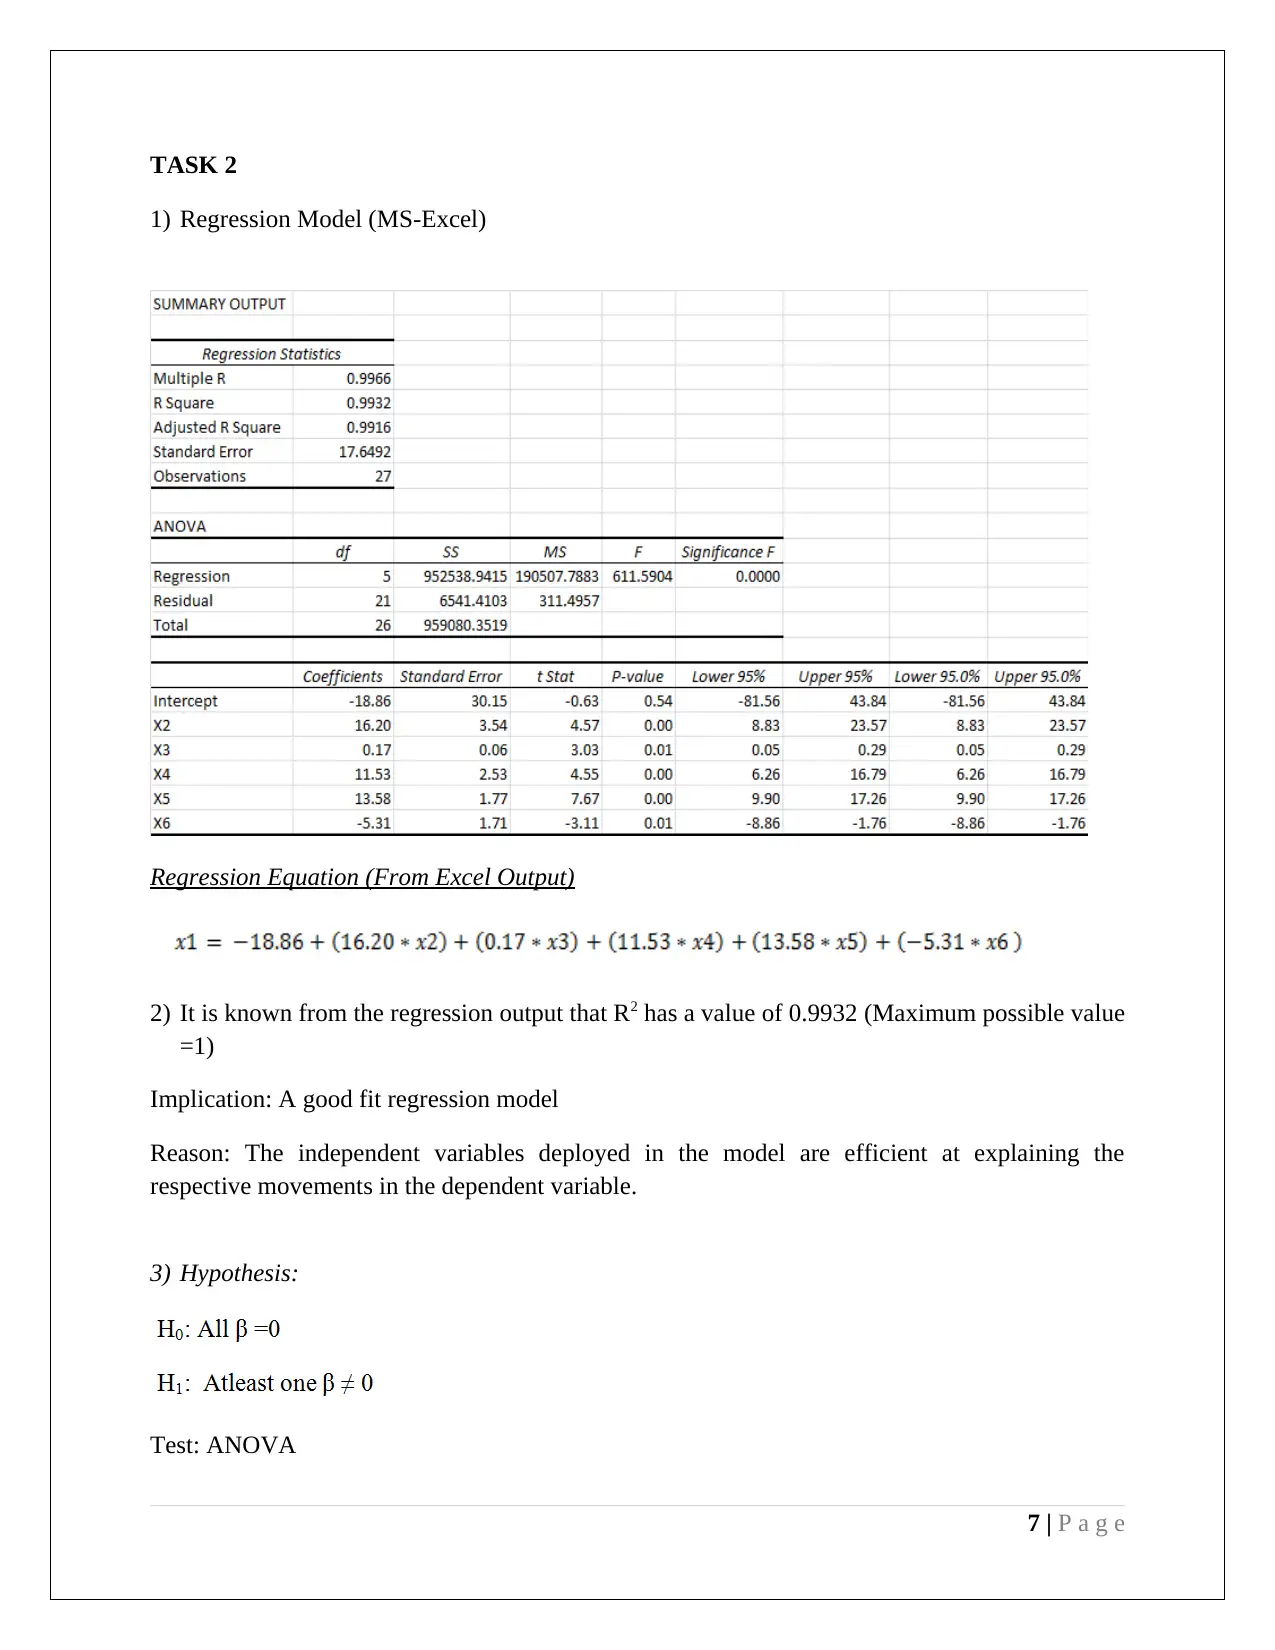
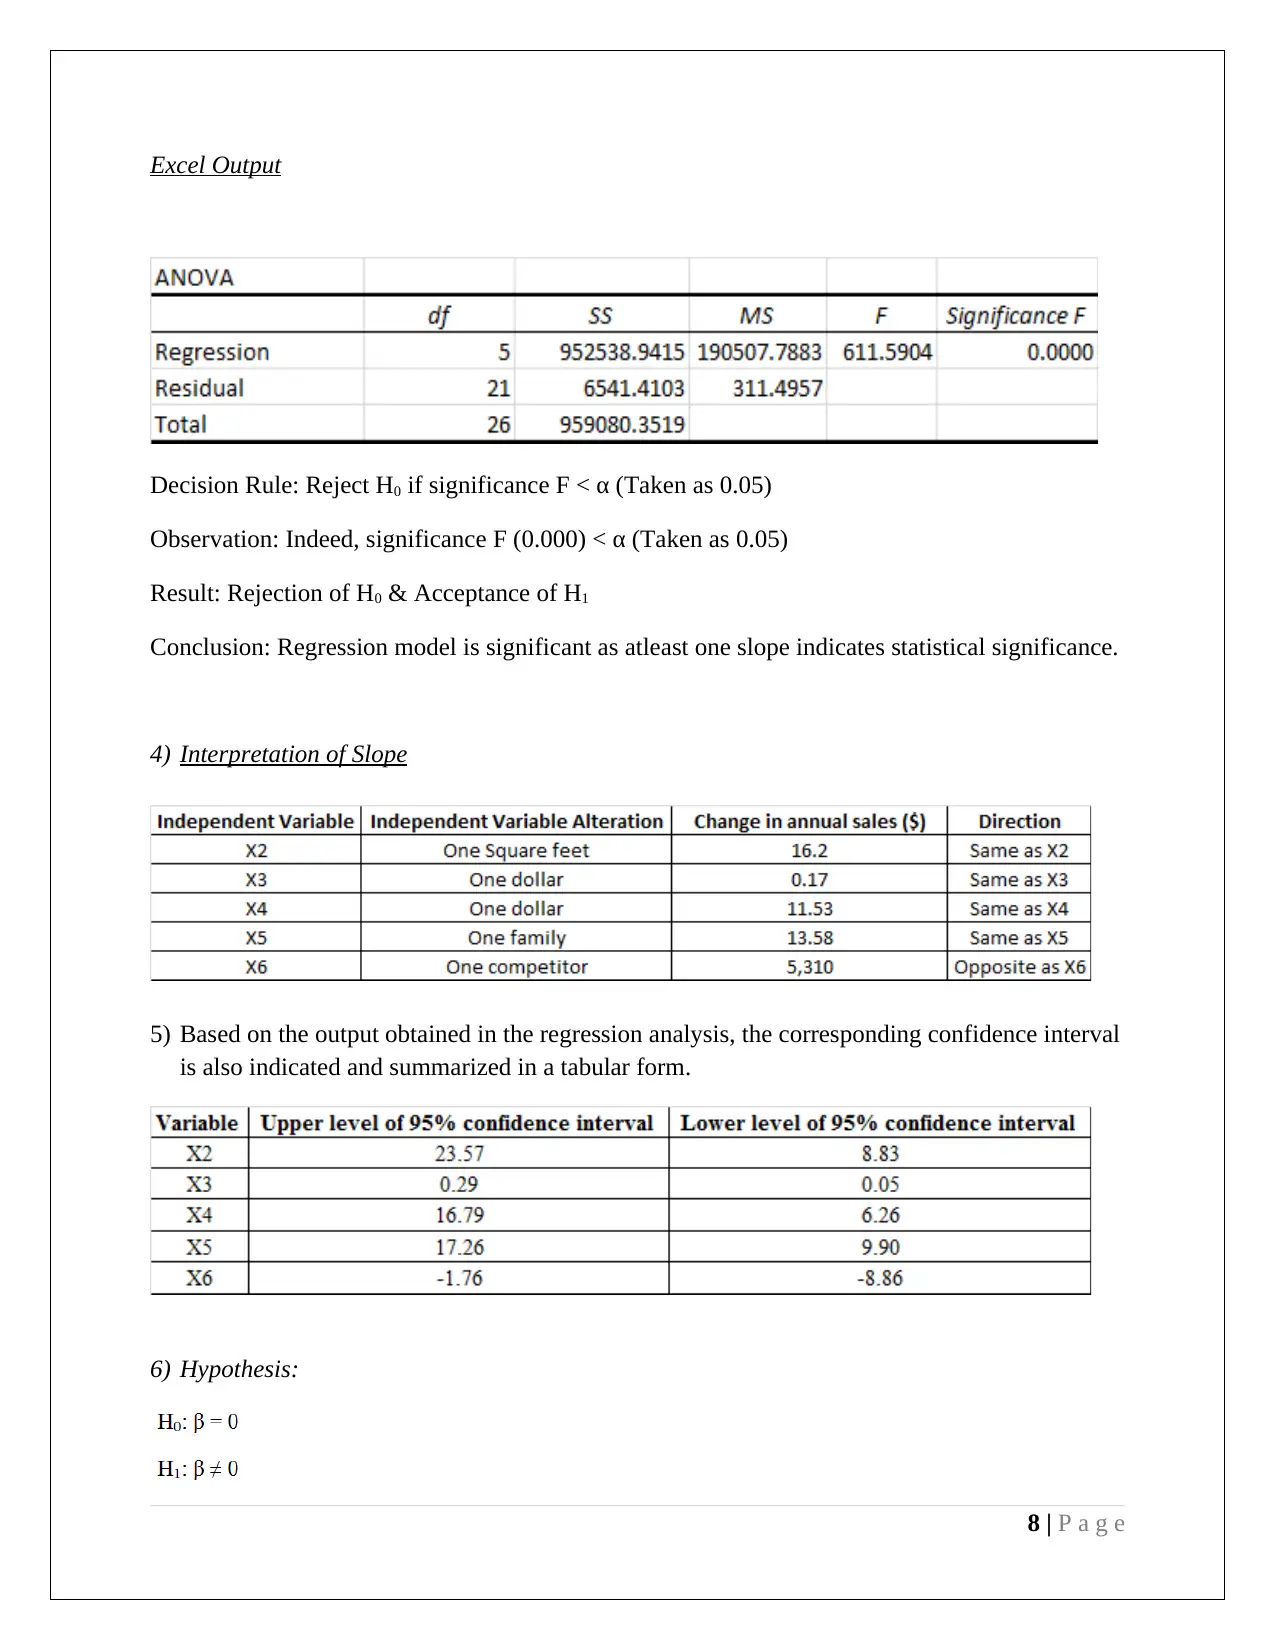
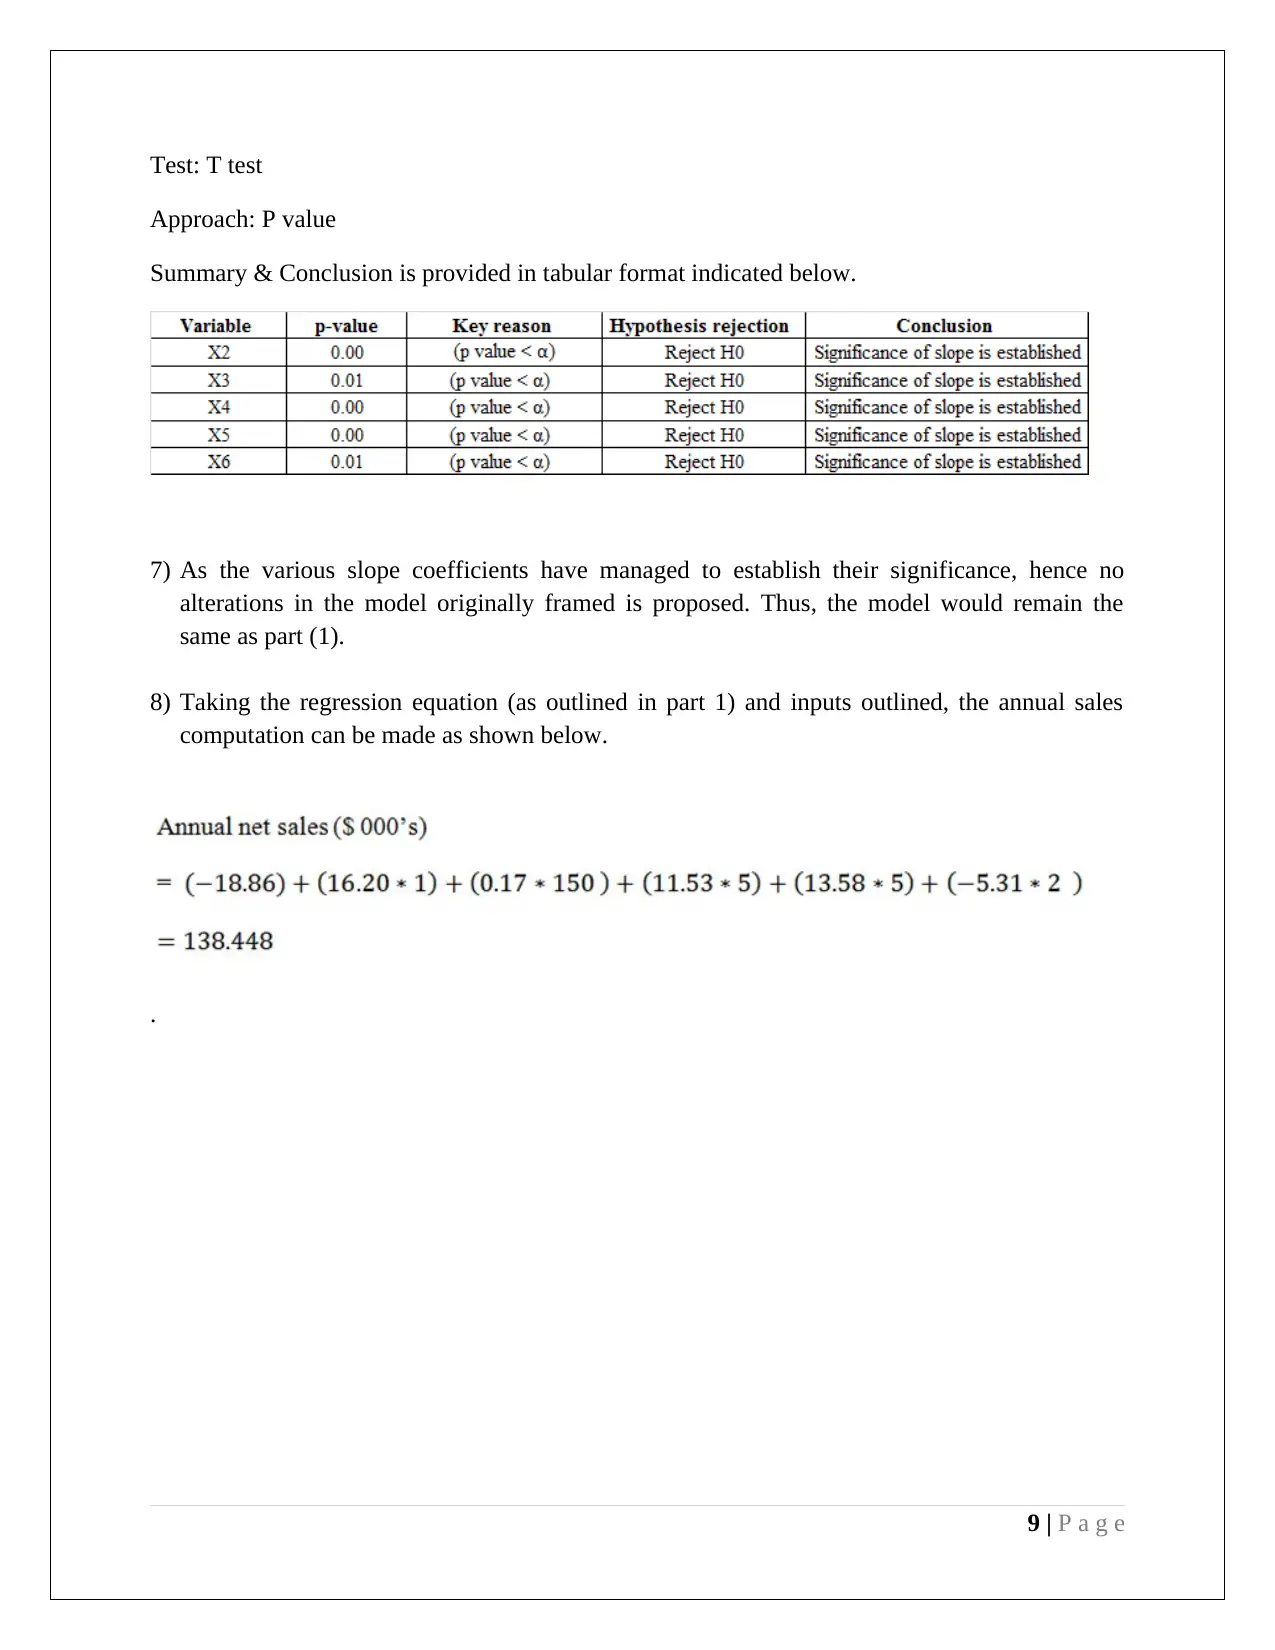
This report presents a statistical analysis of business startup costs, utilizing regression analysis and hypothesis testing. The assignment begins by examining the distribution of startup costs, noting their non-normal distribution and the implications for different business types. It then formulates and tests hypotheses using ANOVA to determine the significance of cost variations. A regression model is developed to further analyze the relationship between variables, with the R-squared value and significance of the model being assessed. The report includes an interpretation of the slope coefficients and their confidence intervals, followed by a conclusion regarding the model's overall significance and relevance. The analysis uses Excel to generate the outputs and includes a detailed explanation of the methods and the results obtained. The conclusion highlights the significance of the regression model and the insights gained from the statistical analysis of the data.
Document Page
STATISTICS
Student id
[Pick the date]
tabler-icon-diamond-filled.svg

Paraphrase This Document

Need a fresh take? Get an instant paraphrase of this document with our AI Paraphraser
Document Page
Task 1
1. Requisite table for highlighting the selected descriptive parameters about the given sample
data are outlined below.
2. (a) Frequency Table for Sample Data
1 | P a g e
Document Page
(b) Histograms for Sample Data
2 | P a g e
Document Page
3 | P a g e
tabler-icon-diamond-filled.svg

Paraphrase This Document

Need a fresh take? Get an instant paraphrase of this document with our AI Paraphraser
Document Page
4 | P a g e
Document Page
3. The two key observations are underlined below.
For each business, the start-up costs are non-normally distributed
Reasons: 1) Mean ≠ Median ≠ Mode
2) Skew is present as histograms are not symmetric and have tails.
Sample startup costs for different business seems to vary.
Reasons: 1) Histogram distribution varies for different variables
2) For startup costs lying between $0 and $ 30,000, only pet stores can be opened and
no other business can be opened.
4. Hypothesis
Null Hypothesis: Average startup costs for given business do not exhibit any variation of
statistical significance.
Alternative Hypothesis: Average startup costs for given business does exhibit any variation of
statistical significance as atleast for one business, there is significant deviation
5 | P a g e
Document Page
Test: ANOVA since variables count exceeds 2.
Excel Output:
Decision Rule: Reject H0 if significance F < α (Taken as 0.05)
Observation: Indeed, significance F (0.000) < α (Taken as 0.05)
Result: Rejection of H0 & Acceptance of H1
Conclusion: The average start-up costs across all given business does not exhibit similar patterns.
6 | P a g e
tabler-icon-diamond-filled.svg

Paraphrase This Document

Need a fresh take? Get an instant paraphrase of this document with our AI Paraphraser
Document Page
TASK 2
1) Regression Model (MS-Excel)
Regression Equation (From Excel Output)
2) It is known from the regression output that R2 has a value of 0.9932 (Maximum possible value
=1)
Implication: A good fit regression model
Reason: The independent variables deployed in the model are efficient at explaining the
respective movements in the dependent variable.
3) Hypothesis:
Test: ANOVA
7 | P a g e
Document Page
Excel Output
Decision Rule: Reject H0 if significance F < α (Taken as 0.05)
Observation: Indeed, significance F (0.000) < α (Taken as 0.05)
Result: Rejection of H0 & Acceptance of H1
Conclusion: Regression model is significant as atleast one slope indicates statistical significance.
4) Interpretation of Slope
5) Based on the output obtained in the regression analysis, the corresponding confidence interval
is also indicated and summarized in a tabular form.
6) Hypothesis:
8 | P a g e
Document Page
Test: T test
Approach: P value
Summary & Conclusion is provided in tabular format indicated below.
7) As the various slope coefficients have managed to establish their significance, hence no
alterations in the model originally framed is proposed. Thus, the model would remain the
same as part (1).
8) Taking the regression equation (as outlined in part 1) and inputs outlined, the annual sales
computation can be made as shown below.
.
9 | P a g e
chevron_up_icon
1 out of 10
circle_padding
hide_on_mobile
zoom_out_icon
[object Object]