Statistics for Business: Data Analysis, Sampling, and Interpretation
VerifiedAdded on 2020/04/01
|10
|1349
|40
Homework Assignment
AI Summary
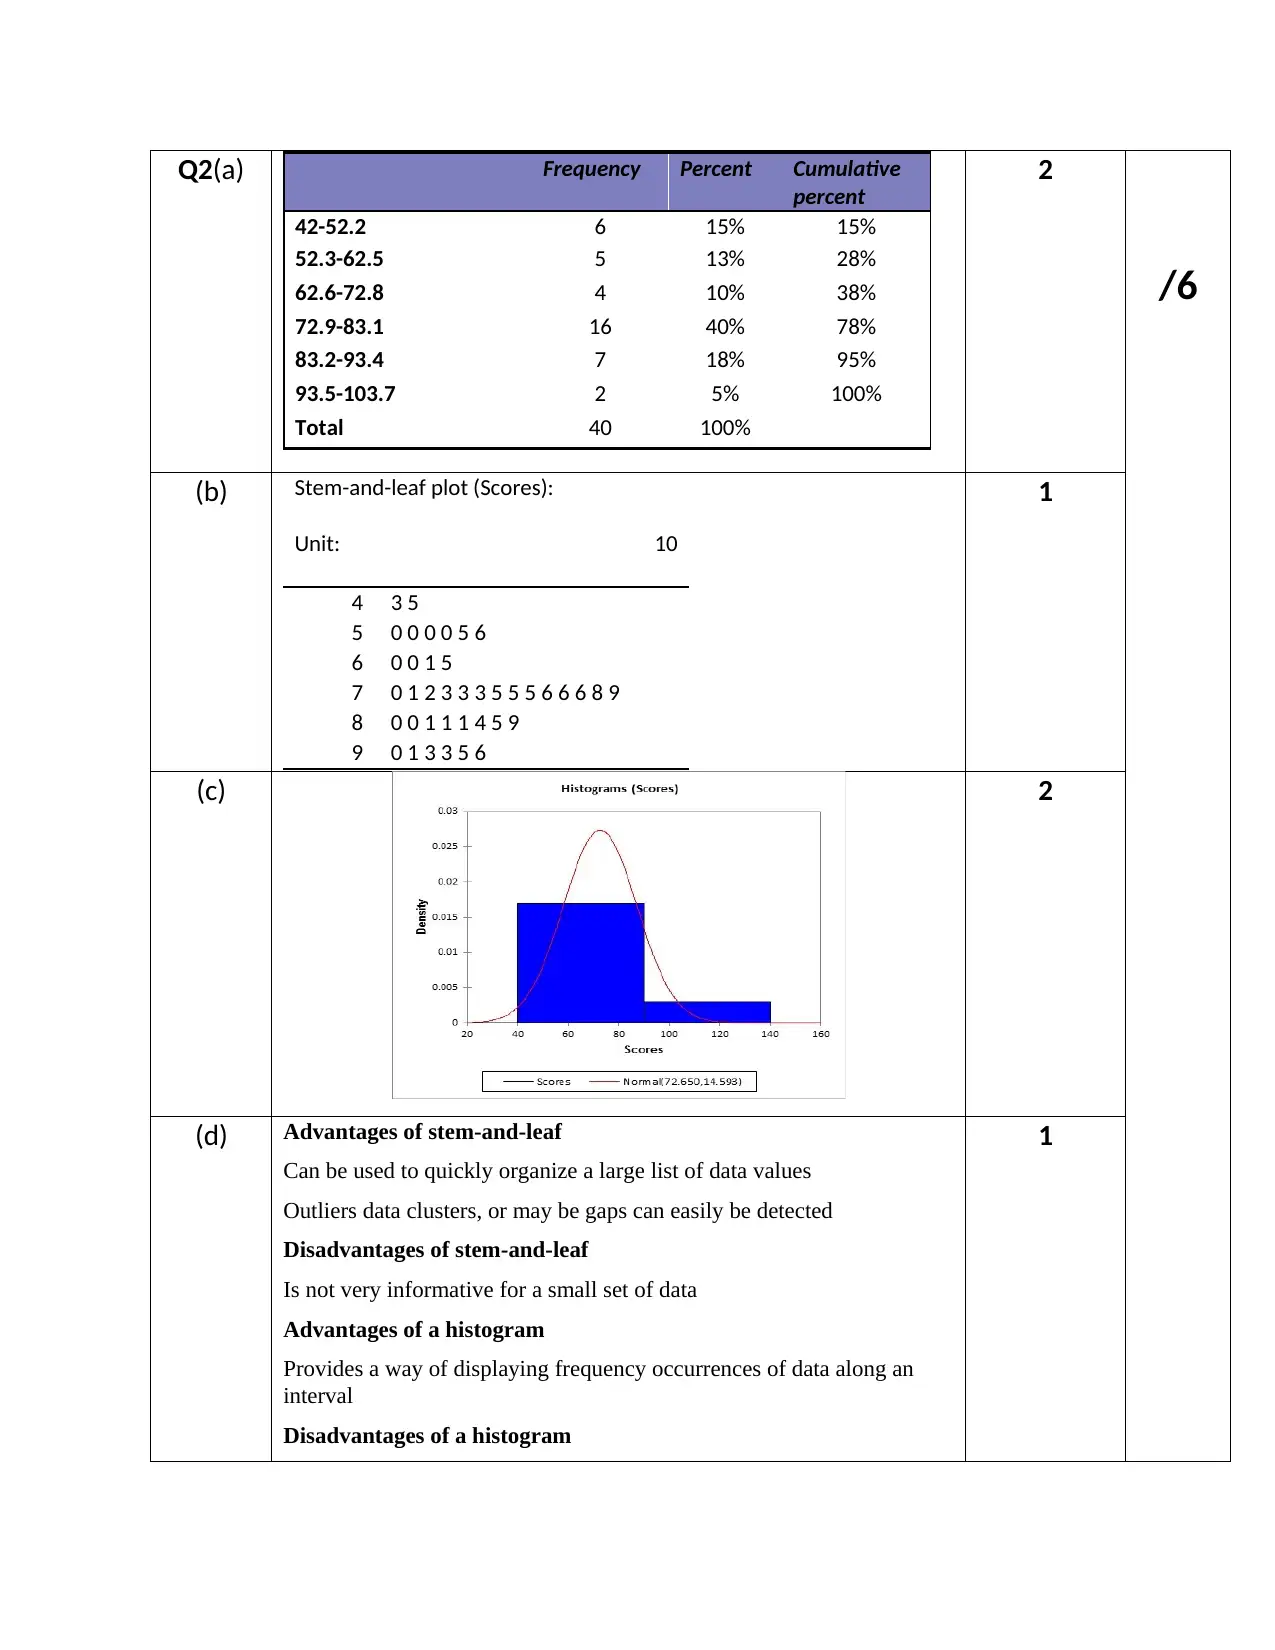
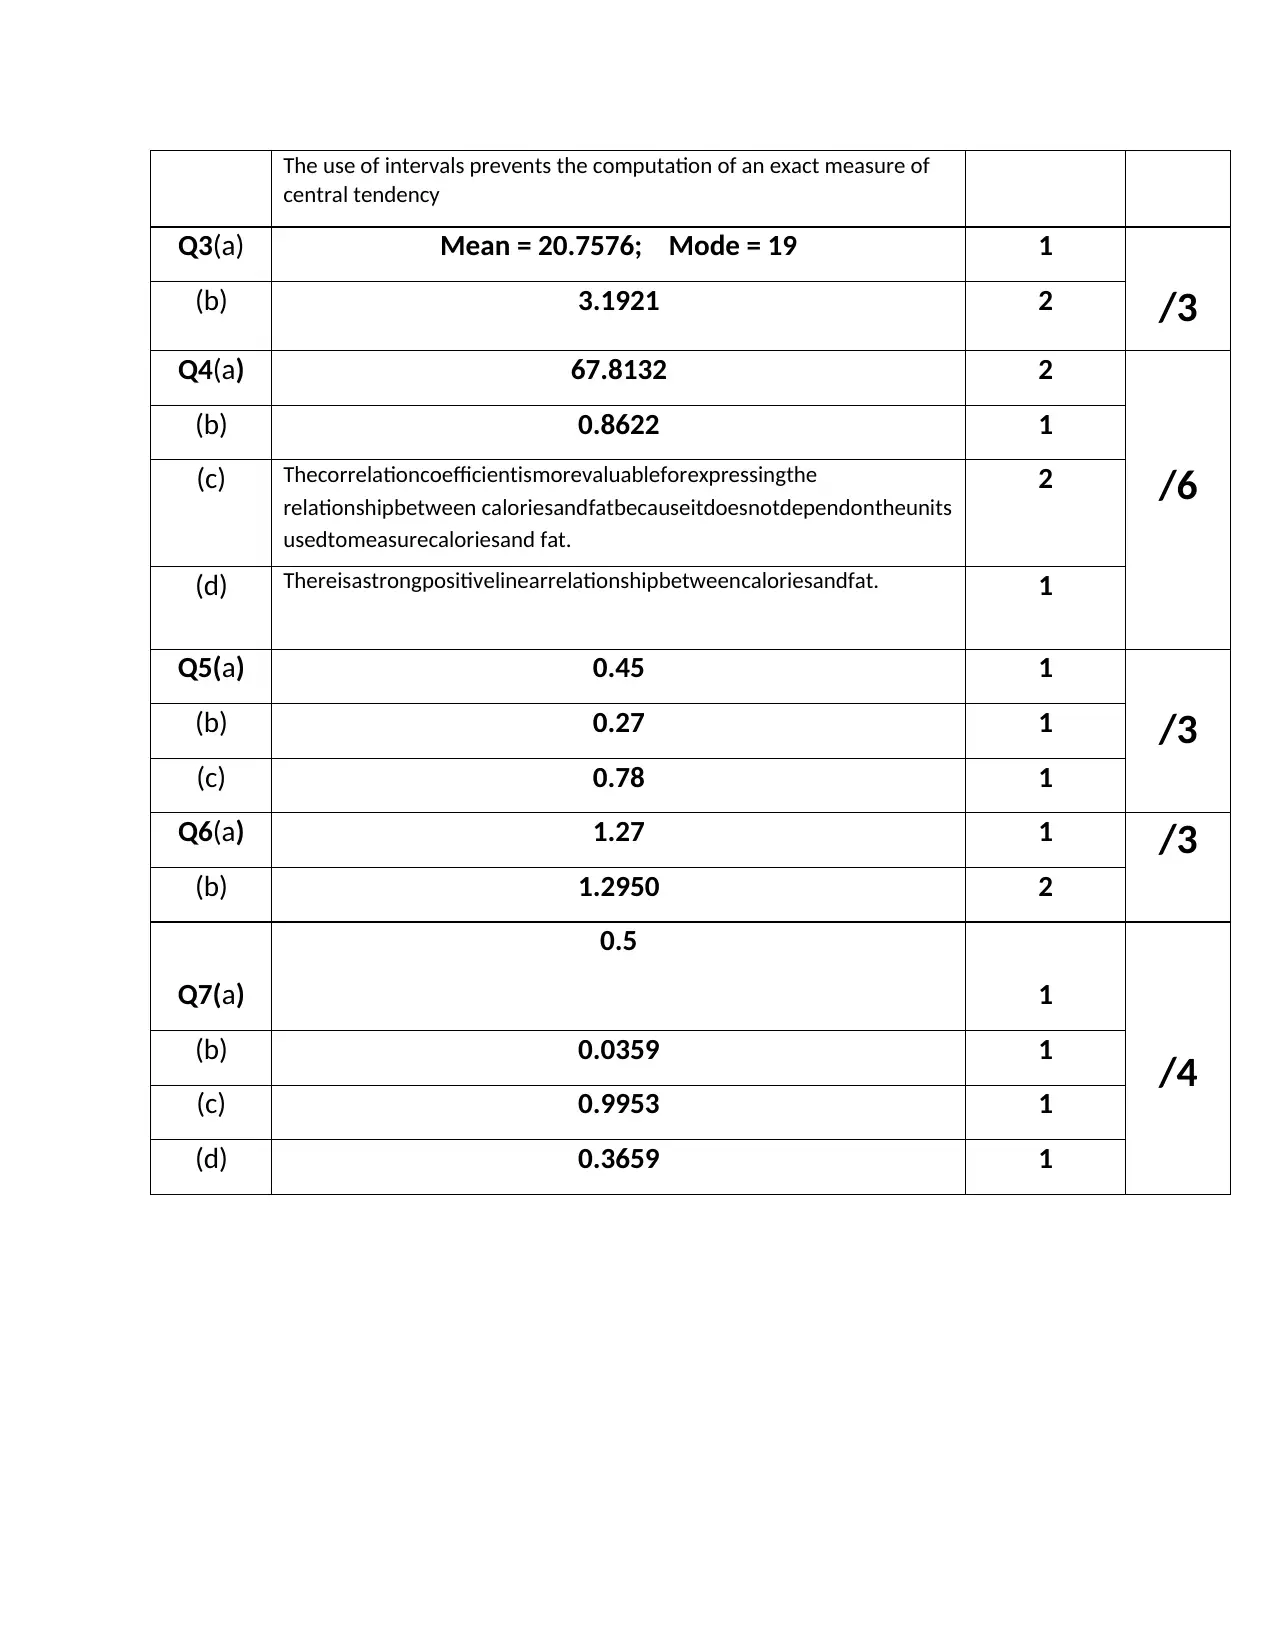
This statistics assignment solution covers a range of topics relevant to business statistics. The assignment begins with questions on data types and sampling methods, including identifying nominal, ordinal, interval, and ratio data, and determining the most appropriate sampling technique. It then moves on to data presentation and analysis, including frequency distributions, stem-and-leaf plots, and histograms, along with their respective advantages and disadvantages. Further questions involve calculating measures of central tendency like mode and mean, as well as exploring the relationship between variables using correlation coefficients. The assignment also addresses probability calculations and interpretation. The solution includes detailed answers, calculations, and explanations, providing a comprehensive understanding of the statistical concepts involved. This solution is designed to help students understand and solve similar statistical problems.

Statistics for business
Group:
Student Numbers:
Lecturer Name:
Number of pages
Group:
Student Numbers:
Lecturer Name:
Number of pages
Paraphrase This Document
Need a fresh take? Get an instant paraphrase of this document with our AI Paraphraser

Table of Contents
Question 1:..................................................................................................................................................2
(a) Answers to Q1 part (a).................................................................................................................2
(b) Answer to Q1 part (b)..................................................................................................................2
(c) Answer to Q1 part (c)...................................................................................................................2
Question 2...................................................................................................................................................3
(a) Answer to Q2 part (a)..................................................................................................................3
(b) Answer to Q2 part (b)..................................................................................................................3
(c) Answer to Q2 part (c)...................................................................................................................3
(d) Answer to Q2 part (d)..................................................................................................................4
Question 3...................................................................................................................................................4
(a) Answer to Q3 part (a)..................................................................................................................4
(b) Answer to Q3 part (b)..................................................................................................................4
Question 4...................................................................................................................................................5
(a) Answer to Q4 part (a)..................................................................................................................5
(b) Answer to Q4 part (b)..................................................................................................................5
(c) Answer to Q4 part (c)...................................................................................................................5
(d) Answer to Q4 part (d)..................................................................................................................5
Question 5...................................................................................................................................................5
(a) Answer to Q5 part (a)..................................................................................................................5
(b) Answer to Q5 part (b)..................................................................................................................6
(c) Answer to Q5 part (c)...................................................................................................................6
Question 6...................................................................................................................................................6
(a) Answer to Q6 part (a)..................................................................................................................6
(b) Answer to Q6 part (b)..................................................................................................................6
Question 7...................................................................................................................................................6
(a) Answer to Q7 part (a)..................................................................................................................6
(b) Answer to Q7 part (b)..................................................................................................................6
(c) Answer to Q7 part (c)...................................................................................................................7
(d) Answer to Q7 part (d)..................................................................................................................7
Summary Sheet...........................................................................................................................................7

Question 1:
(a) Answers to Q1 part (a)
(i) Sex of the alumnus – Nominal
(ii) Major area of study - Nominal
(iii) Grade-point index – Interval
(iv) Further educational pursuits – Ordinal
(v) Current employment status – Nominal
(vi) Current annual salary - Ratio
(b) Answer to Q1 part (b)
Systematic sampling would be the most ideal sampling method to be employed.
Assuming that we have a record of 2000 alumni and we would like to sample 10% of
them. 10% of 2000 is 200. We would find out the kth value i.e.
Kth value=2000
200 =10
So from the registry, starting say with the second or the first person in the register, we
would count 10 before selecting another person. This will continue until the end when
we shall obtained our sample of 200.
(c)Answer to Q1 part (c)
The most ideal way to determine the income of a person without invading into one’s
privacy is probably to give them a range in which their income falls in. For instance, it
would be ideal to ask…
Where does your current annual salary fall in?
Less than $20,000
$20,000 to $34,999
$35,000 to $49,999
$50,000 to $74,999
$75,000 to $99,999
You're viewing a preview
Unlock full access by subscribing today!

Over $100,000
Question 2
(a) Answer to Q2 part (a)
Frequency Percent Cumulative
percent
42-52.2 6 15% 15%
52.3-62.5 5 13% 28%
62.6-72.8 4 10% 38%
72.9-83.1 16 40% 78%
83.2-93.4 7 18% 95%
93.5-103.7 2 5% 100%
Total 40 100%
(b) Answer to Q2 part (b)
Stem-and-leaf plot (Scores):
Unit: 10
4 3 5
5 0 0 0 0 5 6
6 0 0 1 5
7 0 1 2 3 3 3 5 5 5 6 6 6 8 9
8 0 0 1 1 1 4 5 9
9 0 1 3 3 5 6
(c)Answer to Q2 part (c)
Paraphrase This Document
Need a fresh take? Get an instant paraphrase of this document with our AI Paraphraser

(d) Answer to Q2 part (d)
Advantages of stem-and-leaf
Can be used to quickly organize a large list of data values
Outliers data clusters, or may be gaps can easily be detected
Disadvantages of stem-and-leaf
Is not very informative for a small set of data
Advantages of a histogram
Provides a way of displaying frequency occurrences of data along an interval
Disadvantages of a histogram
The use of intervals prevents the computation of an exact measure of central tendency
Question 3
(a) Answer to Q3 part (a)
16, 17, 17,17,18,18,18,18,19,19,19,19,19,20,20,20,20,20,21,21,
21,21,22,22,22,23,23,23,24,24,24,25,29,30
Mean=16 +17+17+…+25+29+30
33 = 685
33 =20.7576
Mode is 19
(b) Answer to Q3 part (b)

SD= √ ∑ ( xi −x ) 2
n−1
S D= √ ∑ ( xi−x )2
n−1 = √ ( 16−20.7576 )2 +…+ ( 30−20.7576 )2
33−1 = √ 326.0606
32 = √10.1894=3.1921
Question 4
(a) Answer to Q4 part (a)
COV ( X , Y ) =∑ ( Xi −X ) ( Y i−Y )
n−1 =1288.5
19
COV ( X , Y )=67.8132
(b) Answer to Q4 part (b)
r =COV ( X ,Y )
SX SY
= 67.8132
3.22178∗24.41284 =0.862182
Total Fat, g Calories
Total Fat, g 1
Calories 0.862182 1
(c)Answer to Q4 part (c)
Thecorrelationcoefficientismorevaluableforexpressingtherelationshipbetween caloriesandfat
becauseitdoesnotdependontheunitsusedtomeasurecaloriesand fat.
(d) Answer to Q4 part (d)
Thereisastrongpositivelinearrelationshipbetweencaloriesandfat.
Question 5
(a) Answer to Q5 part (a)
P ( X ) = 45
100 =0.45
You're viewing a preview
Unlock full access by subscribing today!

(b) Answer to Q5 part (b)
P ( X )=
45
100∗60
100 =0.45∗0.60=0.27
(c)Answer to Q5 part (c)
P ( X=6∨X =9 )= 45
100 + 60
100 − 27
100 = 78
100 =0.78
Question 6
(a) Answer to Q6 part (a)
E ( X ) =∑
i=1
n
xi pi
E ( X ) =∑
i=1
n
xi pi= ( 0∗0.32 ) + ( 1∗0.35 ) +…+ ( 6∗0.01 )=1.27
(b) Answer to Q6 part (b)
SD ( X )= √∑
i=1
n
xi
2 pi− ( E ( X ) )2
∑
i=1
n
xi
2 pi=∑
i=1
n
xi pi= ( 02∗0.32 ) + ( 12∗0.35 ) +…+ ( 62∗0.01 )=3.29
SD ( X ) = √ ∑
i=1
n
xi
2 pi− ( E ( X ) )
2= √ 3.29−1.272= √ 1.6771=1.2950
Question 7
(a) Answer to Q7 part (a)
Z=78−78
5 =0
P(Z> 0)=0.5
(b) Answer to Q7 part (b)
Z= 87−78
5 =1.8
P(Z> 1.8)=0.0359
(c)Answer to Q7 part (c)
Z= 91−78
5 =2.6
Paraphrase This Document
Need a fresh take? Get an instant paraphrase of this document with our AI Paraphraser

P( Z< 2.6)=0.9953
(d) Answer to Q7 part (d)
Z=70−78
5 =−1. 6
Z=77−78
5 =−0.2
P(−1.6< Z <−0.2)
P ( Z ←1.6 ) =0.054 8
P ( Z ←0.2 )=0.4207
P (−1.6< Z<−0.2 )=0.4207−0.0548=0.365 9
Summary Sheet
Q. Final Answer/page ref Marks Marks
Q1(a)(i) Nominal
3
/5
(ii) Nominal
(iii) Interval
(iv) Ordinal
(v) Nominal
(vi) Ratio
1(b) Systematic sampling would be the most ideal sampling method to be
employed. Assuming that we have a record of 2000 alumni and we
would like to sample 10% of them. 10% of 2000 is 200. We would find
out the kth value i.e.
Kth value=2000
200 =10
So from the registry, starting say with the second or the first person in
the register, we would count 10 before selecting another person. This
will continue until the end when we shall obtained our sample of 200.
1
1(c) 1

Q2(a) Frequency Percent Cumulative
percent
42-52.2 6 15% 15%
52.3-62.5 5 13% 28%
62.6-72.8 4 10% 38%
72.9-83.1 16 40% 78%
83.2-93.4 7 18% 95%
93.5-103.7 2 5% 100%
Total 40 100%
2
/6
(b) Stem-and-leaf plot (Scores):
Unit: 10
4 3 5
5 0 0 0 0 5 6
6 0 0 1 5
7 0 1 2 3 3 3 5 5 5 6 6 6 8 9
8 0 0 1 1 1 4 5 9
9 0 1 3 3 5 6
1
(c) 2
(d) Advantages of stem-and-leaf
Can be used to quickly organize a large list of data values
Outliers data clusters, or may be gaps can easily be detected
Disadvantages of stem-and-leaf
Is not very informative for a small set of data
Advantages of a histogram
Provides a way of displaying frequency occurrences of data along an
interval
Disadvantages of a histogram
1
You're viewing a preview
Unlock full access by subscribing today!

The use of intervals prevents the computation of an exact measure of
central tendency
Q3(a) Mean = 20.7576; Mode = 19 1
/3(b) 3.1921 2
Q4(a) 67.8132 2
/6
(b) 0.8622 1
(c) Thecorrelationcoefficientismorevaluableforexpressingthe
relationshipbetween caloriesandfatbecauseitdoesnotdependontheunits
usedtomeasurecaloriesand fat.
2
(d) Thereisastrongpositivelinearrelationshipbetweencaloriesandfat. 1
Q5(a) 0.45 1
/3(b) 0.27 1
(c) 0.78 1
Q6(a) 1.27 1 /3
(b) 1.2950 2
Q7(a)
0.5
1
/4
(b) 0.0359 1
(c) 0.9953 1
(d) 0.3659 1
1 out of 10
Related Documents

Your All-in-One AI-Powered Toolkit for Academic Success.
+13062052269
info@desklib.com
Available 24*7 on WhatsApp / Email
Unlock your academic potential
© 2024 | Zucol Services PVT LTD | All rights reserved.