Statistics Assignment: Data Analysis, Interpretation, and Regression

Verified

Added on  2021/05/31

|8
|1033
|94
Homework Assignment
AI Summary
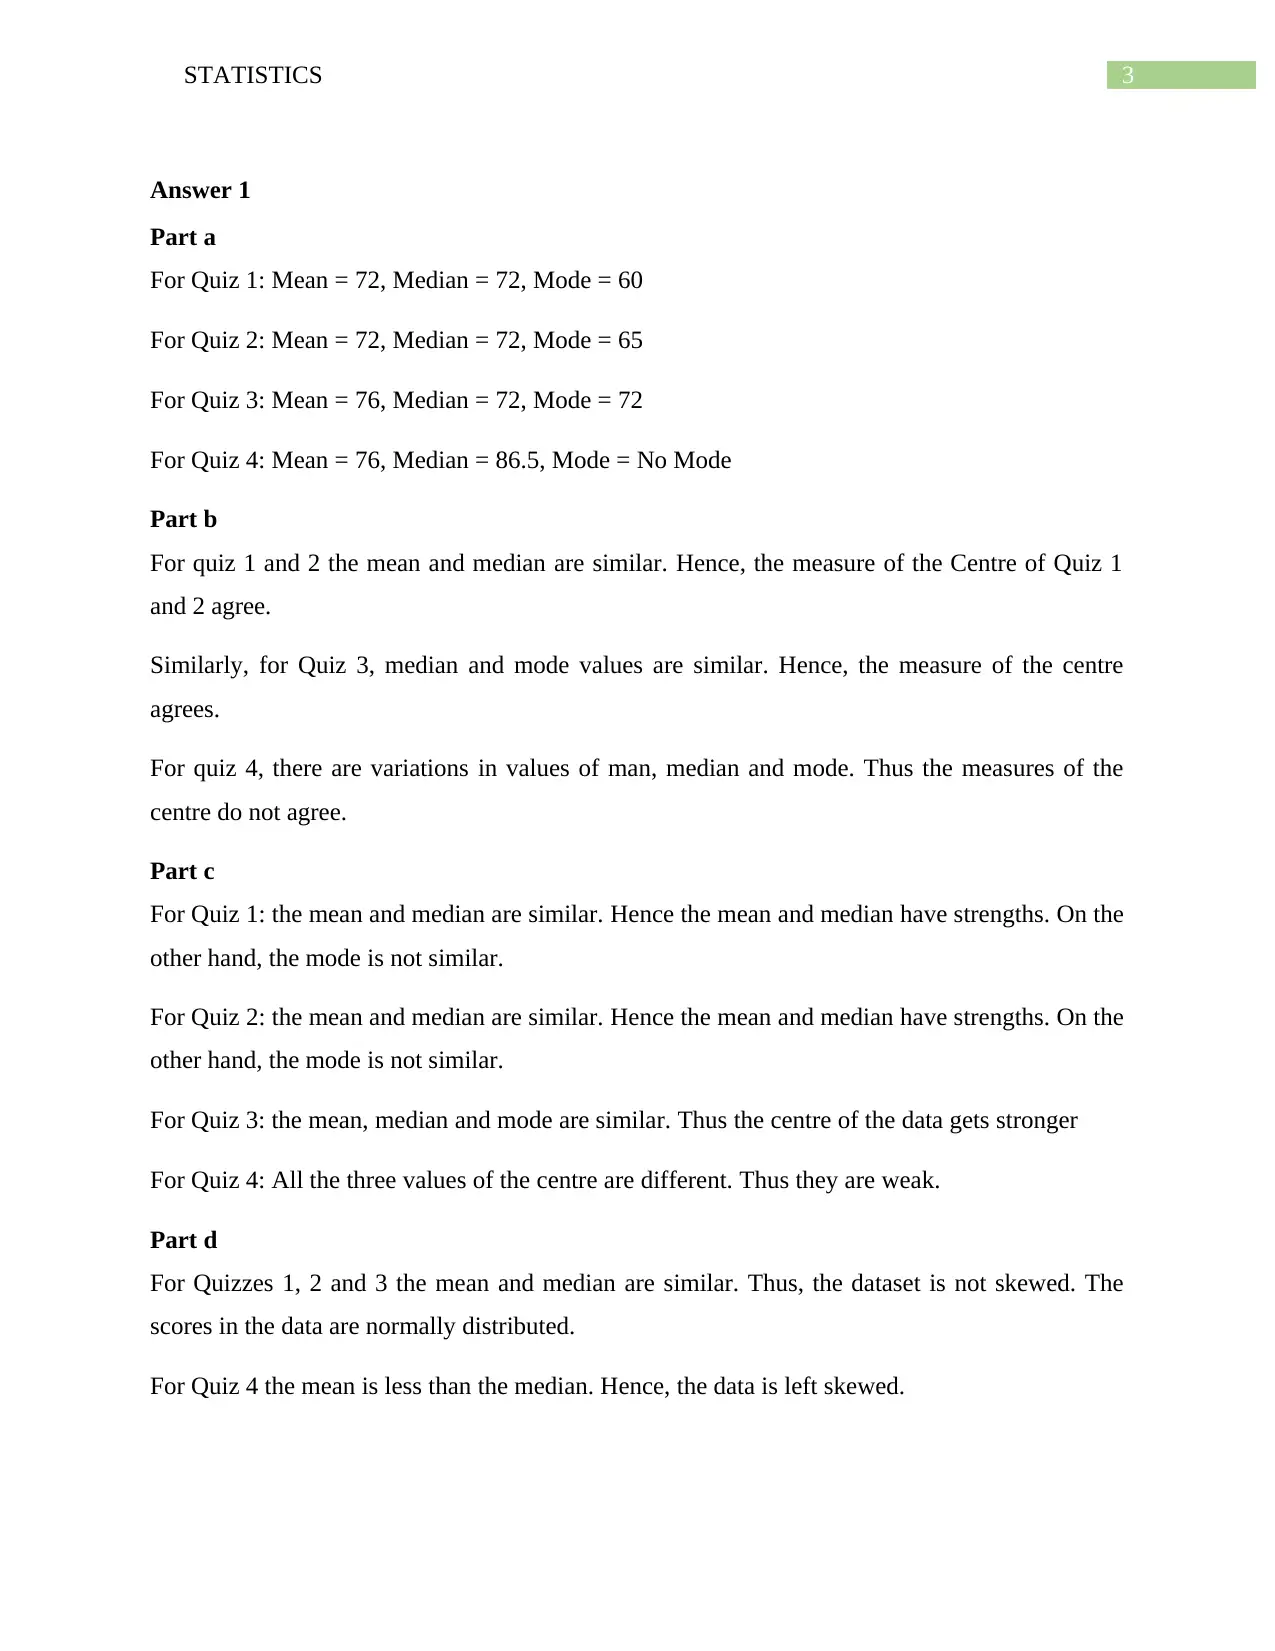
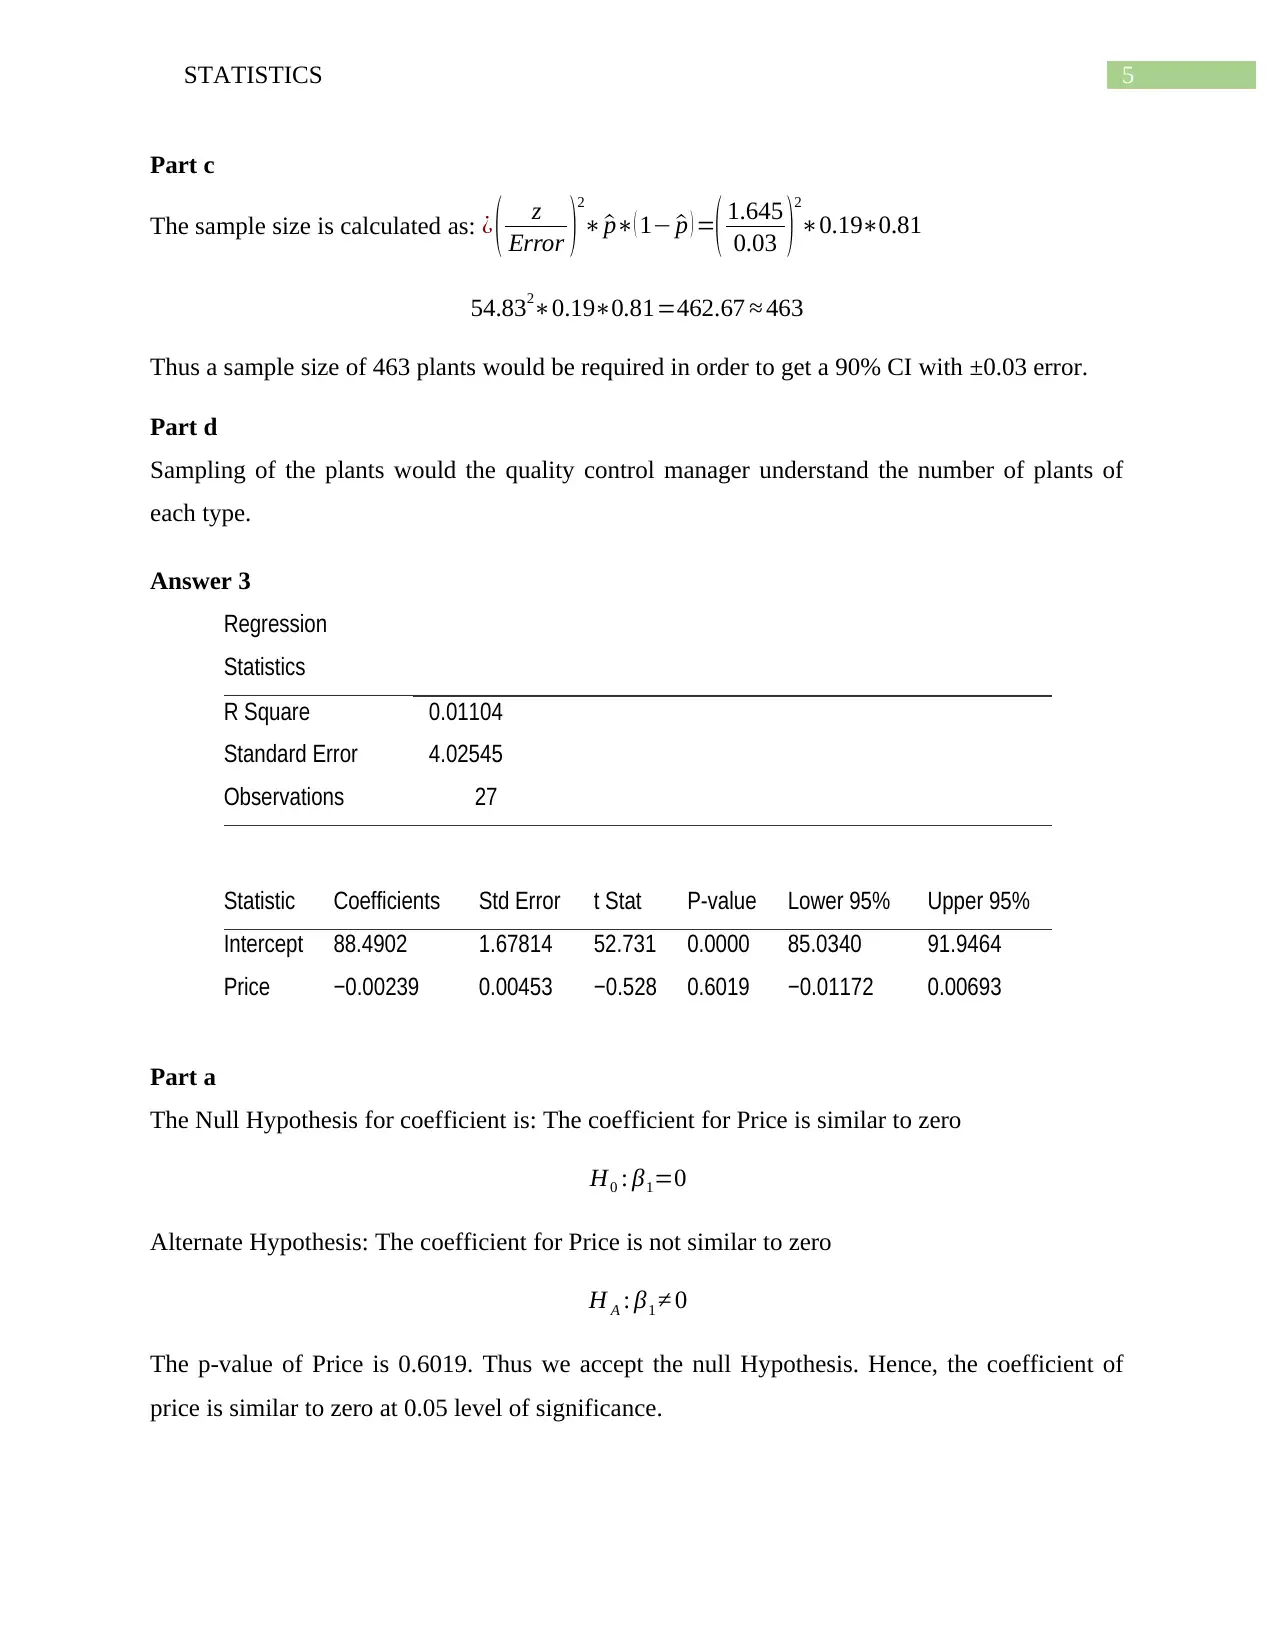
This statistics assignment solution covers various statistical concepts and techniques. It begins with an analysis of measures of central tendency (mean, median, and mode) across multiple quizzes, discussing their agreement and skewness. The solution then explores confidence intervals for proportions, calculating a 90% confidence interval for the proportion of almond plants and determining the required sample size. Next, it delves into regression analysis, interpreting regression statistics, including R-squared, and the coefficient of price to predict sound quality. Finally, the assignment examines hypothesis testing, including null and alternative hypotheses, and the implications of Type I and Type II errors in the context of package delivery times. The assignment provides detailed explanations and calculations to illustrate the application of these statistical methods.
Document Page
Running Head: STATISTICS
Statistics
Name of the Student
Name of the University
Author Note
tabler-icon-diamond-filled.svg

Secure Best Marks with AI Grader

Need help grading? Try our AI Grader for instant feedback on your assignments.
Document Page
1STATISTICS
Table of Contents
Answer 1..........................................................................................................................................3
Part a............................................................................................................................................3
Part b............................................................................................................................................3
Part c............................................................................................................................................3
Part d............................................................................................................................................3
Part e............................................................................................................................................3
Answer 2..........................................................................................................................................4
Part a............................................................................................................................................4
Part b............................................................................................................................................4
Part c............................................................................................................................................4
Part d............................................................................................................................................5
Answer 3..........................................................................................................................................5
Part a............................................................................................................................................5
Part b............................................................................................................................................5
Part c............................................................................................................................................6
Answer 4..........................................................................................................................................6
Part a............................................................................................................................................6
Part b............................................................................................................................................6
Document Page
2STATISTICS
Part c............................................................................................................................................6
Part d............................................................................................................................................6
Part e............................................................................................................................................6
Reference.........................................................................................................................................7
Document Page
3STATISTICS
Answer 1
Part a
For Quiz 1: Mean = 72, Median = 72, Mode = 60
For Quiz 2: Mean = 72, Median = 72, Mode = 65
For Quiz 3: Mean = 76, Median = 72, Mode = 72
For Quiz 4: Mean = 76, Median = 86.5, Mode = No Mode
Part b
For quiz 1 and 2 the mean and median are similar. Hence, the measure of the Centre of Quiz 1
and 2 agree.
Similarly, for Quiz 3, median and mode values are similar. Hence, the measure of the centre
agrees.
For quiz 4, there are variations in values of man, median and mode. Thus the measures of the
centre do not agree.
Part c
For Quiz 1: the mean and median are similar. Hence the mean and median have strengths. On the
other hand, the mode is not similar.
For Quiz 2: the mean and median are similar. Hence the mean and median have strengths. On the
other hand, the mode is not similar.
For Quiz 3: the mean, median and mode are similar. Thus the centre of the data gets stronger
For Quiz 4: All the three values of the centre are different. Thus they are weak.
Part d
For Quizzes 1, 2 and 3 the mean and median are similar. Thus, the dataset is not skewed. The
scores in the data are normally distributed.
For Quiz 4 the mean is less than the median. Hence, the data is left skewed.
tabler-icon-diamond-filled.svg

Secure Best Marks with AI Grader

Need help grading? Try our AI Grader for instant feedback on your assignments.
Document Page
4STATISTICS
Part e
In Quiz 1,2 and 3 the mean and median are similar.
For Quiz 1 the mode is 60 while for Quiz 2 the mode is 65. Thus as compared to quiz 1, the
scores of quiz 2 are better since more number of students are near the centre.
For quiz 3, mean, median and mode are similar. Thus the data is completely normally
distributed.
For quiz 4, all measure of centre is different. Thus, students are poor as well as weak.
Answer 2
Part a
The number of Plants = 100
The number of Almonds plants = 19
Hence the proportion of Almonds plants ^p= 19
100 =0.19
The 90% CI of the proportion of Almond plants is calculated as: ^p ± z
^p (1 ^p )
n
Where ^p = 0.19
z = 1.645
n = 100
Hence, 90% CI ¿ 0.19 ±1.645
0.19( 10.19 )
100 =0.19 ±1.6450.001539
¿ 0.19 ±1.6450.039=¿ 0.19 ±0.064
Thus the lower bound of 90% CI = 0.126
Thus the upper bound of 90% CI = 0.254
Part b
The population contained mixed nuts, hence normality may be assumed.
Document Page
5STATISTICS
Part c
The sample size is calculated as: ¿ ( z
Error )
2
^p( 1 ^p ) =( 1.645
0.03 )
2
0.190.81
54.8320.190.81=462.67 463
Thus a sample size of 463 plants would be required in order to get a 90% CI with ±0.03 error.
Part d
Sampling of the plants would the quality control manager understand the number of plants of
each type.
Answer 3
Regression
Statistics
R Square 0.01104
Standard Error 4.02545
Observations 27
Statistic Coefficients Std Error t Stat P-value Lower 95% Upper 95%
Intercept 88.4902 1.67814 52.731 0.0000 85.0340 91.9464
Price −0.00239 0.00453 −0.528 0.6019 −0.01172 0.00693
Part a
The Null Hypothesis for coefficient is: The coefficient for Price is similar to zero
H0 : β1=0
Alternate Hypothesis: The coefficient for Price is not similar to zero
H A : β1 0
The p-value of Price is 0.6019. Thus we accept the null Hypothesis. Hence, the coefficient of
price is similar to zero at 0.05 level of significance.
Document Page
6STATISTICS
Part b
The value of R2 is 0.01104 (Berenson et al., 2012) .
Hence, 1.104% of the variation in sound quality can be predicted from prices of the
speakers.
Part c
The coefficient of Price is -0.00239. Thus for every unit increase in Price the sound
quality decreases by 0.00239 units. Hence, a higher price quality means reduction in sound
quality.
Answer 4
Part a
Null Hypothesis: The average number of days for the arrival of package is 2 days
H0 : μ=2
Alternate Hypothesis: The average number of days for the arrival of package is more than 2 days
H A : μ>2
Part b
This is a type II error (Anderson et al., 2016). We accept the Null hypothesis wrongly. The Null
hypothesis should have been rejected. In such circumstances customers would get their delivery
on an average after 2 days.
Part c
This is type I Error. The claim of the organization of average delivery time being two days or
less has been wrongly rejected. Under such circumstances the organization stands to lose its
trustworthiness.
Part d
The organization would always like to minimize the chances of a Type I Error. Having a Type I
Error, harms the reputation of the organization.
tabler-icon-diamond-filled.svg

Paraphrase This Document

Need a fresh take? Get an instant paraphrase of this document with our AI Paraphraser
Document Page
7STATISTICS
Part e
The consumer would always like to minimize the chances of a Type II Error. Having a Type II
Error, creates a false alarm that the customer would get the delivery late.
chevron_up_icon
1 out of 8
circle_padding
hide_on_mobile
zoom_out_icon
[object Object]