School of Mathematics Statistics and Computing: Statistics Assignment

Verified

Added on  2022/10/13

|14
|2015
|473
Homework Assignment
AI Summary
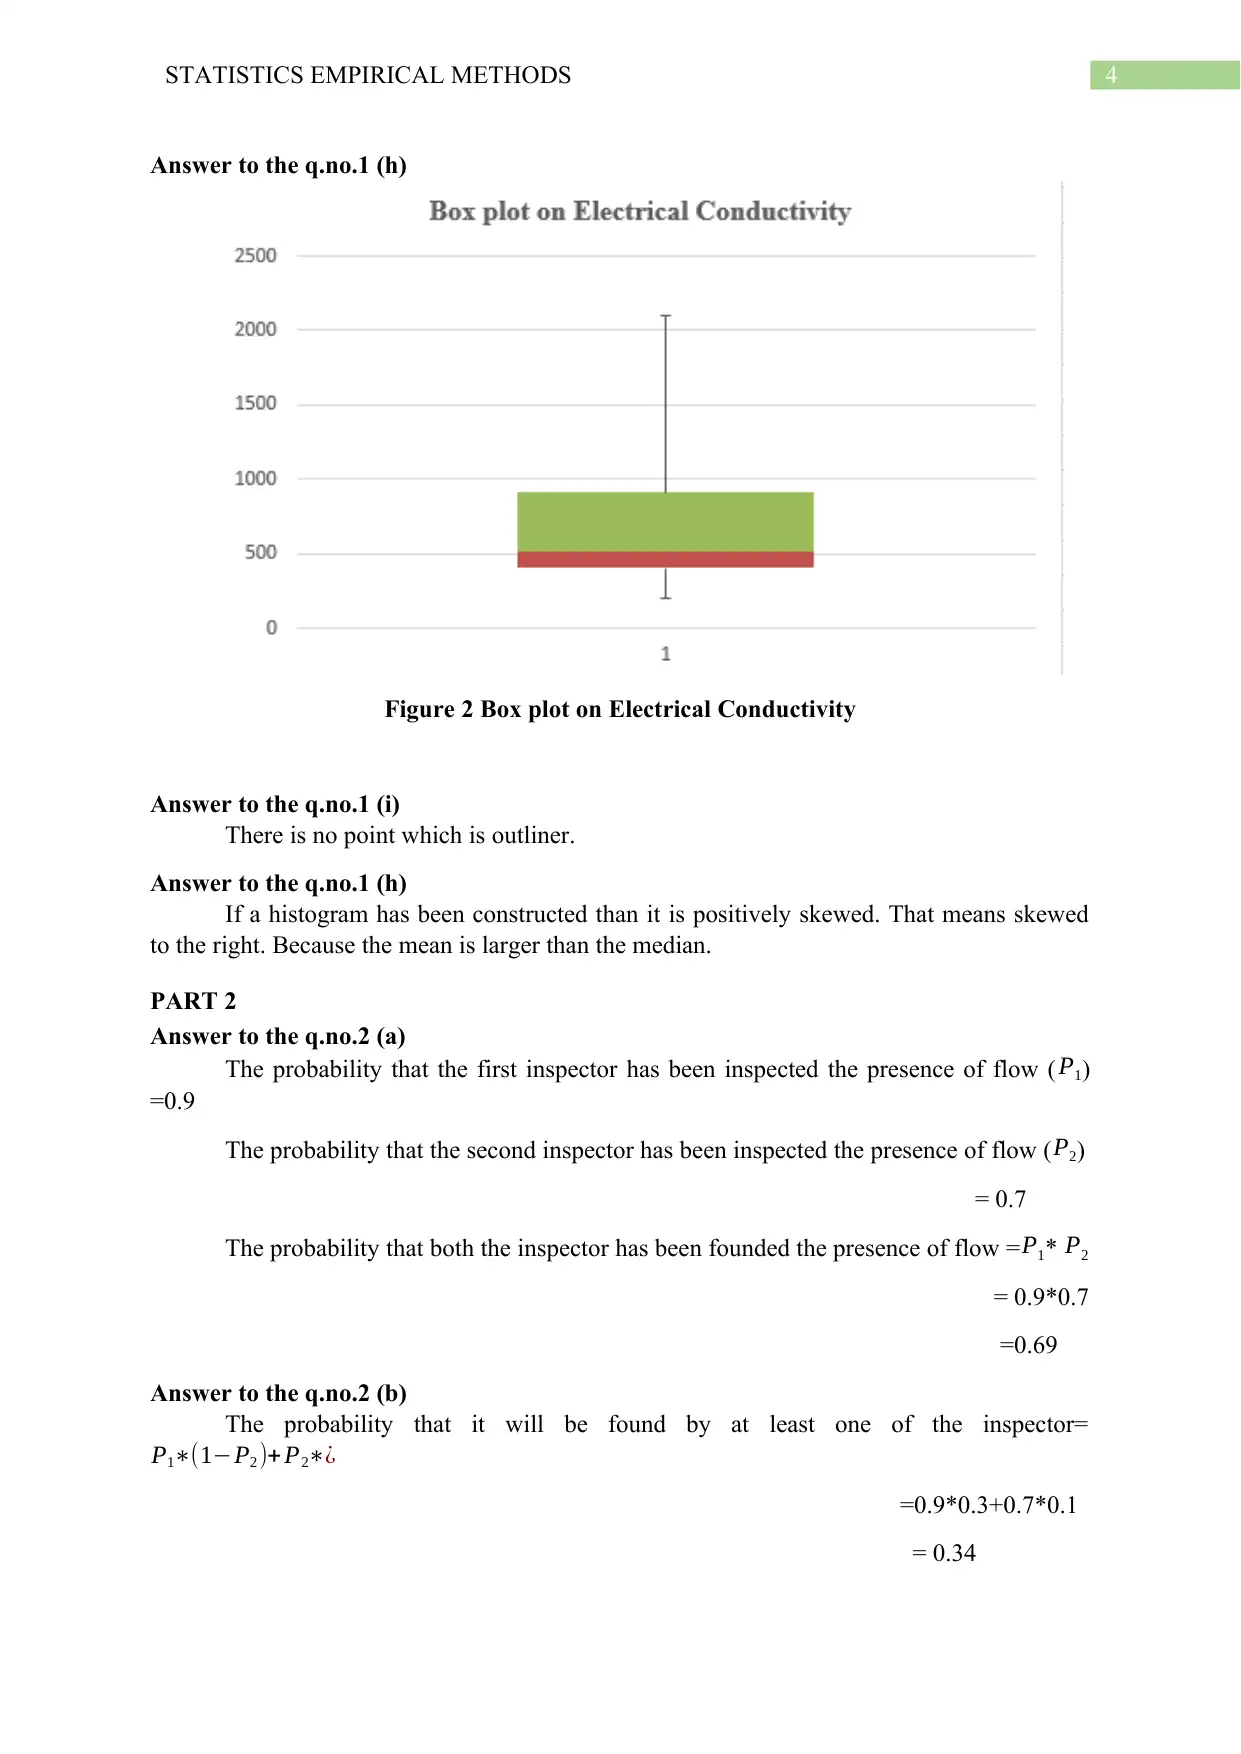
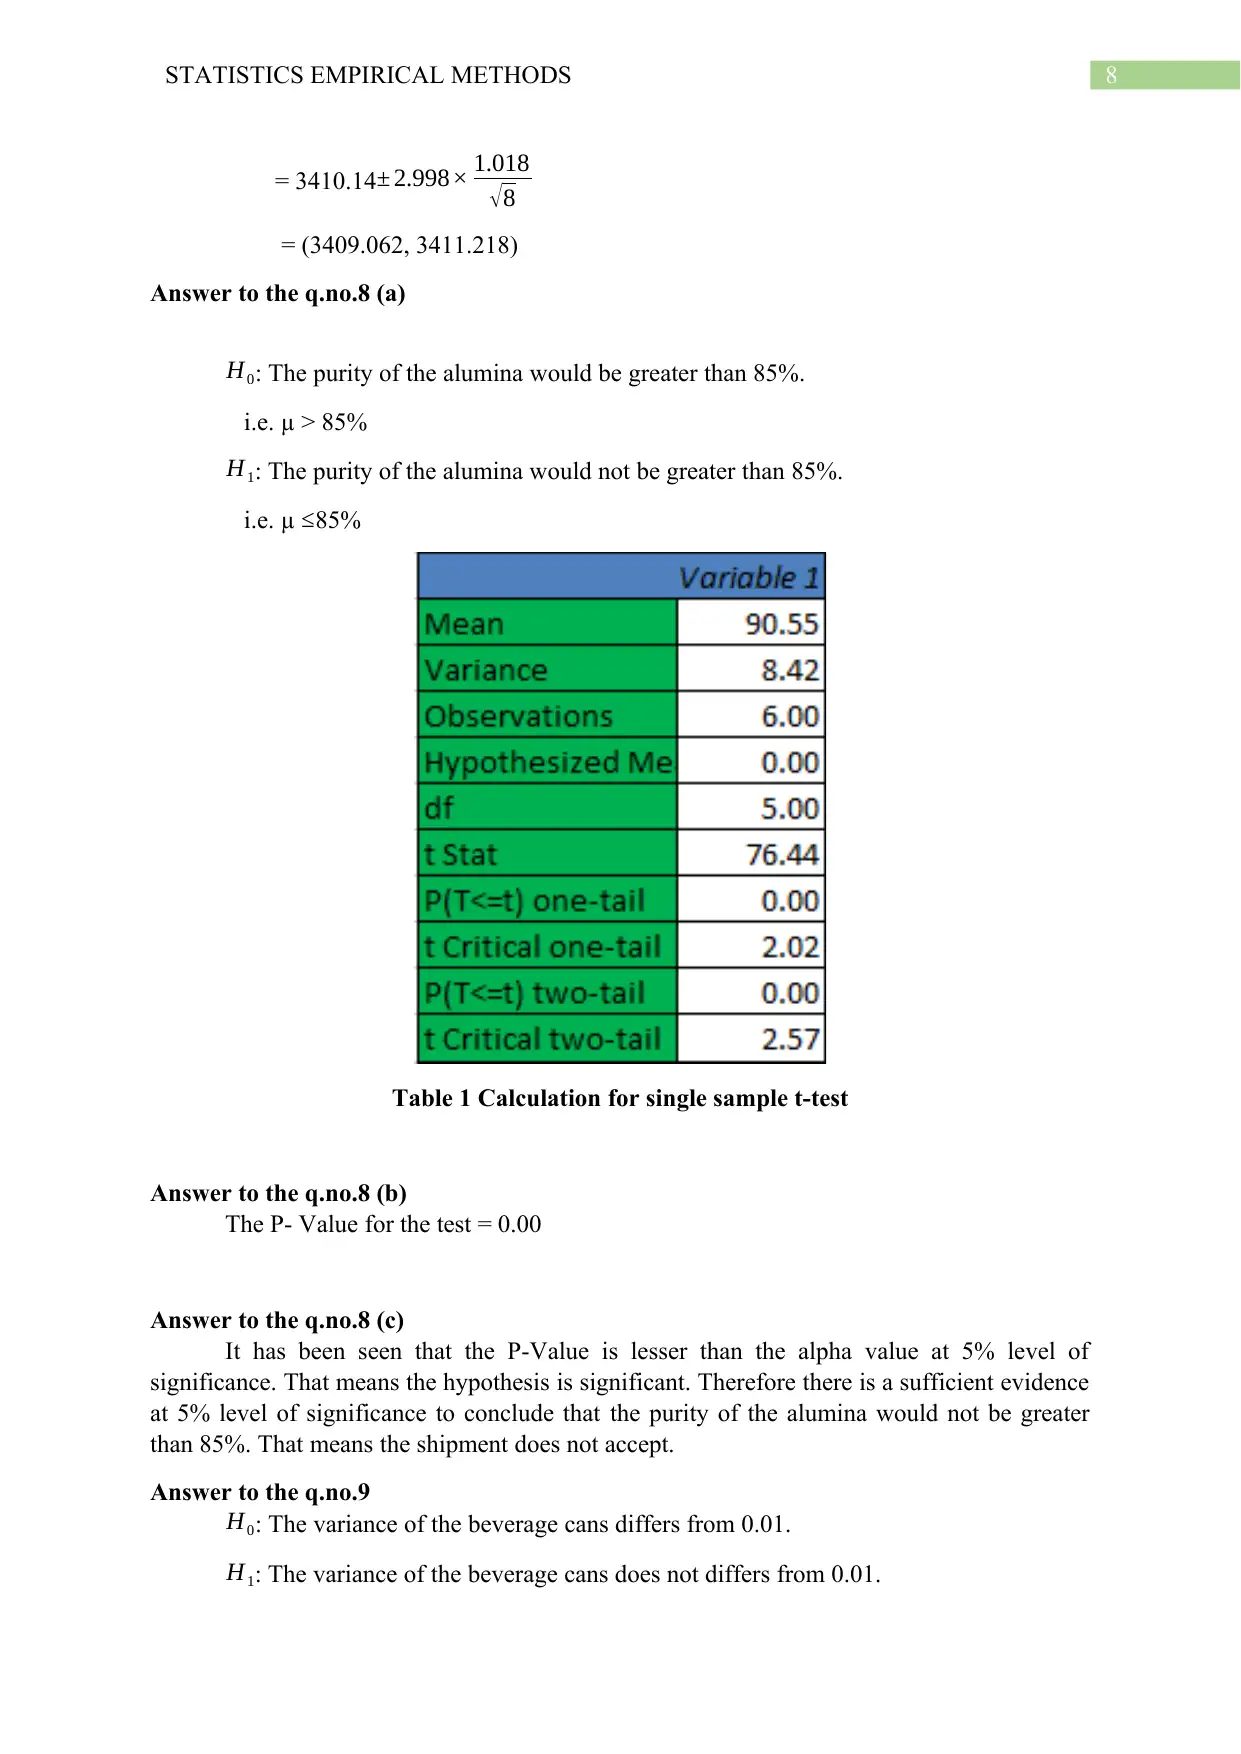
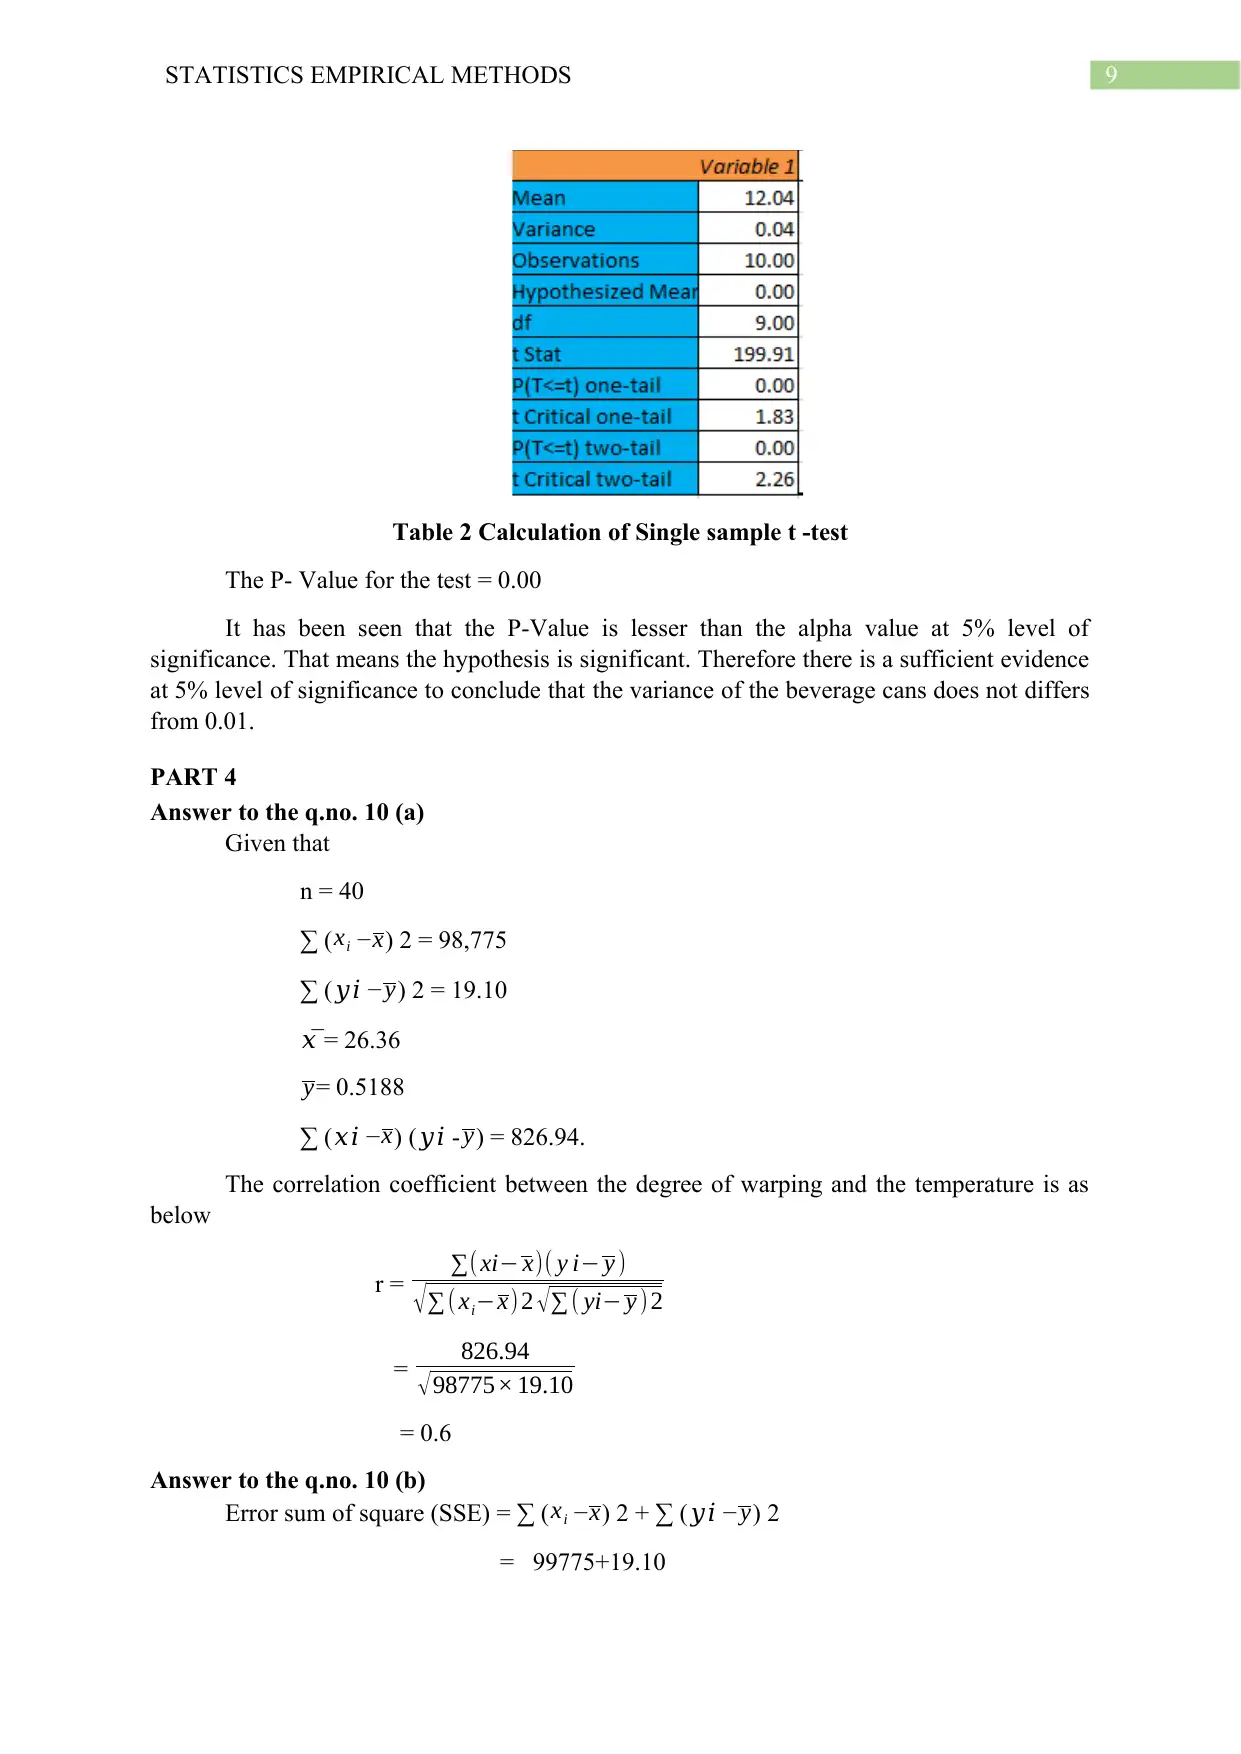
This document presents a complete solution to a statistics assignment, addressing various statistical concepts and methods. The assignment is divided into four parts, covering descriptive statistics, probability and probability distributions, hypothesis testing, and regression analysis with control charts. Part 1 focuses on descriptive statistics, including calculating mean, standard deviation, median, quartiles, and constructing dot plots and box plots. Part 2 explores probability concepts and discrete probability distributions, such as binomial and Poisson distributions, and continuous distributions like the normal distribution. Part 3 delves into confidence intervals and hypothesis testing, including single-sample t-tests. Finally, Part 4 covers correlation, regression analysis, and control charts, including calculating correlation coefficients, least-squares lines, and constructing X-bar, R, and S charts. The solution provides step-by-step calculations and interpretations for each problem, demonstrating a thorough understanding of statistical principles and their application in practical scenarios.
Document Page
Running Head: STATISTICS EMPIRICAL METHODS
Statistics Empirical Methods
Name of the Students:
Name of the University:
Author Note:
tabler-icon-diamond-filled.svg

Paraphrase This Document

Need a fresh take? Get an instant paraphrase of this document with our AI Paraphraser
Document Page
1STATISTICS EMPIRICAL METHODS
Table of Contents
PART 1.......................................................................................................................................2
Answer to the q.no.1 (a).........................................................................................................2
Answer to the q.no.1 (b).........................................................................................................2
Answer to the q.no.1 (c).........................................................................................................2
Answer to the q.no.1 (d).........................................................................................................2
Answer to the q.no.1 (e).........................................................................................................2
Answer to the q.no.1 (f).........................................................................................................2
Answer to the q.no.1 (g).........................................................................................................2
Answer to the q.no.1 (h).........................................................................................................3
Answer to the q.no.1 (i)..........................................................................................................3
Answer to the q.no.1 (h).........................................................................................................3
PART 2.......................................................................................................................................3
Answer to the q.no.2 (a).........................................................................................................3
Answer to the q.no.2 (b).........................................................................................................3
Answer to the q.no.3 (a).........................................................................................................4
Answer to the q.no.3 (b).........................................................................................................4
Answer to the q.no.3 (c).........................................................................................................4
Answer to the q.no.4 (a).........................................................................................................4
Answer to the q.no.4 (b).........................................................................................................5
Answer to the q.no.5 (a).........................................................................................................5
Answer to the q.no.5 (b).........................................................................................................5
Answer to the q.no.5 (c).........................................................................................................5
Answer to the q.no.6 (a).........................................................................................................5
Answer to the q.no.6 (b).........................................................................................................6
PART 3.......................................................................................................................................6
Answer to the q.no.7 (a).........................................................................................................6
Answer to the q.no.7 (b).........................................................................................................6
Answer to the q.no.8 (a).........................................................................................................6
Answer to the q.no.8 (b).........................................................................................................7
Answer to the q.no.8 (c).........................................................................................................7
Answer to the q.no.9..............................................................................................................7
PART 4.......................................................................................................................................8
Answer to the q.no. 10 (a)......................................................................................................8
Answer to the q.no. 10 (b)......................................................................................................8
Document Page
2STATISTICS EMPIRICAL METHODS
Answer to the q.no. 10 (c)......................................................................................................9
Answer to the q.no. 11 (a)......................................................................................................9
Answer to the q.no. 11 (b)......................................................................................................9
Answer to the q.no. 11 (c)....................................................................................................10
Answer to the q.no. 12.........................................................................................................10
References................................................................................................................................11
Document Page
3STATISTICS EMPIRICAL METHODS
PART 1
Answer to the q.no.1 (a)
The mean of the electrical conductivity for the following data is 740.43
Answer to the q.no.1 (b)
The standard deviation of the electrical conductivity for the following data is 549.84
Answer to the q.no.1 (c)
The median of the electrical conductivity for the following data is 513
Answer to the q.no.1 (d)
Figure 1 Dot plot on Electrical Conductivity
Answer to the q.no.1 (e)
The first quartile ( Q1) of the electrical conductivity for the following data is 404
Answer to the q.no.1 (f)
The third quartile (Q3) of the electrical conductivity for the following data is 914
Answer to the q.no.1 (g)
The inter quartile range of the electrical conductivity for the following data = Q3-Q1
= 510
tabler-icon-diamond-filled.svg

Paraphrase This Document

Need a fresh take? Get an instant paraphrase of this document with our AI Paraphraser
Document Page
4STATISTICS EMPIRICAL METHODS
Answer to the q.no.1 (h)
Figure 2 Box plot on Electrical Conductivity
Answer to the q.no.1 (i)
There is no point which is outliner.
Answer to the q.no.1 (h)
If a histogram has been constructed than it is positively skewed. That means skewed
to the right. Because the mean is larger than the median.
PART 2
Answer to the q.no.2 (a)
The probability that the first inspector has been inspected the presence of flow ( P1)
=0.9
The probability that the second inspector has been inspected the presence of flow ( P2)
= 0.7
The probability that both the inspector has been founded the presence of flow =P1* P2
= 0.9*0.7
=0.69
Answer to the q.no.2 (b)
The probability that it will be found by at least one of the inspector=
P1(1P2 )+ P2¿
=0.9*0.3+0.7*0.1
= 0.34
Document Page
5STATISTICS EMPIRICAL METHODS
Answer to the q.no.3 (a)
Given that
n = 12
p = 0.1
The probability mass function of the binomial distribution is
P (X=x) = C px qn x
x
n x= 0, 1, 2…..n
q = 1- p
The probability that exactly three has been violated is P (X=3) = C (0.1)3¿ ¿
= 220*0.001*0.387
= 0.085
Answer to the q.no.3 (b)
The probability that fewer than three has been violated is as below
P(X< 3) = P(X=0) + P (X=1) + P(X=2)
= (0.9)12 +C (0.1)1¿ ¿+C (0.1)2¿ ¿
= (0.9)12+12*0.1*¿+66*(0.1)2*(0.9)10
= (0.9)10[(0.9)2+1.2*0.9+0.66]
= (0.9)10 × 2.55
Answer to the q.no.3 (c)
The probability that none of them has been violated is P (X=0) = (0.9)12
Answer to the q.no.4 (a)
Given that
n = 1000
p = 0.003
λ= 3
The probability mass function of the Poisson distribution is
P (X=x) = eλ λx
x ! x = 0, 1, 2…...
λ > 0
The probability that exactly two servers has been failed is as below
Document Page
6STATISTICS EMPIRICAL METHODS
P (X=2) = e3 32
2 !
= 9
2 e3
Answer to the q.no.4 (b)
The probability that fewer than 998 servers has been functioned is as below
P(X< 998) = 1- P(X 998 ¿
= 1- P(X= 998) + P(X= 999) + P(X=1000)
= 1- e3 3998
998 ! + e3 3999
999 ! + e3 31000
1000!
= 1- e3 *(3)998[ 1
998 ! + 3
999 !+ 9
1000! ]
= 1- e3(3)998
998 ! [ 1000
999 ]
= 1- e3( 3 ) 9981000
999 !
Answer to the q.no.5 (a)
Given that
n = 10
p = 10
60
= 0.6
λ= 6
The probability that when the number of defective items in the lot is 5 is as below
P(X=5) = - e6 65
5 !
Answer to the q.no.5 (b)
The probability that when the number of defective items in the lot is 10 is as below
P(X=10) = - e6 610
10 !
Answer to the q.no.5 (c)
The probability that when the number of defective items in the lot is 10 is as below
tabler-icon-diamond-filled.svg

Paraphrase This Document

Need a fresh take? Get an instant paraphrase of this document with our AI Paraphraser
Document Page
7STATISTICS EMPIRICAL METHODS
P(X=20) = - e6 620
20 !
Answer to the q.no.6 (a)
Given that
Mean (𝜇) = 1400
Standard deviation (𝜎) = 200
The probability that the bulb will last more than 1800 hours is as below
P (X > 1800) = P (Z > 2)
= 1 – P (Z 2)
= 1 – 0.98
= 0.02
Answer to the q.no.6 (b)
The probability that the lifetime of a bulb is between 1350 and 1550 hours is as below
P (1350 < X < 1550) = P (-0.25 < Z < 0.75)
= 0.37
PART 3
Answer to the q.no.7 (a)
Given that
n = 8
Sample mean ( X ) = 3410.14
Standard deviation (σ) = 1.018
Degrees of freedom = 7
The 95% confidence interval for the melting point of tungsten is as below
X ± t × σ
n
= 3410.14 ± 2.365× 1.018
8
= (3409.29, 3410.99)
Answer to the q.no.7 (b)
The 98% confidence interval for the melting point of tungsten is as below
X ± t × σ
n
Document Page
8STATISTICS EMPIRICAL METHODS
= 3410.14± 2.998× 1.018
8
= (3409.062, 3411.218)
Answer to the q.no.8 (a)
H0: The purity of the alumina would be greater than 85%.
i.e. μ > 85%
H1: The purity of the alumina would not be greater than 85%.
i.e. μ 85%
Table 1 Calculation for single sample t-test
Answer to the q.no.8 (b)
The P- Value for the test = 0.00
Answer to the q.no.8 (c)
It has been seen that the P-Value is lesser than the alpha value at 5% level of
significance. That means the hypothesis is significant. Therefore there is a sufficient evidence
at 5% level of significance to conclude that the purity of the alumina would not be greater
than 85%. That means the shipment does not accept.
Answer to the q.no.9
H0: The variance of the beverage cans differs from 0.01.
H1: The variance of the beverage cans does not differs from 0.01.
Document Page
9STATISTICS EMPIRICAL METHODS
Table 2 Calculation of Single sample t -test
The P- Value for the test = 0.00
It has been seen that the P-Value is lesser than the alpha value at 5% level of
significance. That means the hypothesis is significant. Therefore there is a sufficient evidence
at 5% level of significance to conclude that the variance of the beverage cans does not differs
from 0.01.
PART 4
Answer to the q.no. 10 (a)
Given that
n = 40
∑ ( xi x) 2 = 98,775
∑ (𝑦𝑖 y) 2 = 19.10
𝑥̅ = 26.36
y= 0.5188
∑ (𝑥𝑖 x) (𝑦𝑖 - y) = 826.94.
The correlation coefficient between the degree of warping and the temperature is as
below
r = ( xi x)( y i y )
( xix) 2 ( yi y ) 2
= 826.94
98775× 19.10
= 0.6
Answer to the q.no. 10 (b)
Error sum of square (SSE) = ∑ ( xi x) 2 + ∑ (𝑦𝑖 y) 2
= 99775+19.10
tabler-icon-diamond-filled.svg

Paraphrase This Document

Need a fresh take? Get an instant paraphrase of this document with our AI Paraphraser
Document Page
10STATISTICS EMPIRICAL METHODS
SSE = 99794.1
R2 = 0.36
Now
R2 = 1- SSE
TSS
Or 0.36 = 1- 99794.1
TSS
Or 0.64 TSS = 99794.1
Or TSS = 155928.28
Total sum of square (TSS) = Error sum of square (SEE) + Regression sum of square (RSS)
Or 155928.28 = 99794.1+RSS
RSS = 56134.18
Answer to the q.no. 10 (c)
The least-squares line for predicting warping from temperature is as below
Y = a + b*x
Y =a+bX
0.5188= a + 26.36*b
Answer to the q.no. 11 (a)
Given that

i=1
30
xi= 712.5

i=1
30
Ri= 143.7

i=1
30
si= 62.5
The 3σ control limits for the R chart is
R= 4.79
UCL = D4* R
= 2.282* 4.79
= 10.93
Document Page
11STATISTICS EMPIRICAL METHODS
LCL = D3* R
= 0*4.79
= 0
Answer to the q.no. 11 (b)
The 3σ control limits for the S chart is
S= 2.083
UCL = S+3 S
c4
1c2
4
= 2.083+ 3* 2.083
0.921310.848
= 2.083+2.65
= 4.73
LCL = = S-3 S
c4
1c2
4
= 2.083- 3* 2.083
0.921310.848
= 2.083-2.65
= -0.567
Answer to the q.no. 11 (c)
The 3σ control limits for the X chart
UCL (X- bar) = ´X + A2* R
= 0.79+ 0.729* 4.79
= 4.28
LCL (X- bar) = ´X - A2* R
= 0.79- 0.729* 4.79
= -2.7
Answer to the q.no. 12
Given that

i=1
30
pi= 1.64
n = 30
Center line = 0.055
chevron_up_icon
1 out of 14
circle_padding
hide_on_mobile
zoom_out_icon
[object Object]