Statistics Assignment: Covariance, Hypothesis, and Probability
VerifiedAdded on 2022/05/25
|13
|1340
|23
Homework Assignment
AI Summary
This statistics assignment solution covers several key statistical concepts. Question 1 analyzes covariance and correlation, interpreting the relationship between variables and their implications. Question 2 delves into hypothesis testing, examining confidence levels and significance, with practical examples of drug testing scenarios. Question 3 focuses on measures of central tendency (mean, median, and mode), data distribution, and outlier analysis. Question 4 explores probability calculations, including conditional probability and the use of P-values. The assignment provides detailed calculations, tables, and interpretations, supported by references and a bibliography, offering a comprehensive understanding of the statistical principles applied.
Statistics
Subject Title:
Subject Code:
Name:
Student Id:
Student Numbers:
Page 1
Subject Title:
Subject Code:
Name:
Student Id:
Student Numbers:
Page 1
Paraphrase This Document
Need a fresh take? Get an instant paraphrase of this document with our AI Paraphraser
Table of Contents
Question 1........................................................................................................................................4
a....................................................................................................................................................4
b...................................................................................................................................................4
c....................................................................................................................................................5
d...................................................................................................................................................5
Question 2........................................................................................................................................6
a....................................................................................................................................................6
b...................................................................................................................................................6
c....................................................................................................................................................7
d...................................................................................................................................................8
Question 3........................................................................................................................................8
a....................................................................................................................................................8
b...................................................................................................................................................9
c....................................................................................................................................................9
d...................................................................................................................................................9
e..................................................................................................................................................10
Question 4......................................................................................................................................10
a..................................................................................................................................................10
b.................................................................................................................................................11
c..................................................................................................................................................11
d.................................................................................................................................................12
e..................................................................................................................................................12
References......................................................................................................................................13
Bibliography..................................................................................................................................14
Page 2
Question 1
a.
x y
5 20
3 23
7 15
9 11
2 27
4 21
6 17
8 14
Mean 5.5 18.5
Xi Yi XY Xi Yi
-0.5 1.5 100 -0.75
-2.5 4.5 69 -11.25
1.5 -3.5 105 -5.25
3.5 -7.5 99 -26.25
-3.5 8.5 54 -29.75
-1.5 2.5 84 -3.75
0.5 -1.5 102 -0.75
2.5 -4.5 112 -11.25
Total 0 0 725 -89
x̅ 5.5
ȳ 18.5
Covariance between x and y (Cov)-12.125
Formula 1(Σ XiYi - nX̅ Ȳ/n-1)
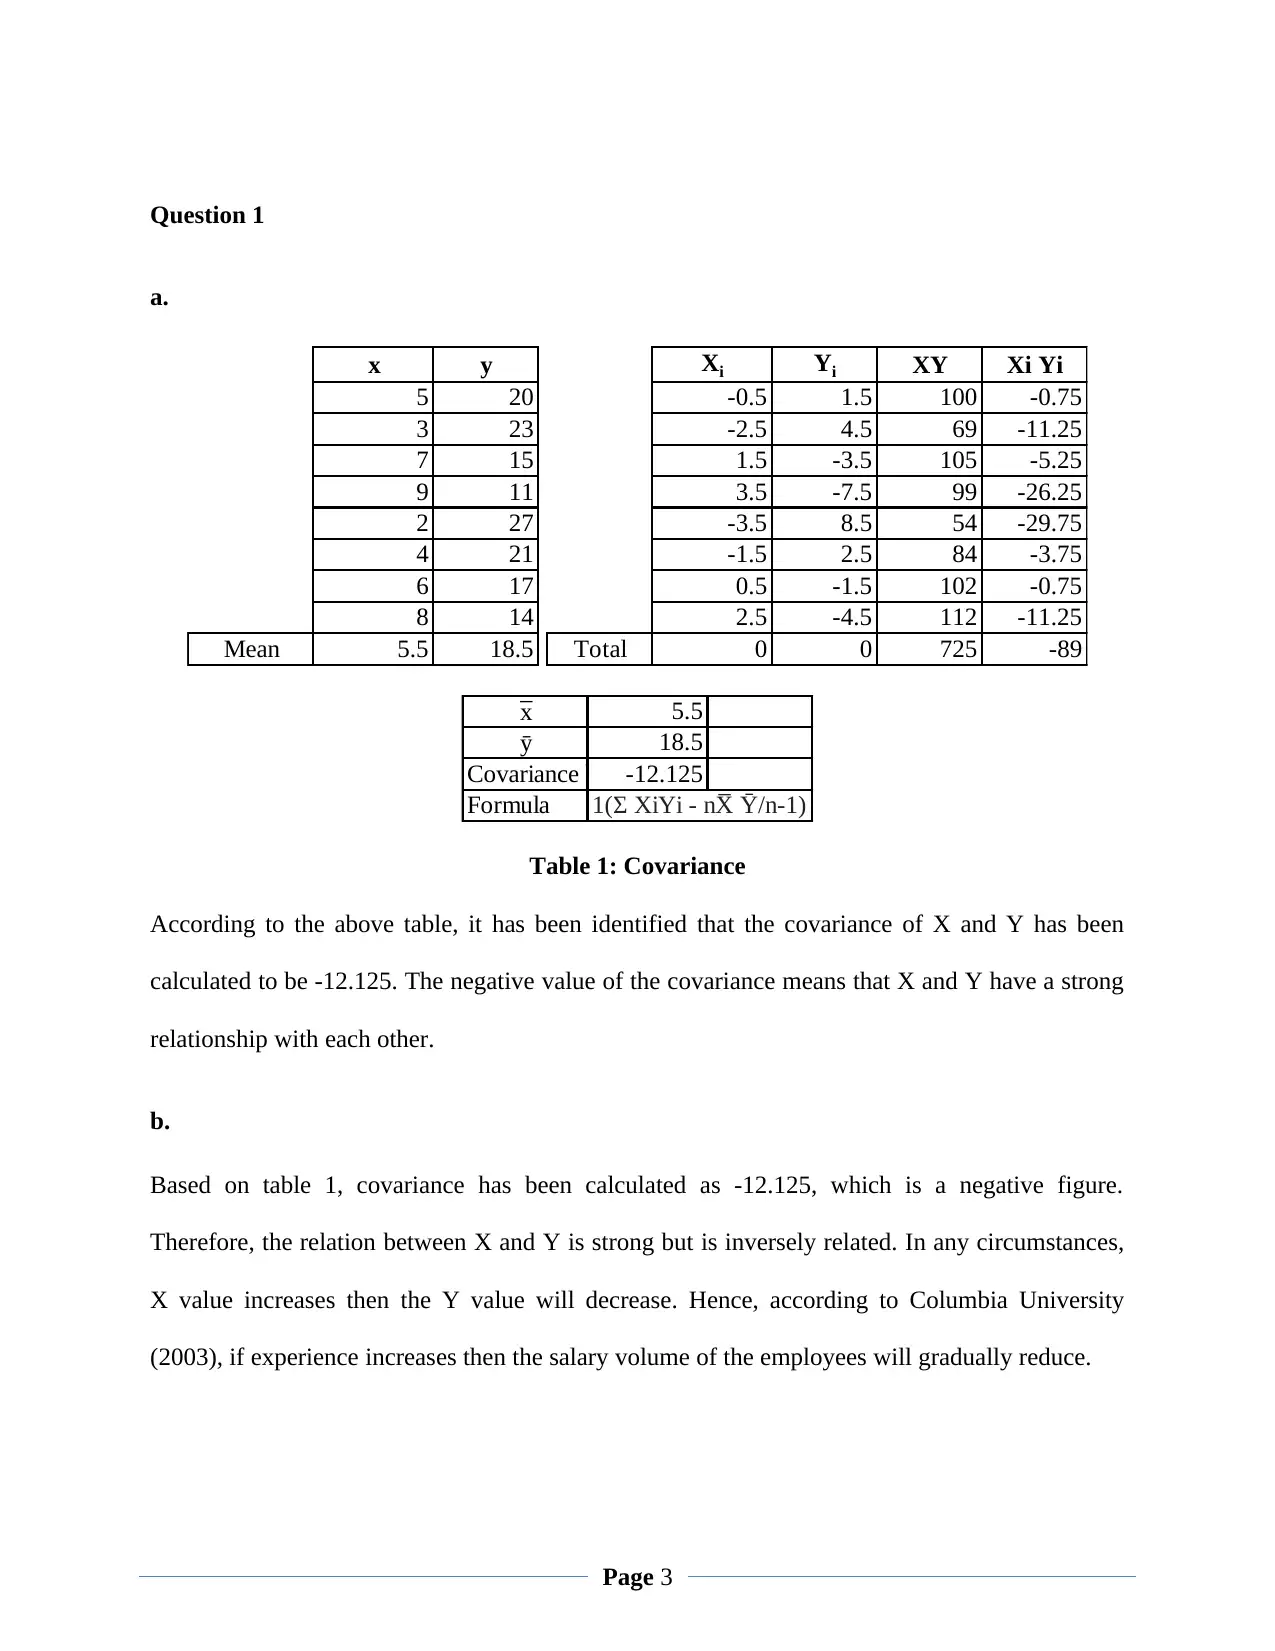
Table 1: Covariance
According to the above table, it has been identified that the covariance of X and Y has been
calculated to be -12.125. The negative value of the covariance means that X and Y have a strong
relationship with each other.
b.
Based on table 1, covariance has been calculated as -12.125, which is a negative figure.
Therefore, the relation between X and Y is strong but is inversely related. In any circumstances,
X value increases then the Y value will decrease. Hence, according to Columbia University
(2003), if experience increases then the salary volume of the employees will gradually reduce.
Page 3
a.
x y
5 20
3 23
7 15
9 11
2 27
4 21
6 17
8 14
Mean 5.5 18.5
Xi Yi XY Xi Yi
-0.5 1.5 100 -0.75
-2.5 4.5 69 -11.25
1.5 -3.5 105 -5.25
3.5 -7.5 99 -26.25
-3.5 8.5 54 -29.75
-1.5 2.5 84 -3.75
0.5 -1.5 102 -0.75
2.5 -4.5 112 -11.25
Total 0 0 725 -89
x̅ 5.5
ȳ 18.5
Covariance between x and y (Cov)-12.125
Formula 1(Σ XiYi - nX̅ Ȳ/n-1)
Table 1: Covariance
According to the above table, it has been identified that the covariance of X and Y has been
calculated to be -12.125. The negative value of the covariance means that X and Y have a strong
relationship with each other.
b.
Based on table 1, covariance has been calculated as -12.125, which is a negative figure.
Therefore, the relation between X and Y is strong but is inversely related. In any circumstances,
X value increases then the Y value will decrease. Hence, according to Columbia University
(2003), if experience increases then the salary volume of the employees will gradually reduce.
Page 3
⊘ This is a preview!⊘
Do you want full access?
Subscribe today to unlock all pages.
Trusted by 1+ million students worldwide
c.
X Y x=X-X̅ x^2 y=Y-Ȳ y^2 xy
5 20 -0.5 0.25 1.5 2.25 -0.75
3 23 -2.5 6.25 4.5 20.25 -11.25
7 15 1.5 2.25 -3.5 12.25 -5.25
9 11 3.5 12.25 -7.5 56.25 -26.25
2 27 -3.5 12.25 8.5 72.25 -29.75
4 21 -1.5 2.25 2.5 6.25 -3.75
6 17 0.5 0.25 -1.5 2.25 -0.75
8 14 2.5 6.25 -4.5 20.25 -11.25
44 148 42 192 -89
Σx^2 42
Σy^2 192
Ȳ 18.5
Σxy -89
x^2 y^2 8064
√x^2 y^2 89.800
R -0.991
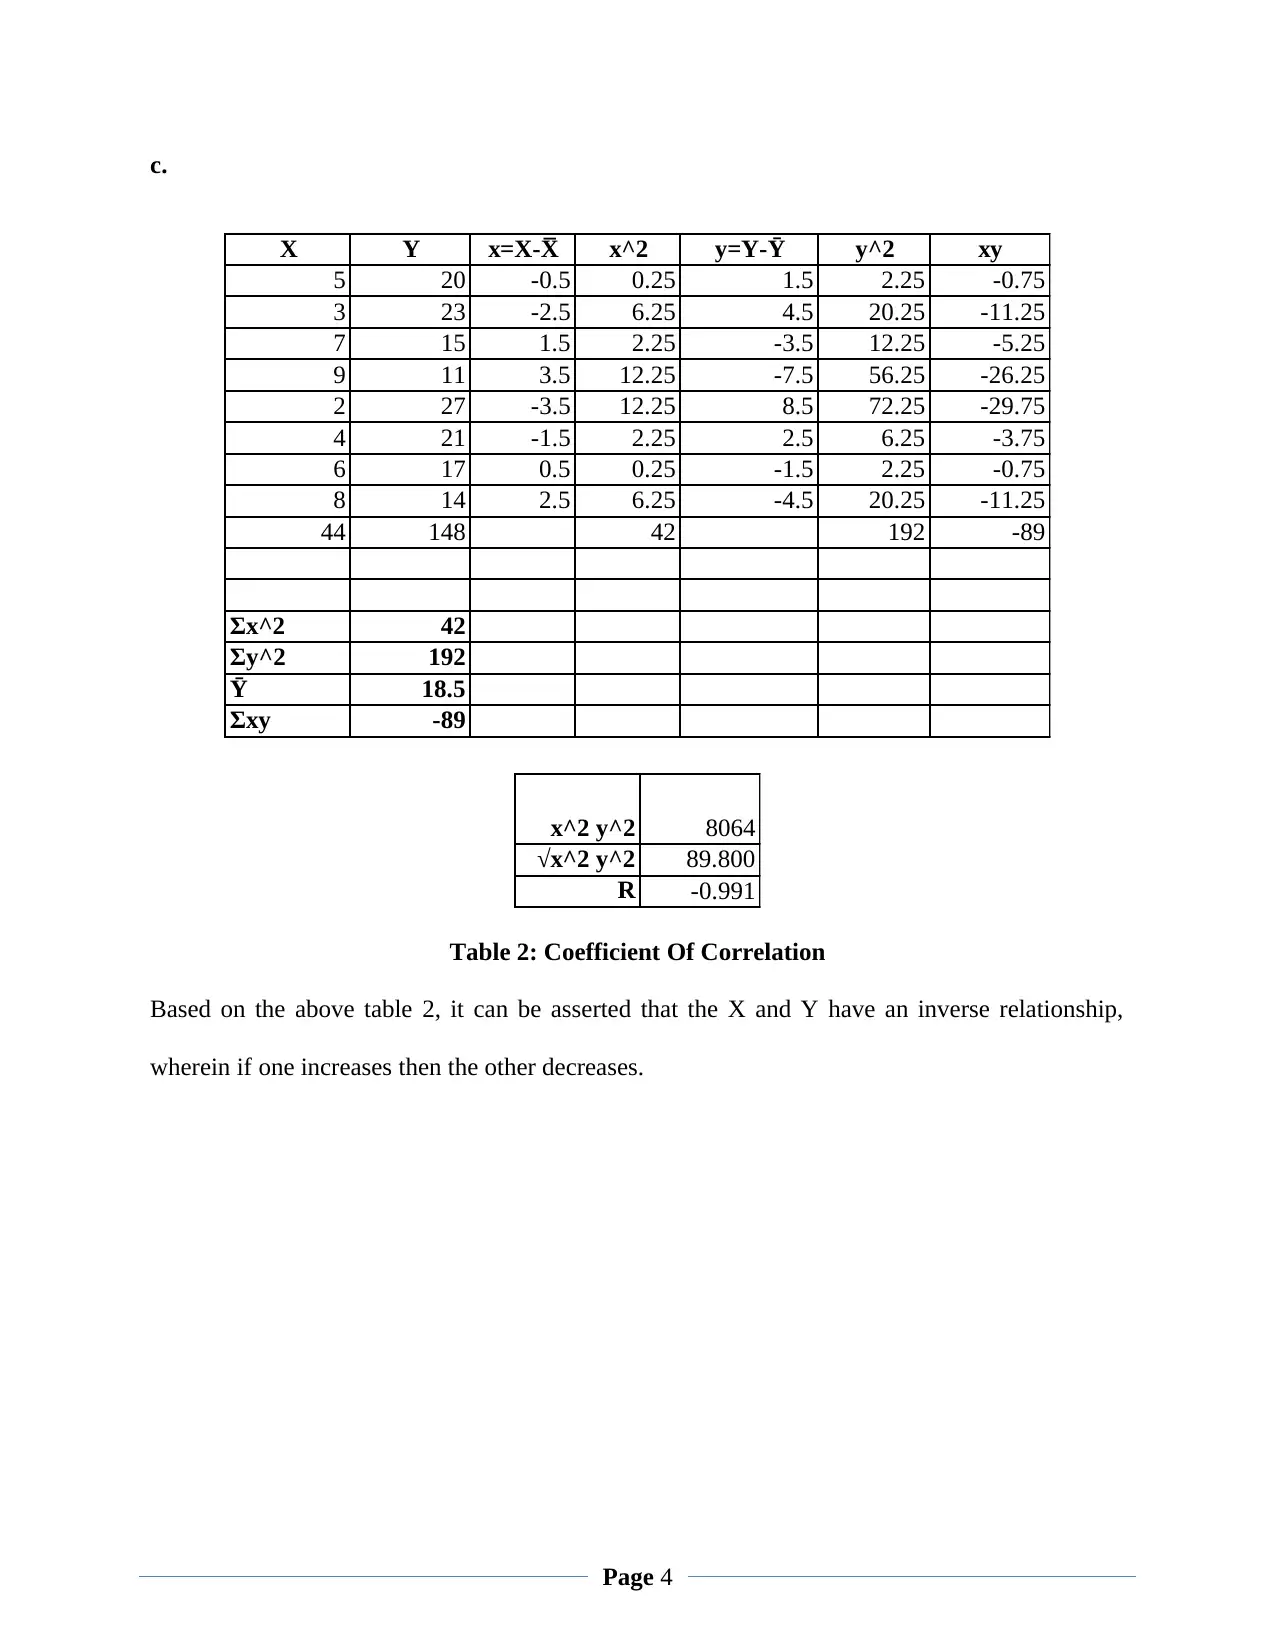
Table 2: Coefficient Of Correlation
Based on the above table 2, it can be asserted that the X and Y have an inverse relationship,
wherein if one increases then the other decreases.
Page 4
X Y x=X-X̅ x^2 y=Y-Ȳ y^2 xy
5 20 -0.5 0.25 1.5 2.25 -0.75
3 23 -2.5 6.25 4.5 20.25 -11.25
7 15 1.5 2.25 -3.5 12.25 -5.25
9 11 3.5 12.25 -7.5 56.25 -26.25
2 27 -3.5 12.25 8.5 72.25 -29.75
4 21 -1.5 2.25 2.5 6.25 -3.75
6 17 0.5 0.25 -1.5 2.25 -0.75
8 14 2.5 6.25 -4.5 20.25 -11.25
44 148 42 192 -89
Σx^2 42
Σy^2 192
Ȳ 18.5
Σxy -89
x^2 y^2 8064
√x^2 y^2 89.800
R -0.991
Table 2: Coefficient Of Correlation
Based on the above table 2, it can be asserted that the X and Y have an inverse relationship,
wherein if one increases then the other decreases.
Page 4
Paraphrase This Document
Need a fresh take? Get an instant paraphrase of this document with our AI Paraphraser
d.
Experience of an employee within an organization can be measured as one of the valuable
aspects. However, the calculation depicts that if experience increase then salary will decrease
and if salaries increase then the experience will decrease. Hence, the possible reason is that the
employees may not increase their skills and performance over the years even with an increase in
their salary.
Question 2
a.
Hypothesis
Null hypothesis (H0): The actual percentage of drowsiness experienced by 900 subjects of a
company is 10% among
Alternate hypothesis (H1): The percentage of drowsiness experienced by 900 subjects of a
company is not 10%
b.
As per the case, it has been identified that the drug manufacturing company has taken 900
subjects to test. Only 81 subjects did not experience drowsiness and the rest 819 subjects were
feeling drowsy. Therefore, only 9 percent of the population examined did not face drowsiness.
For this reason, it can be claimed that 9% of the population is measured to be under the 95%
confidence level and the rest 91% has been considered into the 5% significance level, which can
Page 5
be measured as an unfair practice. In any circumstances, if 50% or more people faced non-
drowsiness then the company can claim that the test is successful. These previously mentioned
factors could be considered as the major evidence, wherein the competitor is correct regarding
the significance level to be 5%. This can be better explained by the figure below.
Page 6
drowsiness then the company can claim that the test is successful. These previously mentioned
factors could be considered as the major evidence, wherein the competitor is correct regarding
the significance level to be 5%. This can be better explained by the figure below.
Page 6
⊘ This is a preview!⊘
Do you want full access?
Subscribe today to unlock all pages.
Trusted by 1+ million students worldwide
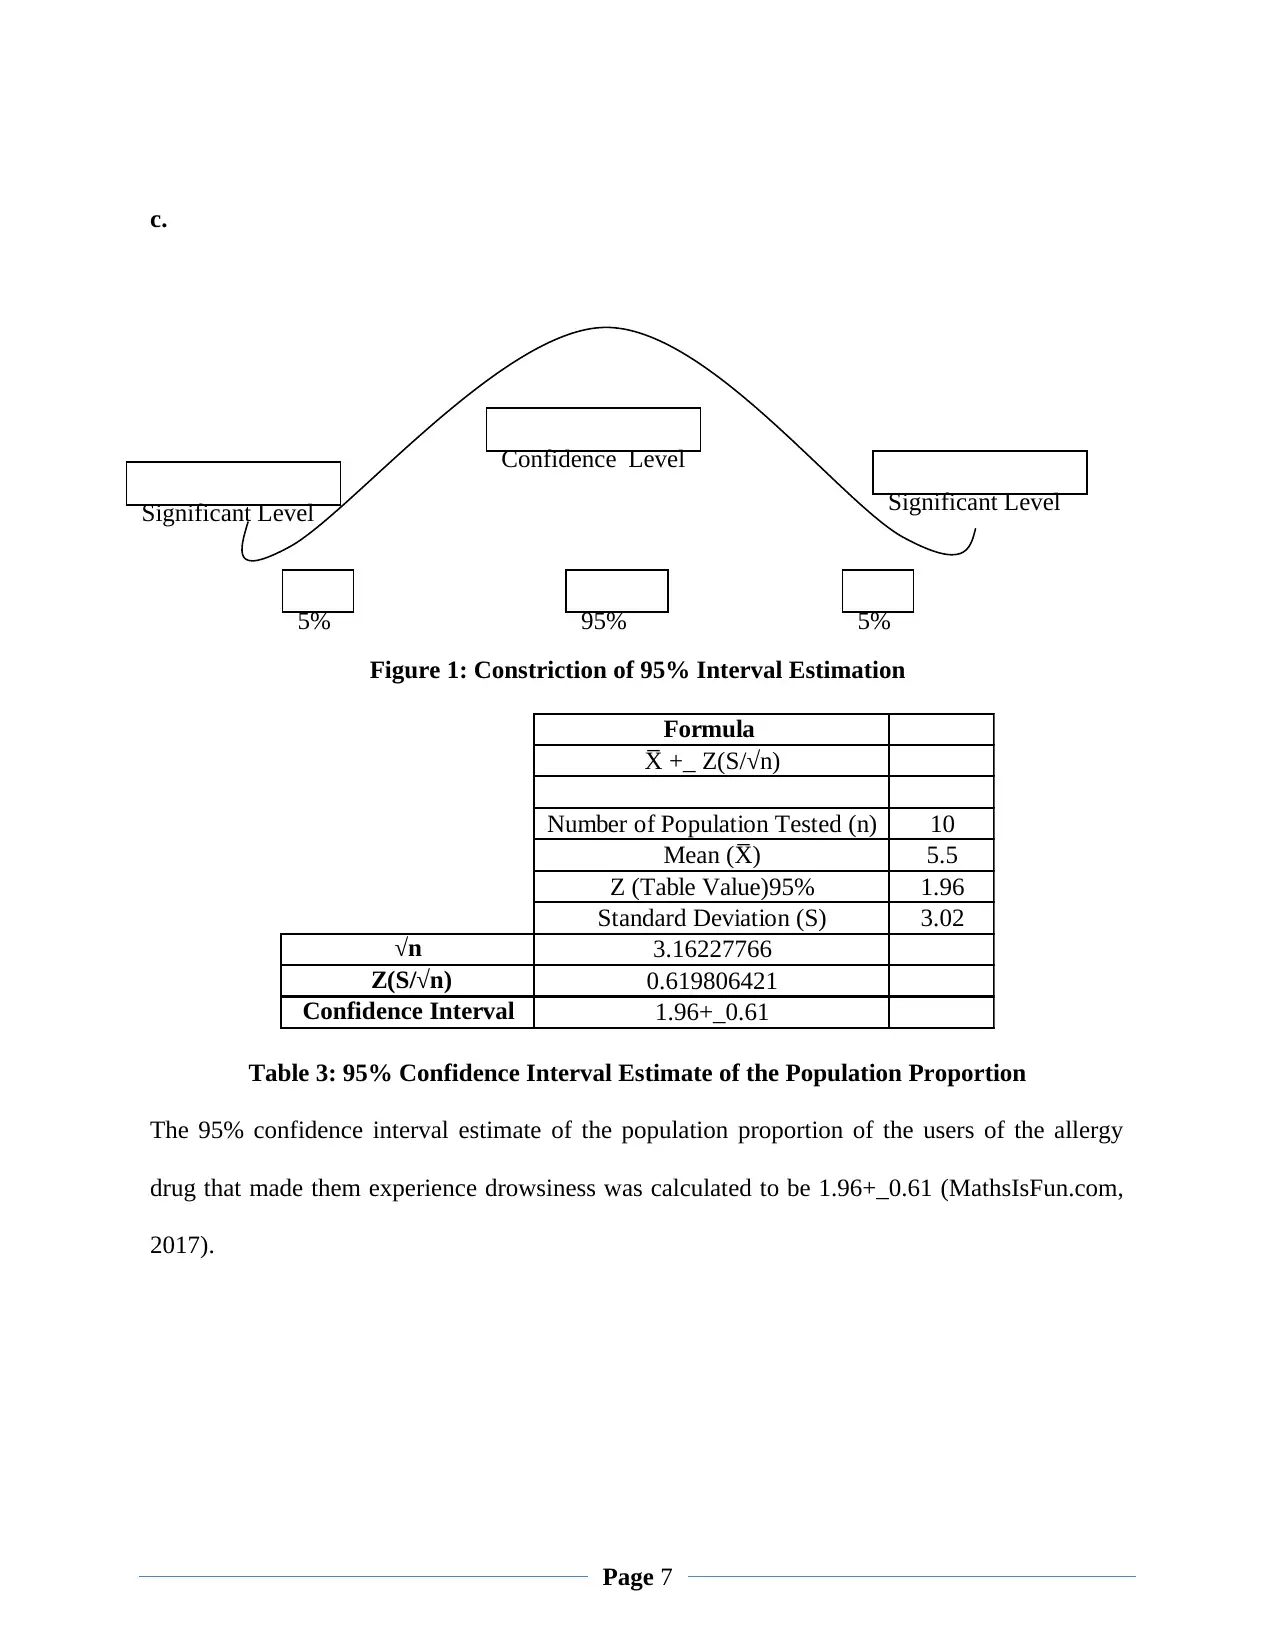
c.
Figure 1: Constriction of 95% Interval Estimation
Formula
X̅ +_ Z(S/√n)
Number of Population Tested (n) 10
Mean (X̅) 5.5
Z (Table Value)95% 1.96
Standard Deviation (S) 3.02
√n 3.16227766
Z(S/√n) 0.619806421
Confidence Interval 1.96+_0.61
Table 3: 95% Confidence Interval Estimate of the Population Proportion
The 95% confidence interval estimate of the population proportion of the users of the allergy
drug that made them experience drowsiness was calculated to be 1.96+_0.61 (MathsIsFun.com,
2017).
Page 7
Confidence Level
Significant Level Significant Level
5% 5%95%
Paraphrase This Document
Need a fresh take? Get an instant paraphrase of this document with our AI Paraphraser
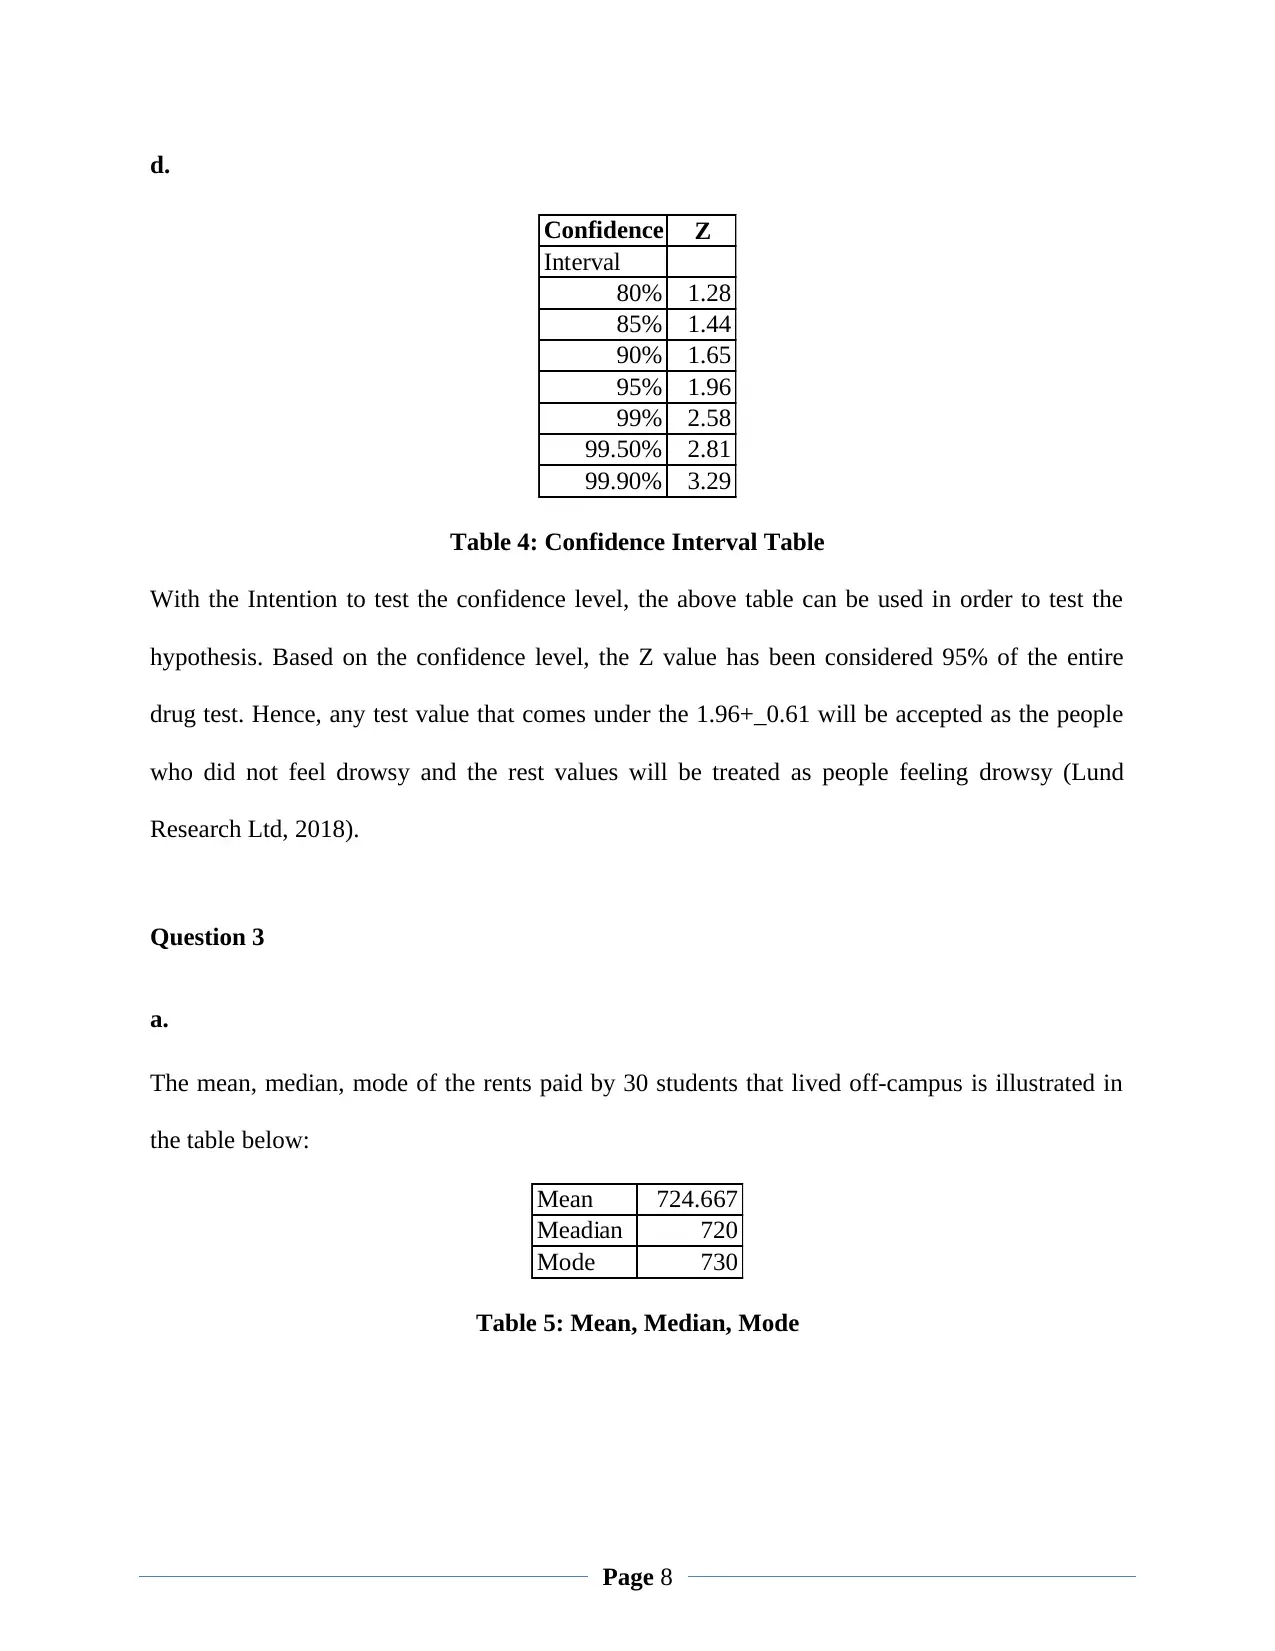
d.
Confidence Z
Interval
80% 1.28
85% 1.44
90% 1.65
95% 1.96
99% 2.58
99.50% 2.81
99.90% 3.29
Table 4: Confidence Interval Table
With the Intention to test the confidence level, the above table can be used in order to test the
hypothesis. Based on the confidence level, the Z value has been considered 95% of the entire
drug test. Hence, any test value that comes under the 1.96+_0.61 will be accepted as the people
who did not feel drowsy and the rest values will be treated as people feeling drowsy (Lund
Research Ltd, 2018).
Question 3
a.
The mean, median, mode of the rents paid by 30 students that lived off-campus is illustrated in
the table below:
Mean 724.667
Meadian 720
Mode 730
Table 5: Mean, Median, Mode
Page 8
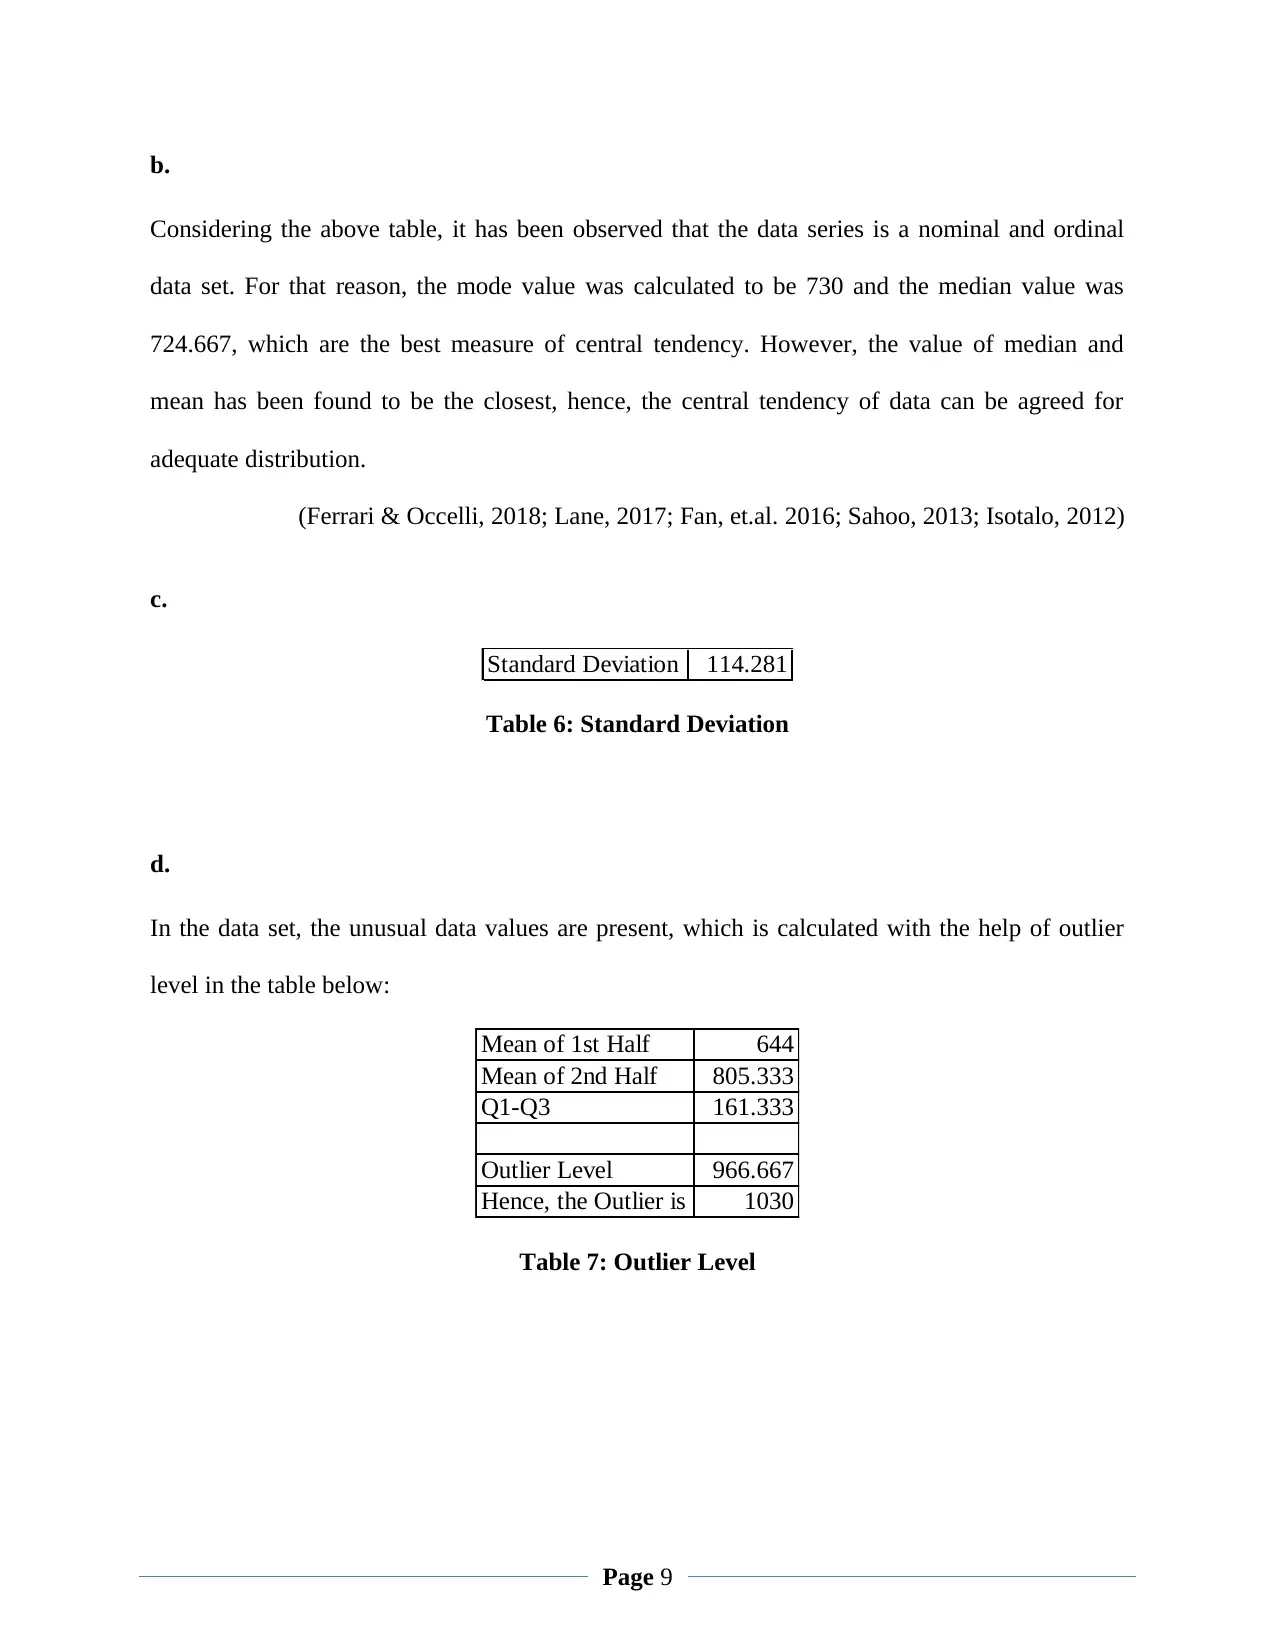
b.
Considering the above table, it has been observed that the data series is a nominal and ordinal
data set. For that reason, the mode value was calculated to be 730 and the median value was
724.667, which are the best measure of central tendency. However, the value of median and
mean has been found to be the closest, hence, the central tendency of data can be agreed for
adequate distribution.
(Ferrari & Occelli, 2018; Lane, 2017; Fan, et.al. 2016; Sahoo, 2013; Isotalo, 2012)
c.
Standard Deviation 114.281
Table 6: Standard Deviation
d.
In the data set, the unusual data values are present, which is calculated with the help of outlier
level in the table below:
Mean of 1st Half 644
Mean of 2nd Half 805.333
Q1-Q3 161.333
Outlier Level 966.667
Hence, the Outlier is 1030
Table 7: Outlier Level
Page 9
⊘ This is a preview!⊘
Do you want full access?
Subscribe today to unlock all pages.
Trusted by 1+ million students worldwide
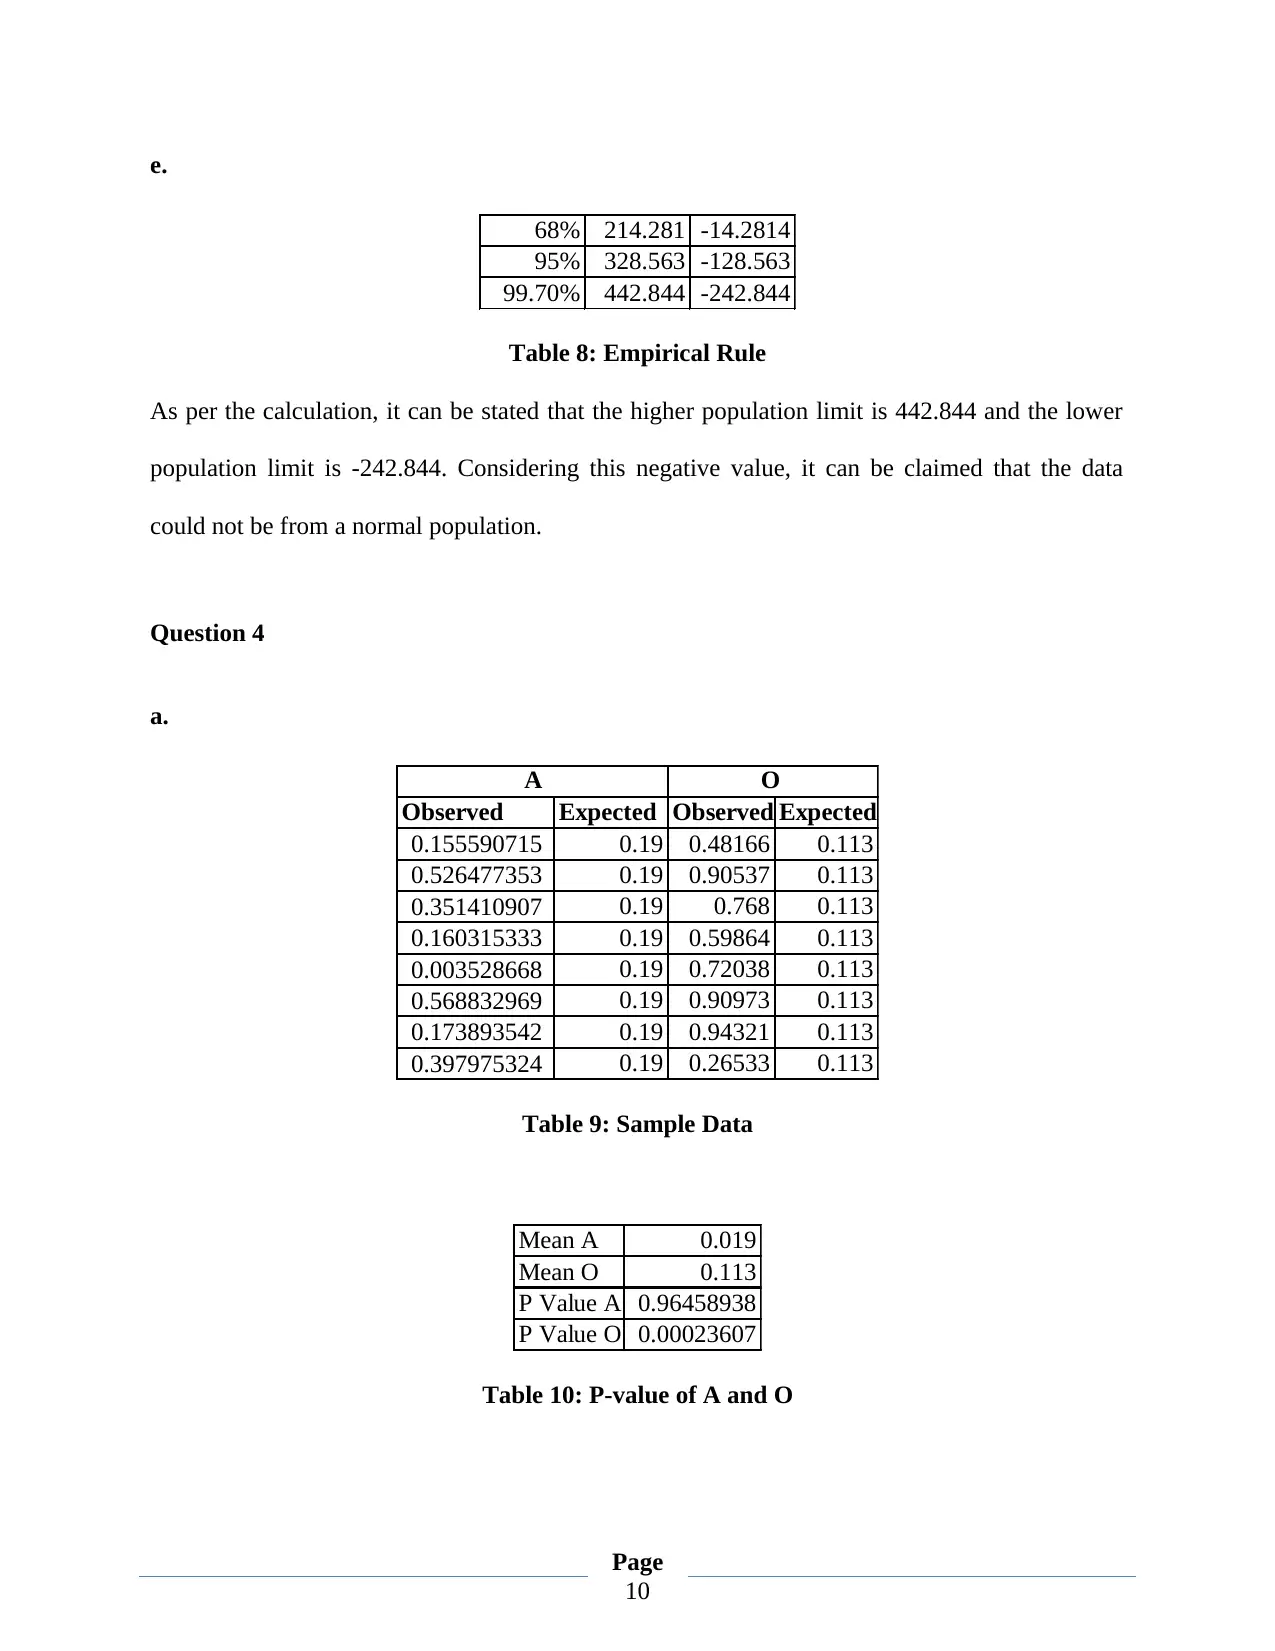
e.
68% 214.281 -14.2814
95% 328.563 -128.563
99.70% 442.844 -242.844
Table 8: Empirical Rule
As per the calculation, it can be stated that the higher population limit is 442.844 and the lower
population limit is -242.844. Considering this negative value, it can be claimed that the data
could not be from a normal population.
Question 4
a.
Observed Expected Observed Expected
0.155590715 0.19 0.48166 0.113
0.526477353 0.19 0.90537 0.113
0.351410907 0.19 0.768 0.113
0.160315333 0.19 0.59864 0.113
0.003528668 0.19 0.72038 0.113
0.568832969 0.19 0.90973 0.113
0.173893542 0.19 0.94321 0.113
0.397975324 0.19 0.26533 0.113
A O
Table 9: Sample Data
Mean A 0.019
Mean O 0.113
P Value A 0.96458938
P Value O 0.00023607
Table 10: P-value of A and O
Page
10
Paraphrase This Document
Need a fresh take? Get an instant paraphrase of this document with our AI Paraphraser
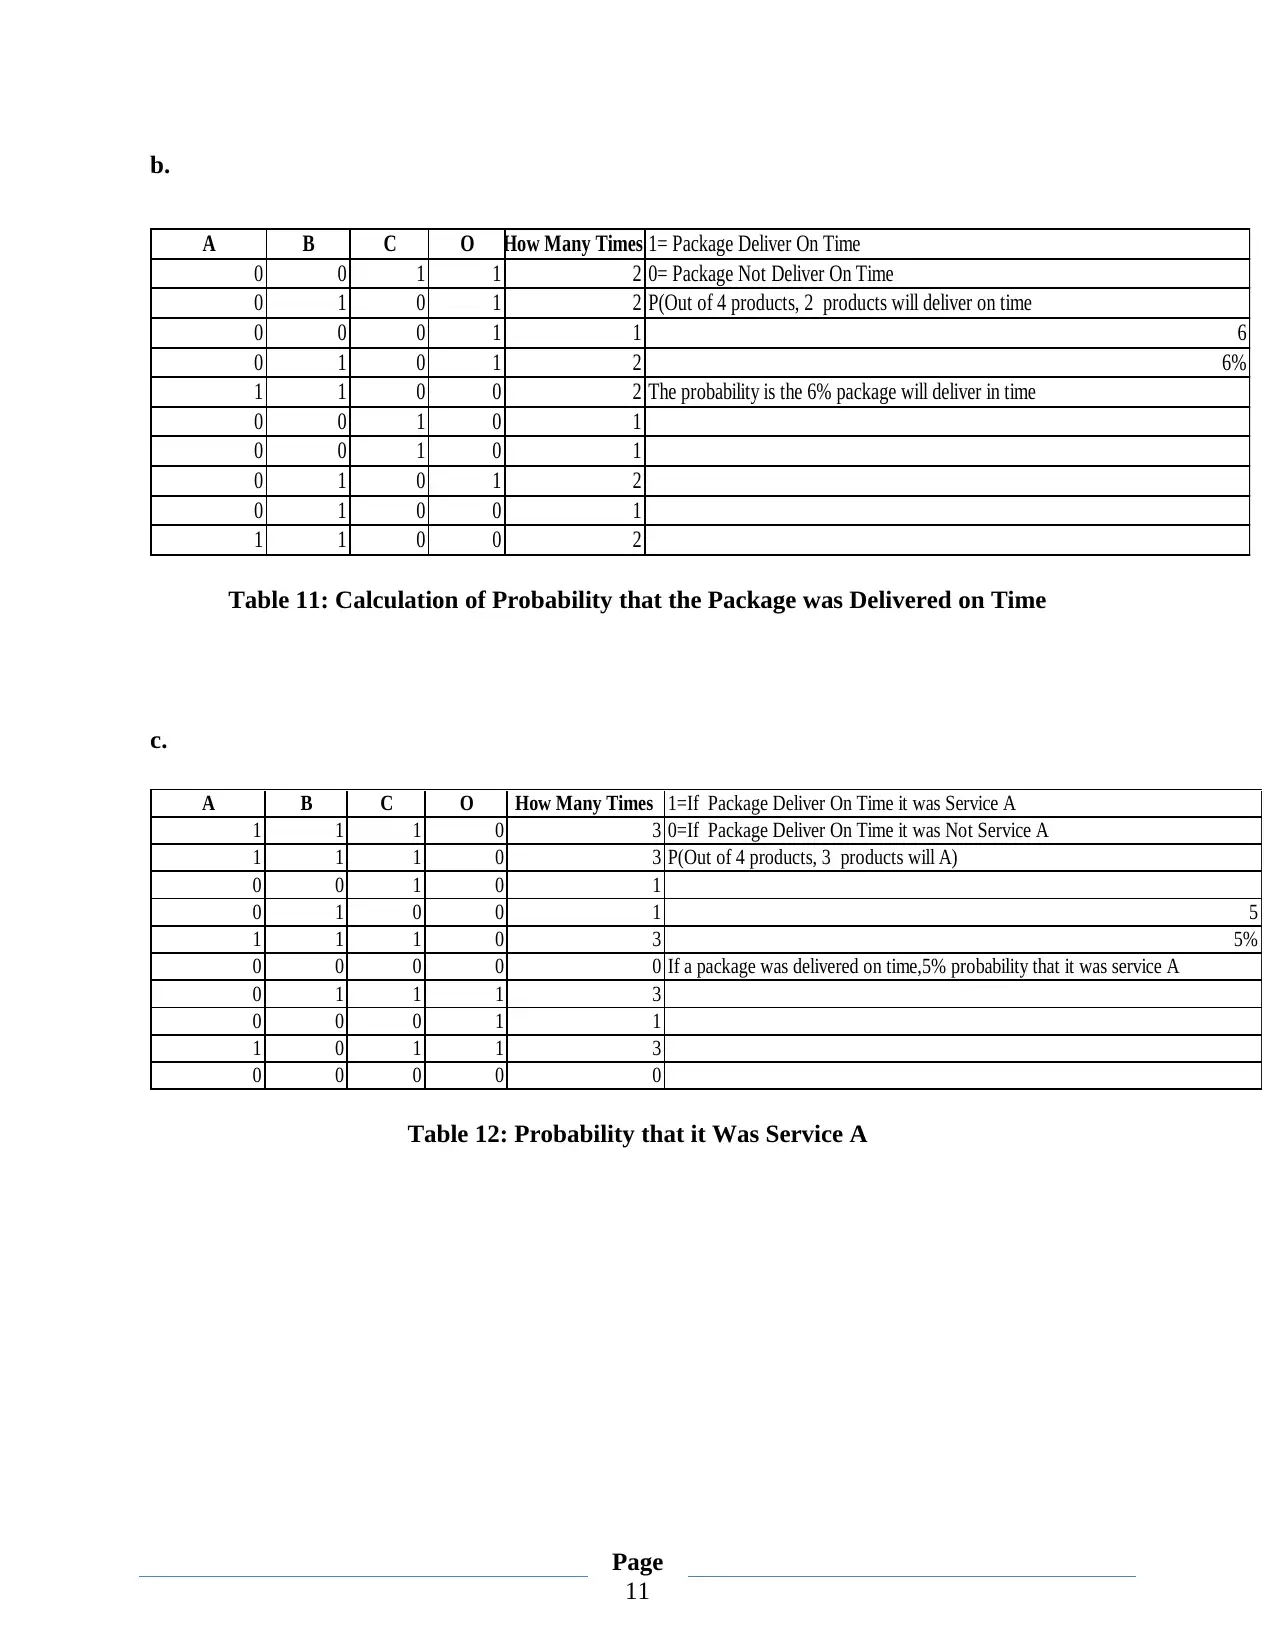
b.
A B C O How Many Times 1= Package Deliver On Time
0 0 1 1 2 0= Package Not Deliver On Time
0 1 0 1 2 P(Out of 4 products, 2 products will deliver on time
0 0 0 1 1 6
0 1 0 1 2 6%
1 1 0 0 2 The probability is the 6% package will deliver in time
0 0 1 0 1
0 0 1 0 1
0 1 0 1 2
0 1 0 0 1
1 1 0 0 2
Table 11: Calculation of Probability that the Package was Delivered on Time
c.
A B C O How Many Times 1=If Package Deliver On Time it was Service A
1 1 1 0 3 0=If Package Deliver On Time it was Not Service A
1 1 1 0 3 P(Out of 4 products, 3 products will A)
0 0 1 0 1
0 1 0 0 1 5
1 1 1 0 3 5%
0 0 0 0 0 If a package was delivered on time,5% probability that it was service A
0 1 1 1 3
0 0 0 1 1
1 0 1 1 3
0 0 0 0 0
Table 12: Probability that it Was Service A
Page
11
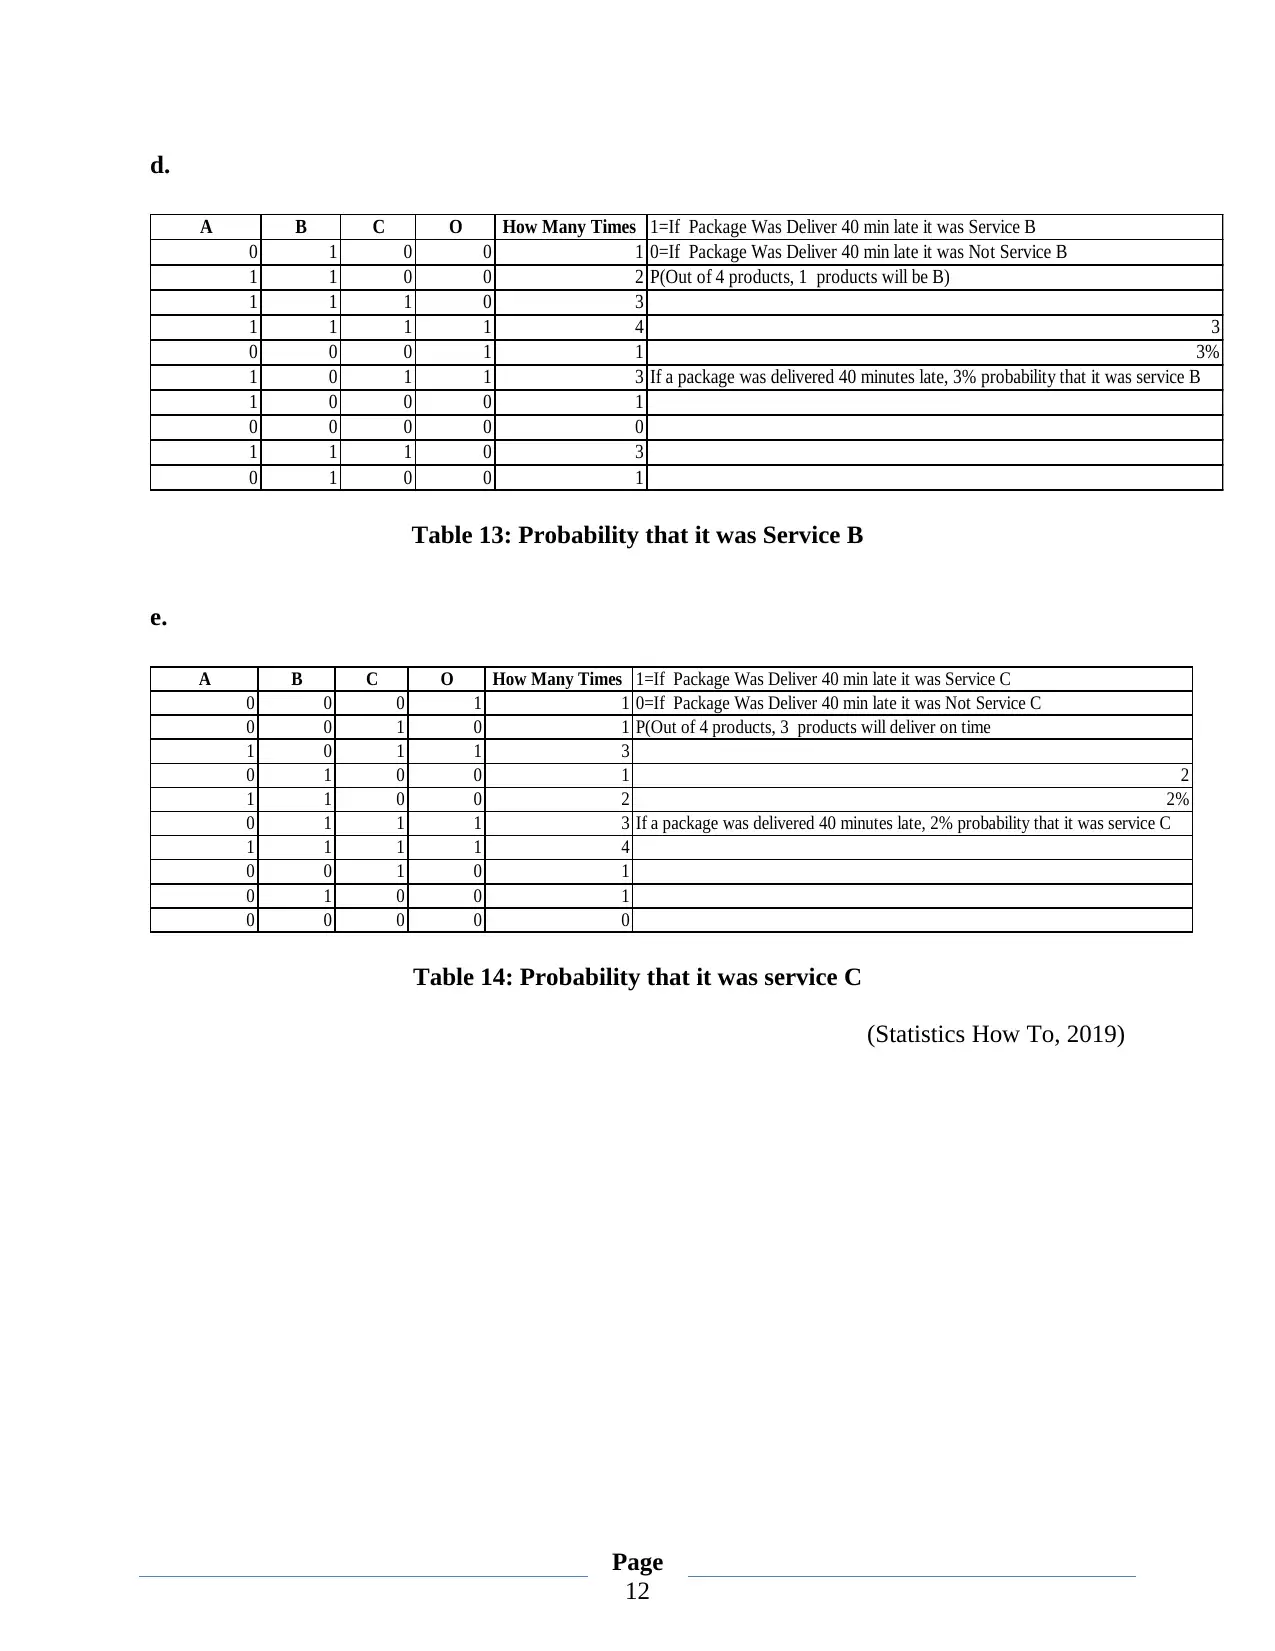
d.
A B C O How Many Times 1=If Package Was Deliver 40 min late it was Service B
0 1 0 0 1 0=If Package Was Deliver 40 min late it was Not Service B
1 1 0 0 2 P(Out of 4 products, 1 products will be B)
1 1 1 0 3
1 1 1 1 4 3
0 0 0 1 1 3%
1 0 1 1 3 If a package was delivered 40 minutes late, 3% probability that it was service B
1 0 0 0 1
0 0 0 0 0
1 1 1 0 3
0 1 0 0 1
Table 13: Probability that it was Service B
e.
A B C O How Many Times 1=If Package Was Deliver 40 min late it was Service C
0 0 0 1 1 0=If Package Was Deliver 40 min late it was Not Service C
0 0 1 0 1 P(Out of 4 products, 3 products will deliver on time
1 0 1 1 3
0 1 0 0 1 2
1 1 0 0 2 2%
0 1 1 1 3 If a package was delivered 40 minutes late, 2% probability that it was service C
1 1 1 1 4
0 0 1 0 1
0 1 0 0 1
0 0 0 0 0
Table 14: Probability that it was service C
(Statistics How To, 2019)
Page
12
⊘ This is a preview!⊘
Do you want full access?
Subscribe today to unlock all pages.
Trusted by 1+ million students worldwide
1 out of 13
Related Documents


Your All-in-One AI-Powered Toolkit for Academic Success.
+13062052269
info@desklib.com
Available 24*7 on WhatsApp / Email
![[object Object]](/_next/static/media/star-bottom.7253800d.svg)
Unlock your academic potential
Copyright © 2020–2026 A2Z Services. All Rights Reserved. Developed and managed by ZUCOL.