Statistical Analysis and Probability for Decision Making - Module 1
VerifiedAdded on 2020/01/28
|8
|1170
|271
Homework Assignment
AI Summary
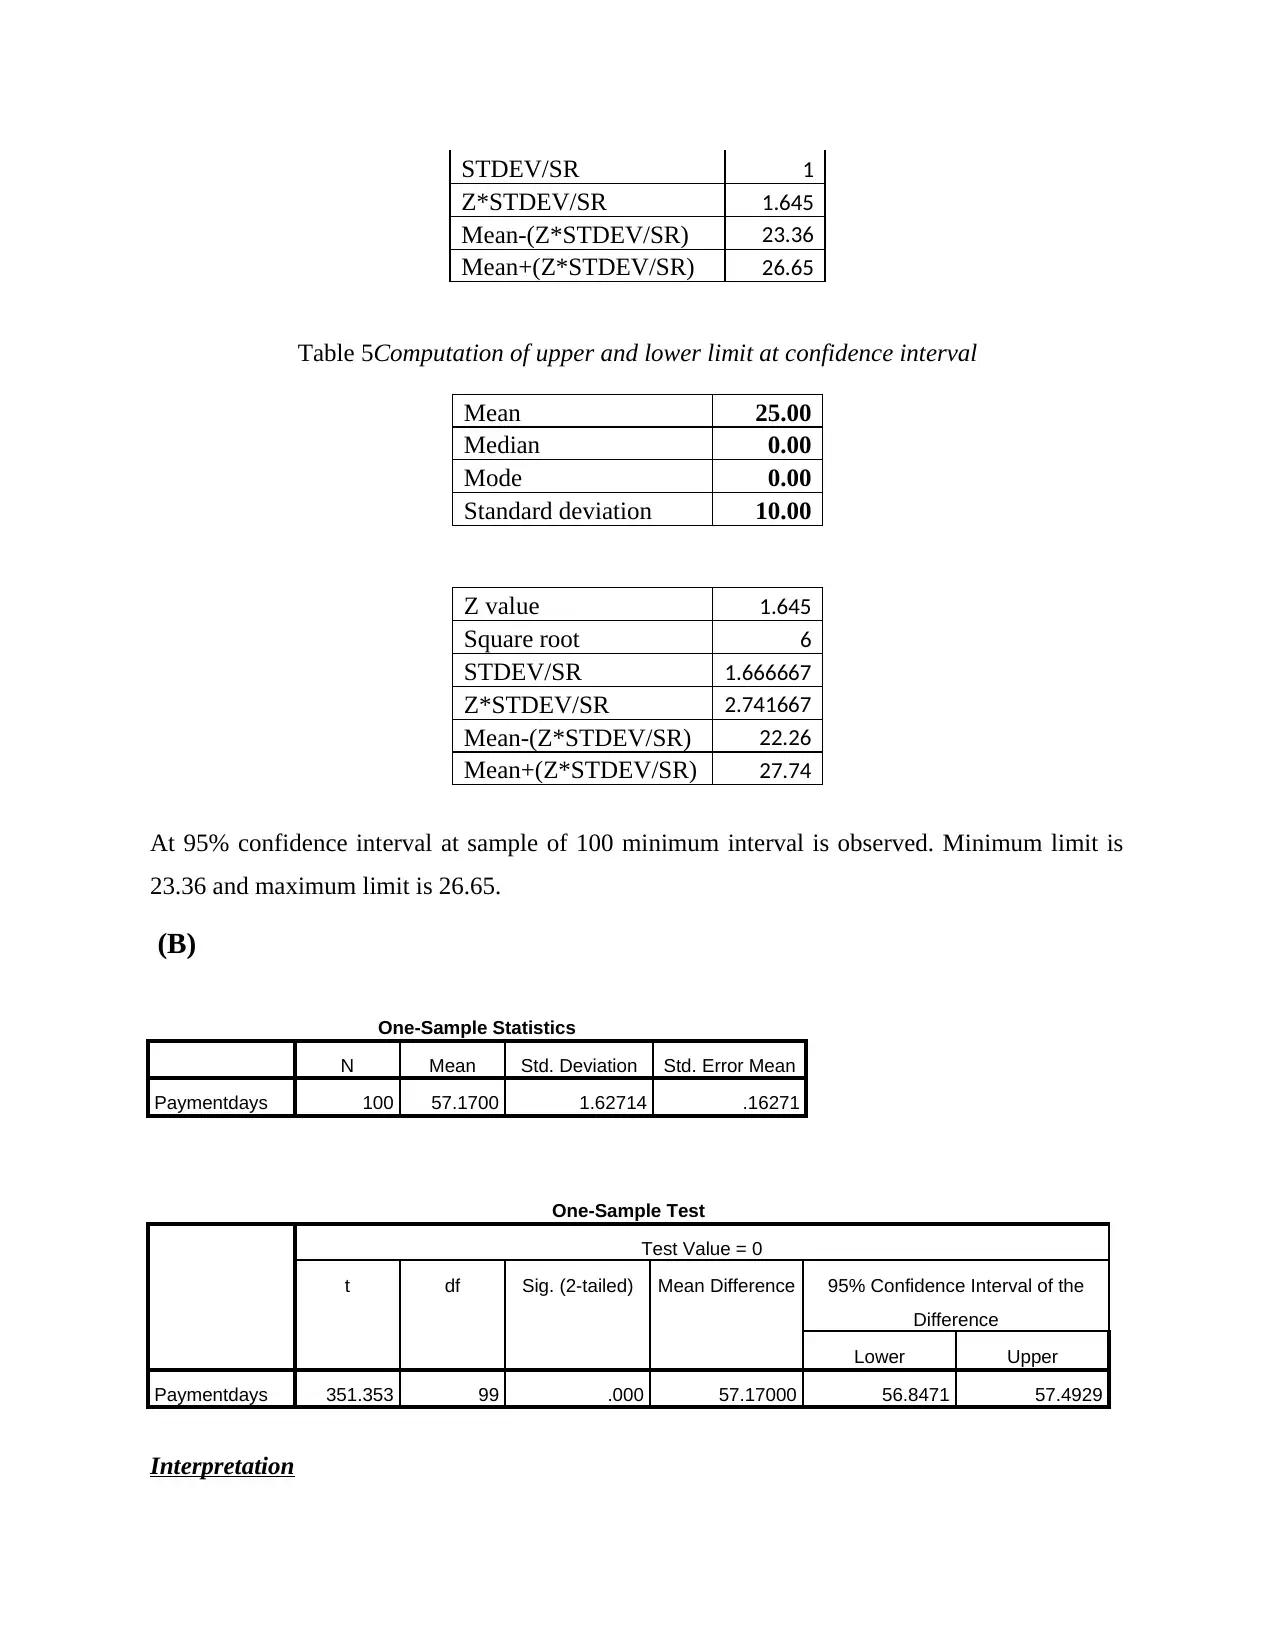
This statistics assignment addresses key concepts in probability and statistical decision-making. It begins with calculating probabilities, including the probability of selecting a female, an individual aged 25-54, and the joint probability of a male aged 15-24, along with conditional probabilities. The assignment then delves into statistical quality control, focusing on x-bar control limits, calculating upper and lower control limits for different sample sizes and confidence intervals. It explores the impact of sample size on control limits. Finally, the assignment includes a t-test analysis to assess the significance of the difference between variables, providing insights into the average time taken for payments based on a sample of 100 individuals, along with relevant interpretations and references.

ASSESSMENT ITEM 1
Paraphrase This Document
Need a fresh take? Get an instant paraphrase of this document with our AI Paraphraser

TABLE OF CONTENTS
Question 2........................................................................................................................................3
The probability that any person selected at random from the population is a female.................3
The probability that any person selected at random from the population is aged between 25
and 54...........................................................................................................................................3
The joint probability that any person selected at random from the population is a male and
aged between 15 and 24...............................................................................................................3
The conditional probability that any person selected at random from the population is 25 or
over given that the person is a female.........................................................................................3
QUESTION 3 Statistical Decision Making and Quality Control....................................................4
(A)....................................................................................................................................................4
1 If management wishes to establish x-bar control limits covering the 95% confidence interval,
calculate the appropriate UCL and LCL......................................................................................4
2 If management wishes to use smaller samples of 16 observations calculate the control limits
covering the 95% confidence interval.........................................................................................4
3 Management is considering three alternative procedures in order to maintain tighter control
over labor time.............................................................................................................................5
(B)....................................................................................................................................................6

Question 2
The probability that any person selected at random from the population is a female.
Total females= 47
Total population= 86
Total females/total population= 47/86= 0.54
Probability that any female will randomly selected from the population is 0.54. The highest value
of probability is 1and current value is 0.54 which reflect that there is moderate probability that
randomly women will be selected from the population.
The probability that any person selected at random from the population is aged between 25 and
54
Total population in group of 25 and 54= 16
Total population= 86
Total population in group/ Total population=16/86=0.18.
There is 0.18 probability that there will random selection of any individual that comes in age
group of 25 to 54.
The joint probability that any person selected at random from the population is a male and aged
between 15 and 24.
Total male in age group of 15 to 24= 7
Total population= 86
Total make in age group/ Total population= 7/86=0.081
There is very low probability of 0.081 that any person randomly selected from the age group of
15 to 24 will be male.
The conditional probability that any person selected at random from the population is 25 or over
given that the person is a female
By applying formula of conditional probability value computed is 0.65. This reflect that there is
0.65 probability that person selected at random from the population is 25 or more in age.
By applying mentioned formula probability is computed at 0.65.
⊘ This is a preview!⊘
Do you want full access?
Subscribe today to unlock all pages.

Trusted by 1+ million students worldwide

Sum of female population from 25 age group= 31
Total population=86
Probability= 31/86=0.36
Probability of female selection randomly from the population= 0.54
Overall probability= 0.36/0.54= 0.65.
QUESTION 3 Statistical Decision Making and Quality Control
(A)
1 If management wishes to establish x-bar control limits covering the 95% confidence interval,
calculate the appropriate UCL and LCL.
Table 1Computation of upper and lower limit
Mean 25.00
Median 0.00
Mode 0.00
Standard deviation 10.00
Z value 1.645
Square root 8
STDEV/SR 1.25
Z*STDEV/SR 2.05625
Mean-(Z*STDEV/SR) 22.94
Mean+(Z*STDEV/SR) 27.06
Interpretation
Confidence interval minimum and maximum range is 22.964 and 27.06. This means that
at 95% confidence interval always values will remain in range of mentioned values.
2 If management wishes to use smaller samples of 16 observations calculate the control limits
covering the 95% confidence interval
Table 2Computation of upper and lower limit at 95% confidence interval
Mean 25.00
Median 0.00
Mode 0.00
Standard deviation 10.00
Paraphrase This Document
Need a fresh take? Get an instant paraphrase of this document with our AI Paraphraser

Z value 1.645
Square root 4
STDEV/SR 2.5
Z*STDEV/SR 4.1125
Mean-(Z*STDEV/SR) 20.89
Mean+(Z*STDEV/SR) 29.11
Interpretation
At 95% confidence interval at sample size of 16 people minimum and maximum value
range is 20.89 and 29.11. It can be said that with change in sample size results get changed.
3 Management is considering three alternative procedures in order to maintain tighter control
over labor time
Table 3Computation of upper and lower limit at 80% confidence interval
Mean 25.00
Median 0.00
Mode 0.00
Standard deviation 10.00
Z value 1.28
Square root 4
STDEV/SR 2.5
Z*STDEV/SR 3.2
Mean-(Z*STDEV/SR) 21.80
Mean+(Z*STDEV/SR) 28.20
Table 4Computation of upper and lower limit at 95% confidence interval
Mean 25.00
Median 0.00
Mode 0.00
Standard deviation 10.00
Z value 1.645
Square root 10
Square root 4
STDEV/SR 2.5
Z*STDEV/SR 4.1125
Mean-(Z*STDEV/SR) 20.89
Mean+(Z*STDEV/SR) 29.11
Interpretation
At 95% confidence interval at sample size of 16 people minimum and maximum value
range is 20.89 and 29.11. It can be said that with change in sample size results get changed.
3 Management is considering three alternative procedures in order to maintain tighter control
over labor time
Table 3Computation of upper and lower limit at 80% confidence interval
Mean 25.00
Median 0.00
Mode 0.00
Standard deviation 10.00
Z value 1.28
Square root 4
STDEV/SR 2.5
Z*STDEV/SR 3.2
Mean-(Z*STDEV/SR) 21.80
Mean+(Z*STDEV/SR) 28.20
Table 4Computation of upper and lower limit at 95% confidence interval
Mean 25.00
Median 0.00
Mode 0.00
Standard deviation 10.00
Z value 1.645
Square root 10

STDEV/SR 1
Z*STDEV/SR 1.645
Mean-(Z*STDEV/SR) 23.36
Mean+(Z*STDEV/SR) 26.65
Table 5Computation of upper and lower limit at confidence interval
Mean 25.00
Median 0.00
Mode 0.00
Standard deviation 10.00
Z value 1.645
Square root 6
STDEV/SR 1.666667
Z*STDEV/SR 2.741667
Mean-(Z*STDEV/SR) 22.26
Mean+(Z*STDEV/SR) 27.74
At 95% confidence interval at sample of 100 minimum interval is observed. Minimum limit is
23.36 and maximum limit is 26.65.
(B)
One-Sample Statistics
N Mean Std. Deviation Std. Error Mean
Paymentdays 100 57.1700 1.62714 .16271
One-Sample Test
Test Value = 0
t df Sig. (2-tailed) Mean Difference 95% Confidence Interval of the
Difference
Lower Upper
Paymentdays 351.353 99 .000 57.17000 56.8471 57.4929
Interpretation
⊘ This is a preview!⊘
Do you want full access?
Subscribe today to unlock all pages.

Trusted by 1+ million students worldwide

T test is the one of the most important tool that is used by the analysts to identify the
relationship between two independent variables (Lai, Zhu and Williams, (2017). It can be seen
from the table that level of significance is 0.00 which means that there is a significant difference
between the mean values of the variables. Mean value is 57 which means that on average basis
time taken by individuals to make payment is 57 days. Value of standard deviation is 1.62 and
this means that there is low deviation in the response given by the sample of 100 people from the
mean value. On this basis it can be said that average time taken by the number of people to make
payment is 57 days.
Paraphrase This Document
Need a fresh take? Get an instant paraphrase of this document with our AI Paraphraser

REFERENCES
Books and journals
Lai, G., Zhu, Z. and Williams, D. (2017). Enhance Students’ Learning in Business Statistics
Class Using Video Tutorials. Journal of Teaching and Learning with Technology, 6(1), 31-
44.
Books and journals
Lai, G., Zhu, Z. and Williams, D. (2017). Enhance Students’ Learning in Business Statistics
Class Using Video Tutorials. Journal of Teaching and Learning with Technology, 6(1), 31-
44.
1 out of 8
Related Documents
Your All-in-One AI-Powered Toolkit for Academic Success.
+13062052269
info@desklib.com
Available 24*7 on WhatsApp / Email
Unlock your academic potential
Copyright © 2020–2025 A2Z Services. All Rights Reserved. Developed and managed by ZUCOL.


