HI6007 Statistics Assignment: Hypothesis Testing and Regression

Verified

Added on  2023/06/03

|9
|776
|177
Homework Assignment
AI Summary
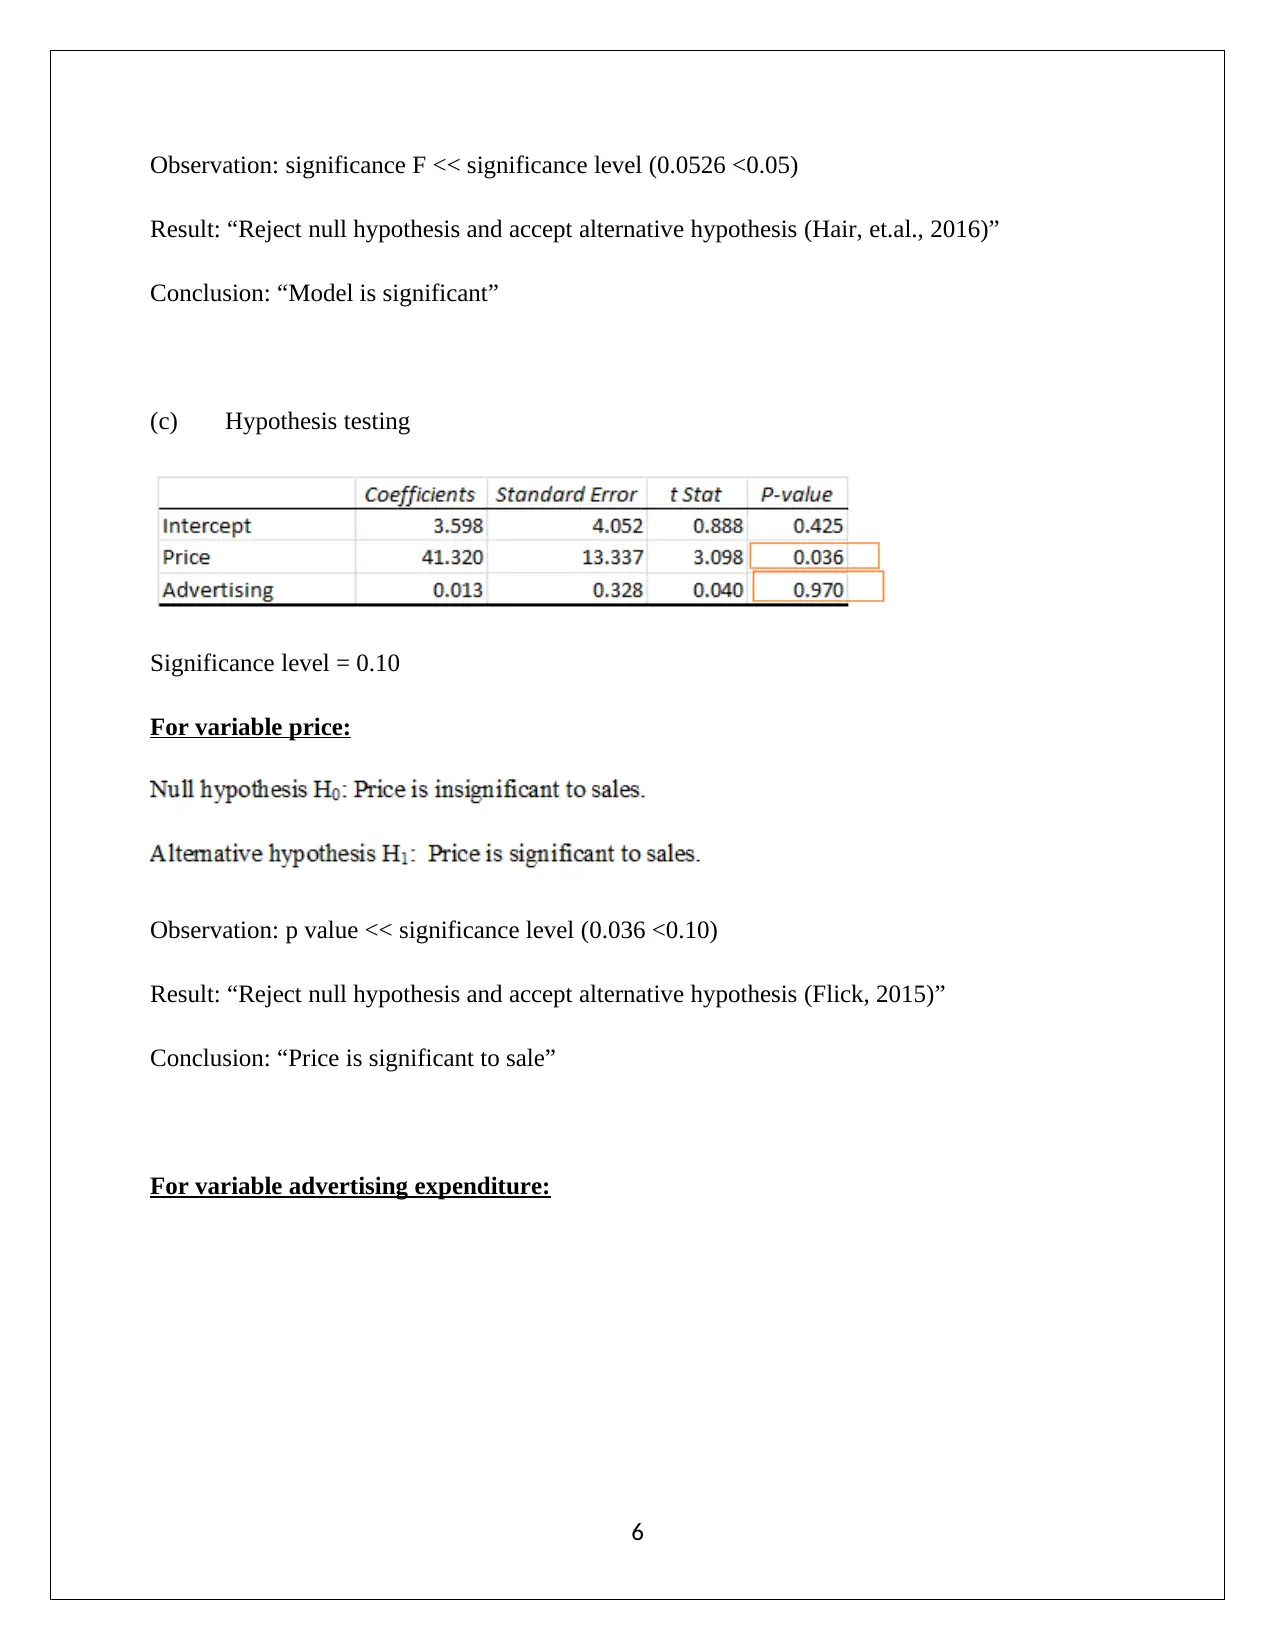
This assignment solution addresses a statistics problem set from Holmes Institute's HI6007 course. The solution begins with an analysis of examination scores, including the construction of frequency distributions (frequency, cumulative, relative, and percent), and a histogram to visualize the data's distribution, with comments on the observed shape. The second question delves into regression analysis, examining the relationship between supply and unit price, including hypothesis testing, R-squared and R values interpretation, and the formulation of a regression equation. The third question involves an ANOVA single-factor test to compare the means of four program groups. The final question presents a regression output, requiring the student to derive the least squares regression line, conduct hypothesis testing for model significance and individual variables (price and advertising expenditure), and construct a new model by eliminating the insignificant variable, interpreting the slope of the regression line. The solution incorporates references to relevant statistical resources.
Document Page
STATISTICS
Student Name
[Pick the date]
tabler-icon-diamond-filled.svg

Paraphrase This Document

Need a fresh take? Get an instant paraphrase of this document with our AI Paraphraser
Document Page
Question 1
(a) The frequency distribution of the examination score
(b) Histogram (examination score)
Comments:
Bell curve has not been observed
High variation has been observed
Presence of negative skew
Based on the above underling factors, it can be concluded that examination scores does not show
normal distribution (Harmon, 2016).
Question 2
1
Document Page
Supply dependent variable represents as Y
Unit price independent variable represented as X.
Normal view
Formula view
a. Sample size = 1 + (Degree of freedom) = 1 + (1+39) = 41
b. Null and alternative hypotheses
H0: βUnit price =0
H1: βUnit price 0
2
Document Page
The computed p value (0.175) is not lower than level of significance (0.05). Hence, insufficient
witnesses are present to reject H0 and to accept H1 (Harmon, 2016). Thereby, slope is termed as
insignificant and “unit price and supply is not correlated”.
(c) R square (Coefficient of correlation)
“The value of R square is quite less because only 4.8% changes in supply will be explained by
changes in unit price of the product. Therefore, model is not termed as good fit.”
(d) R (Coefficient of determination)
“The slope has positive (+ve) sign and thus, the applicable sign for R would also be positive.
Hence, R would be +0.219 (Hair, et.al., 2016). The value is quite less (lower than 0.5) and thus,
the association of the variable is low which is also evident from the hypothesis testing.”
(e) The regression equation can be furnished from the regression model.
The unit price is given as = $50,000 and thus, x (‘000) = 50
Further,
The supply obtained is 55.526 thousands units or 55526 units.
3
tabler-icon-diamond-filled.svg

Paraphrase This Document

Need a fresh take? Get an instant paraphrase of this document with our AI Paraphraser
Document Page
Question 3
ANOVA Single Factor Test
Hypothesis testing
H0 : μA =μB =μC=μD (Means are equal for all four programs)
H0 : At least one program group meanis not equal.
Significance level =0.05 (Given)
Test statistic (F value) = 6.14
P value (From above) = 0.006
Observation: P value<< significance level (0.006 <0.05)
Result: Reject null hypothesis and accept alternative hypothesis
Conclusion: “At least one program group mean is not equal”
4
Document Page
Question 4
(a) Regression output
Equation of least square regression line
(b) Hypotheses
Significance level = 0.10 (Given)
Test statistic (F) = 6.7168
Further, significance F = 0.0526
5
Document Page
Observation: significance F << significance level (0.0526 <0.05)
Result: “Reject null hypothesis and accept alternative hypothesis (Hair, et.al., 2016)”
Conclusion: “Model is significant”
(c) Hypothesis testing
Significance level = 0.10
For variable price:
Observation: p value << significance level (0.036 <0.10)
Result: “Reject null hypothesis and accept alternative hypothesis (Flick, 2015)
Conclusion: “Price is significant to sale”
For variable advertising expenditure:
6
tabler-icon-diamond-filled.svg

Paraphrase This Document

Need a fresh take? Get an instant paraphrase of this document with our AI Paraphraser
Document Page
Observation: p value >> significance level (0.97 >0.10)
Result: Fails to reject null hypothesis and thus, cannot accept alternative hypothesis
Conclusion: “Advertising expenditure is not significant to sale”
(d) The new model will be produced by eliminating the advertising expenses from the mode.
Equation of least square regression line
(e) “Slope indicates that when there is increase in price by $1 then the corresponding sale
would also increase by 41.60 units.”
7
Document Page
Reference
Flick, U. (2015) Introducing research methodology: A beginner's guide to doing a research
project. 4th ed. New York: Sage Publications.
Hair, J. F., Wolfinbarger, M., Money, A. H., Samouel, P., and Page, M. J. (2016) Essentials of
business research methods. 2nd ed. New York: Routledge.
Harmon, M. (2016) Hypothesis Testing in Excel - The Excel Statistical Master. 7th ed. Florida:
Mark Harmon.
8
chevron_up_icon
1 out of 9
circle_padding
hide_on_mobile
zoom_out_icon
[object Object]