7TRAN033W Statistics Coursework: Chi-Square Tests and Analysis

Verified

Added on  2023/05/29

|8
|1228
|238
Homework Assignment
AI Summary
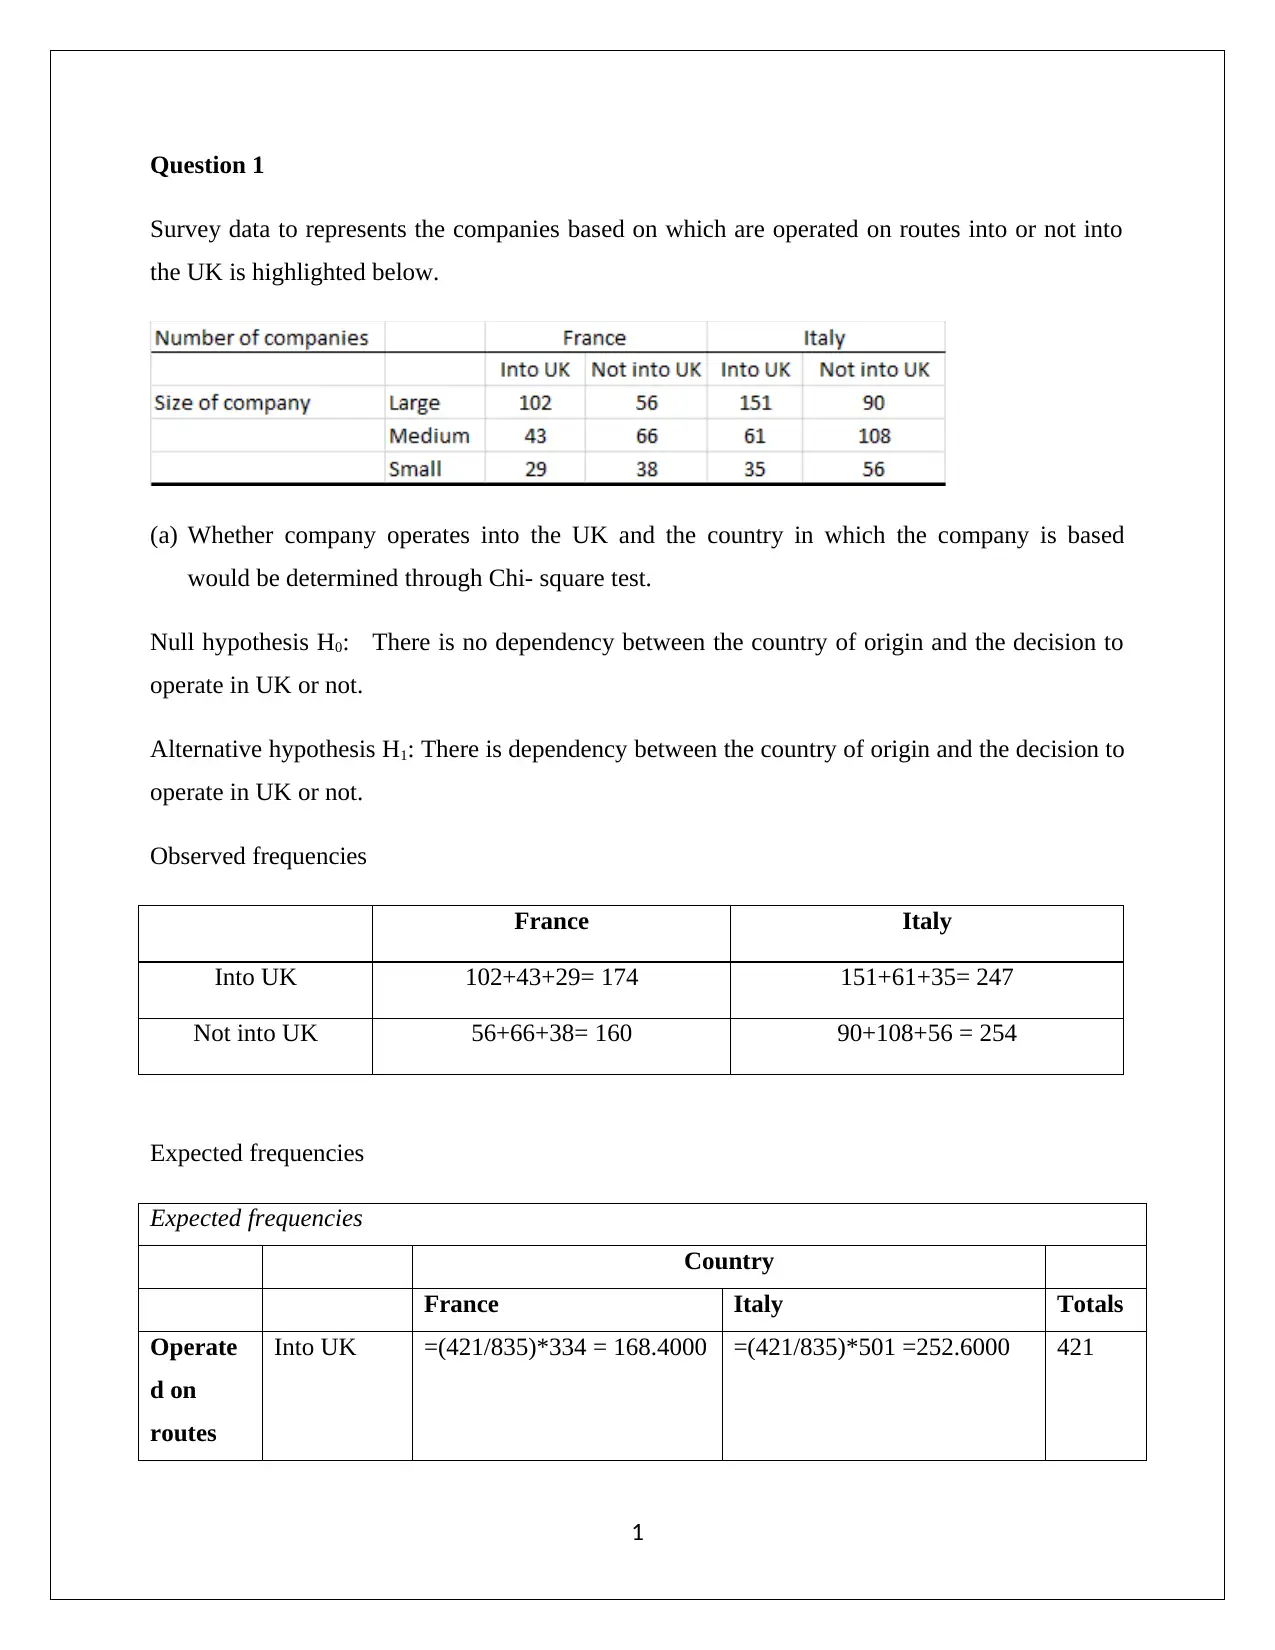
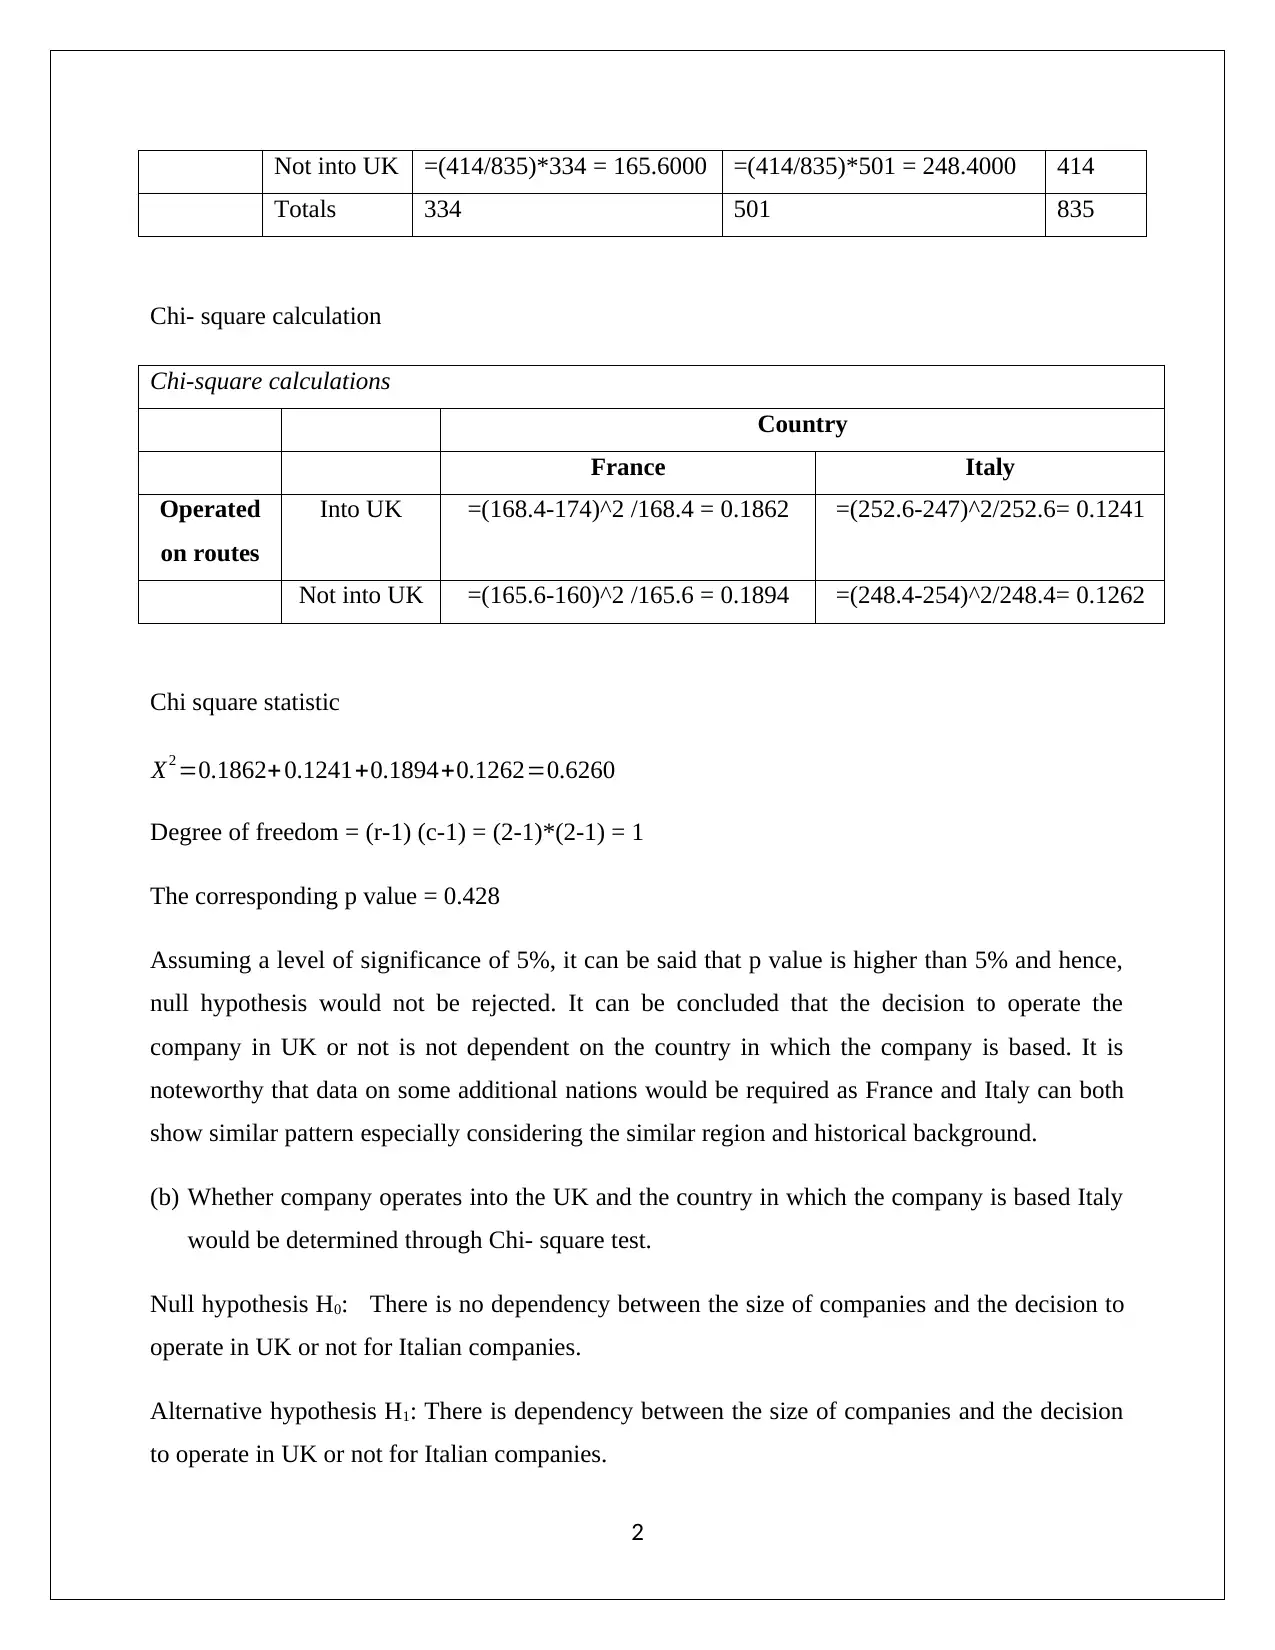
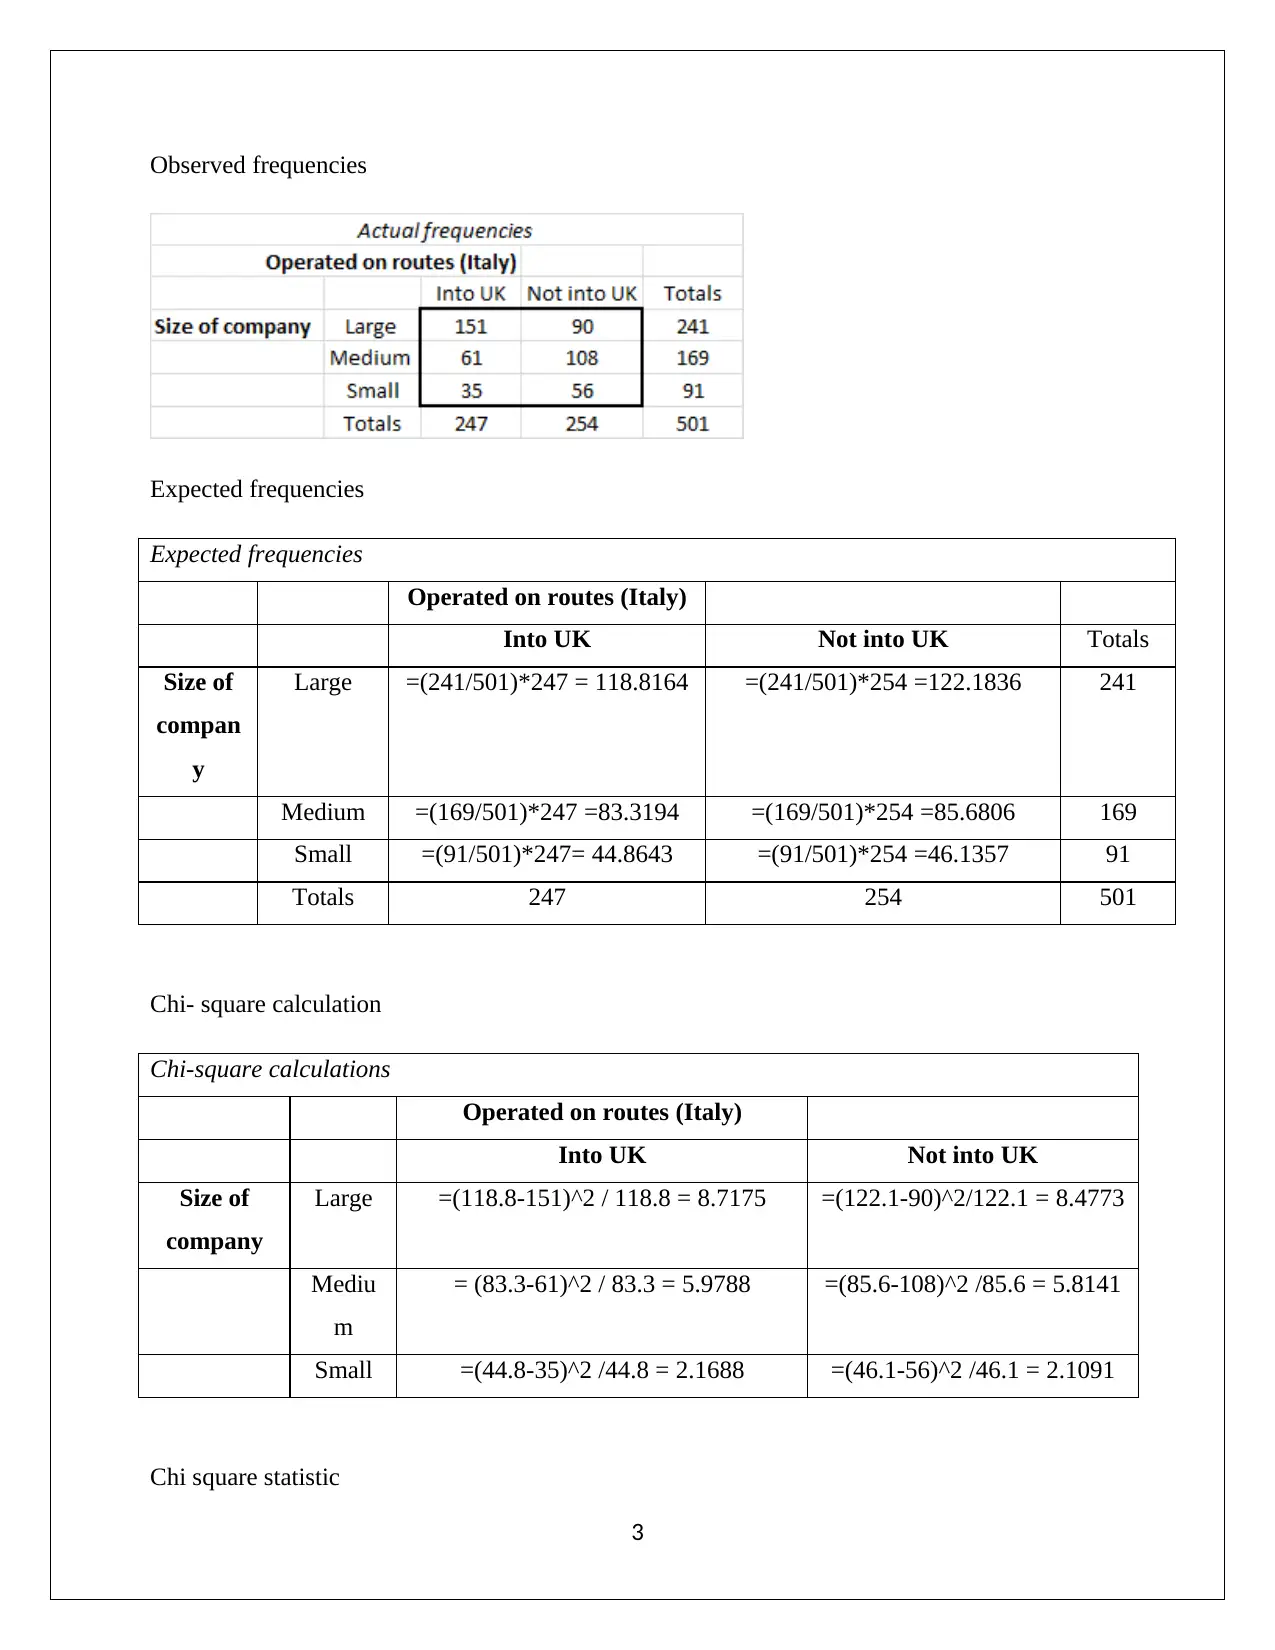
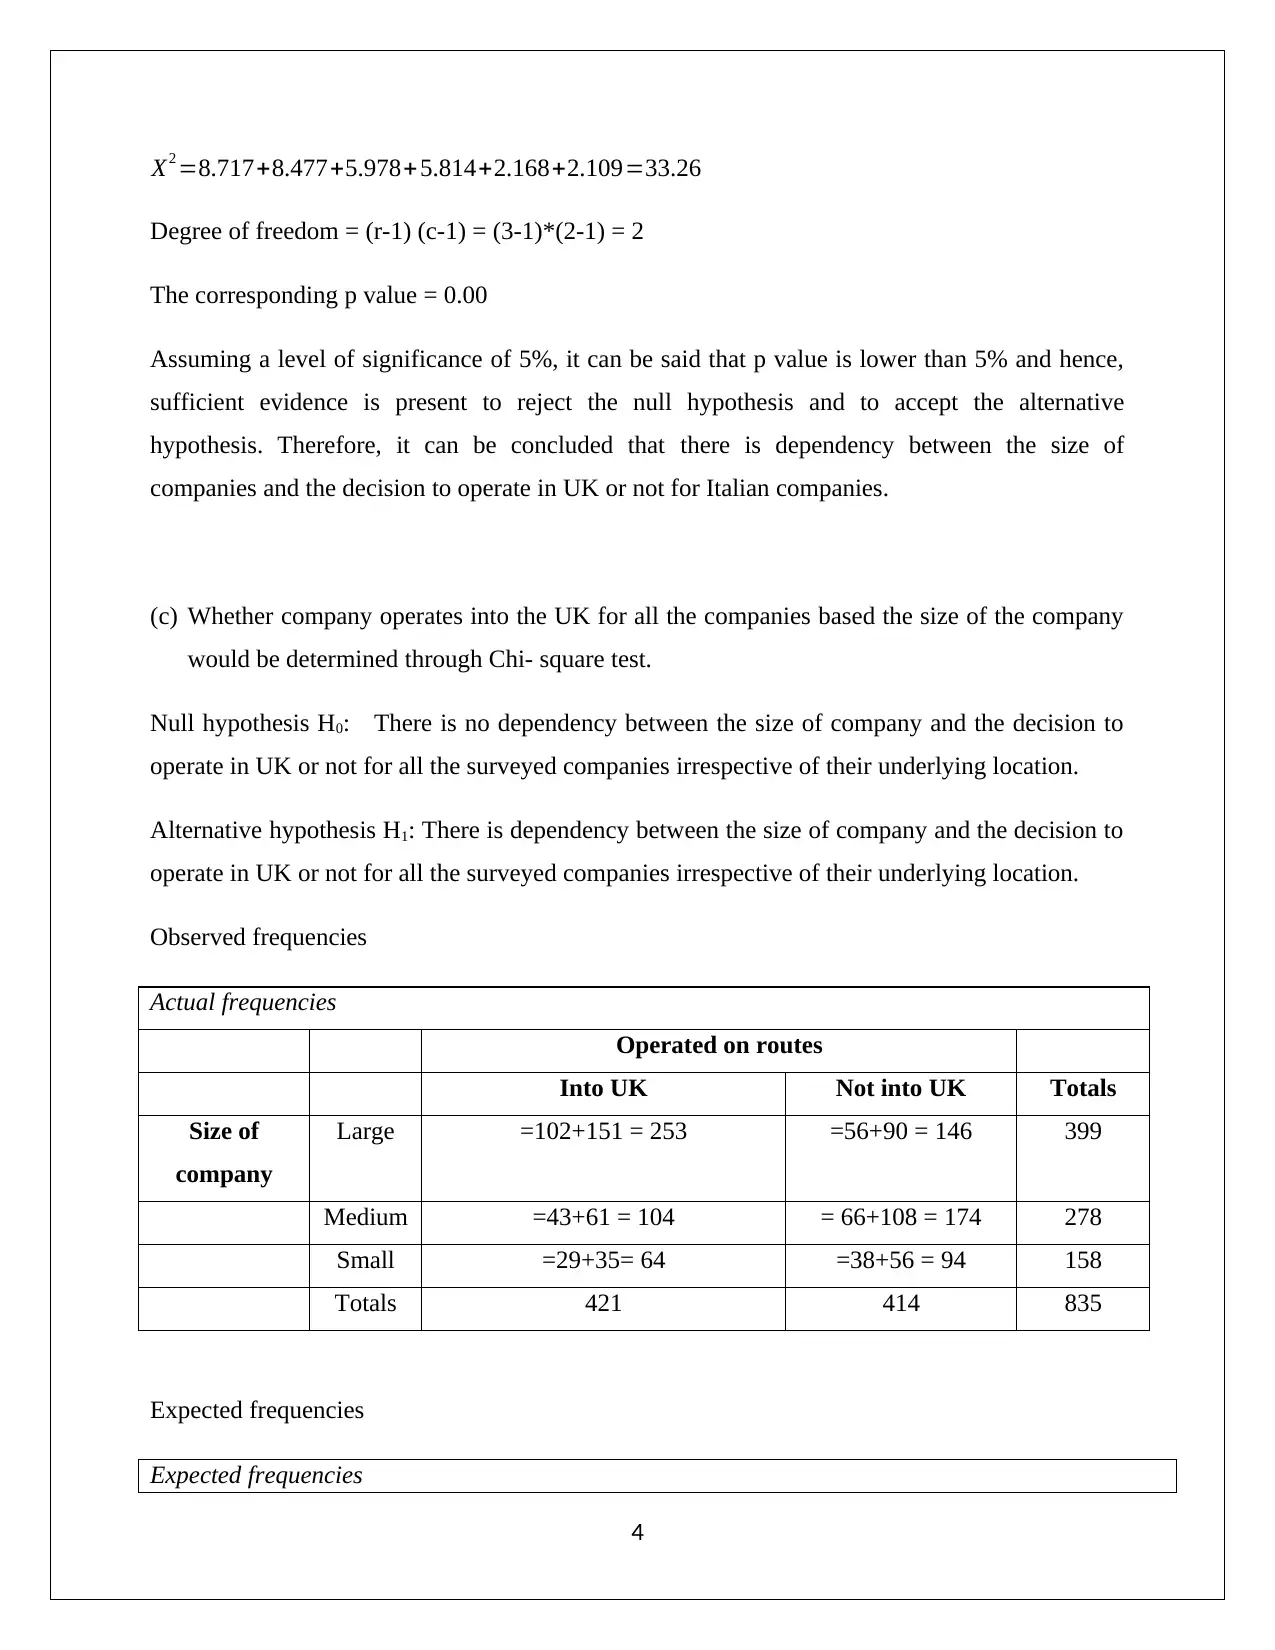
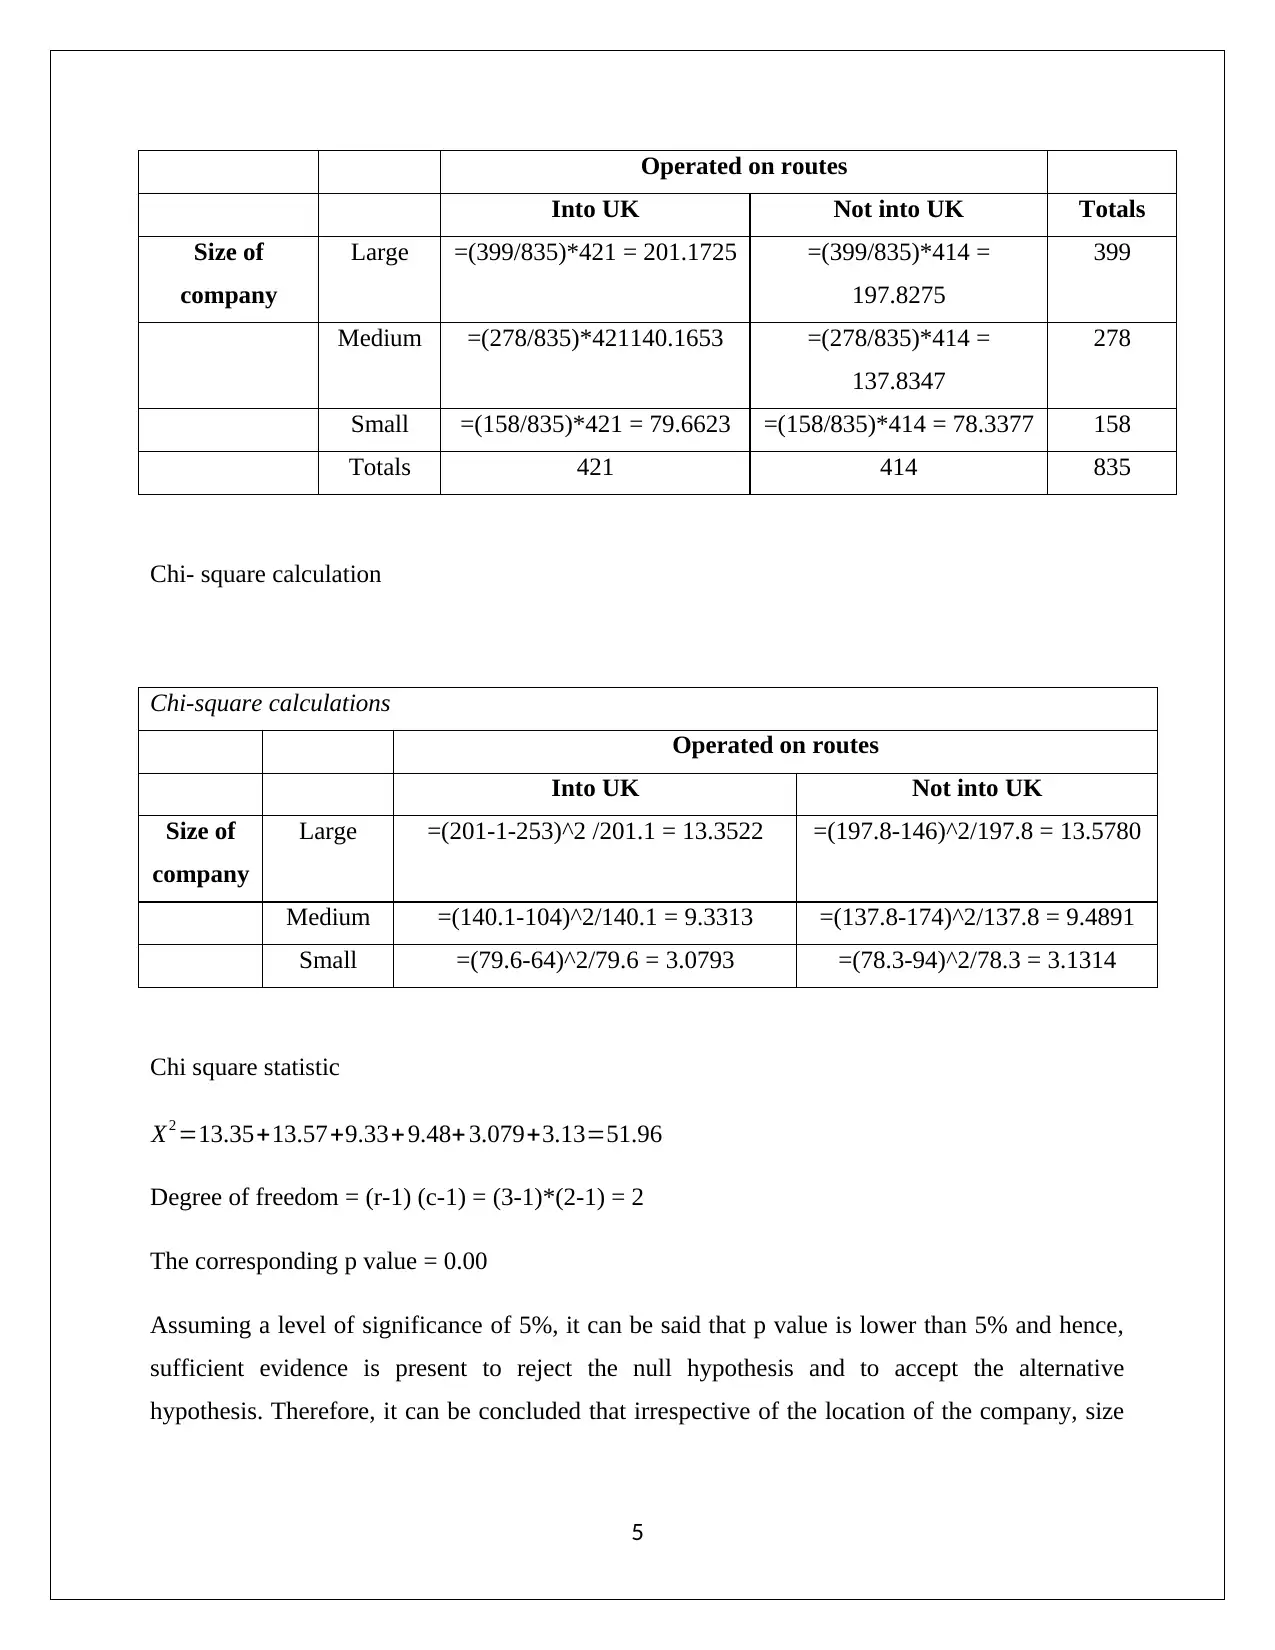
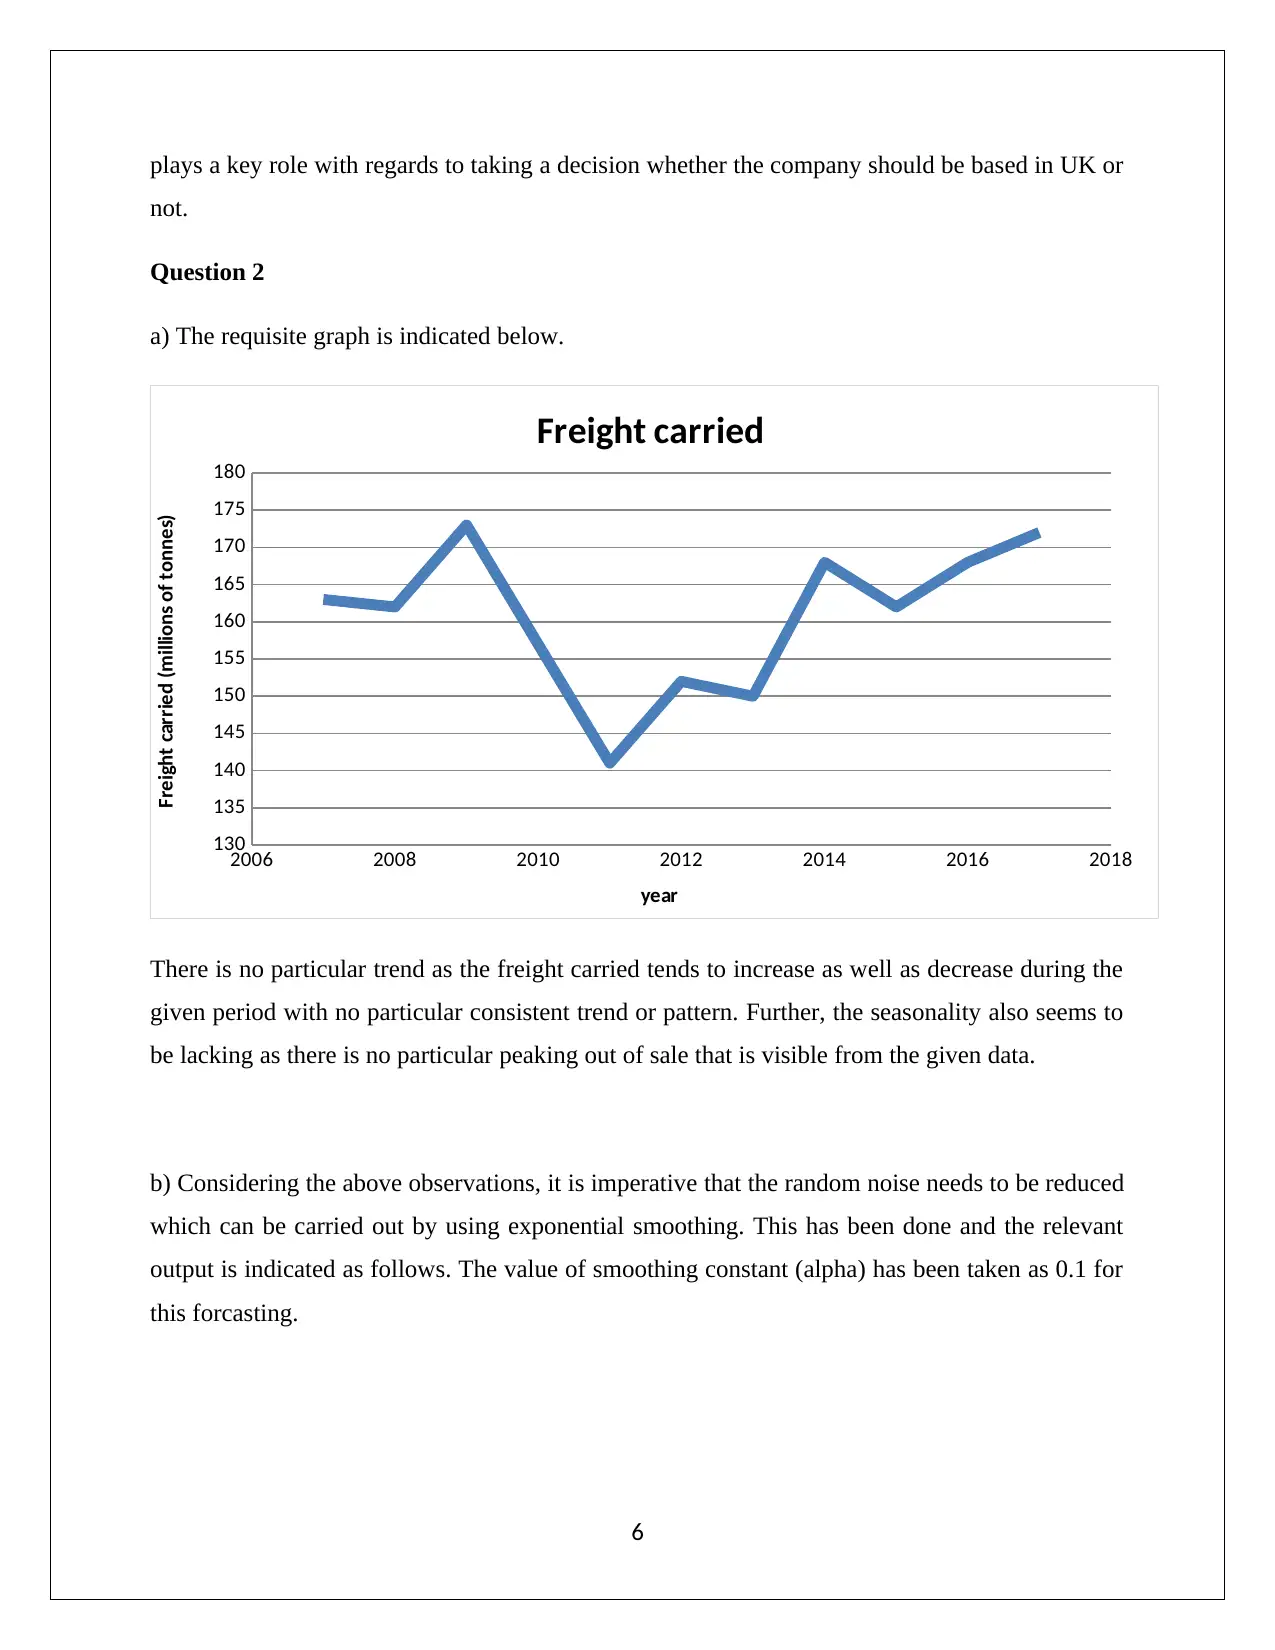
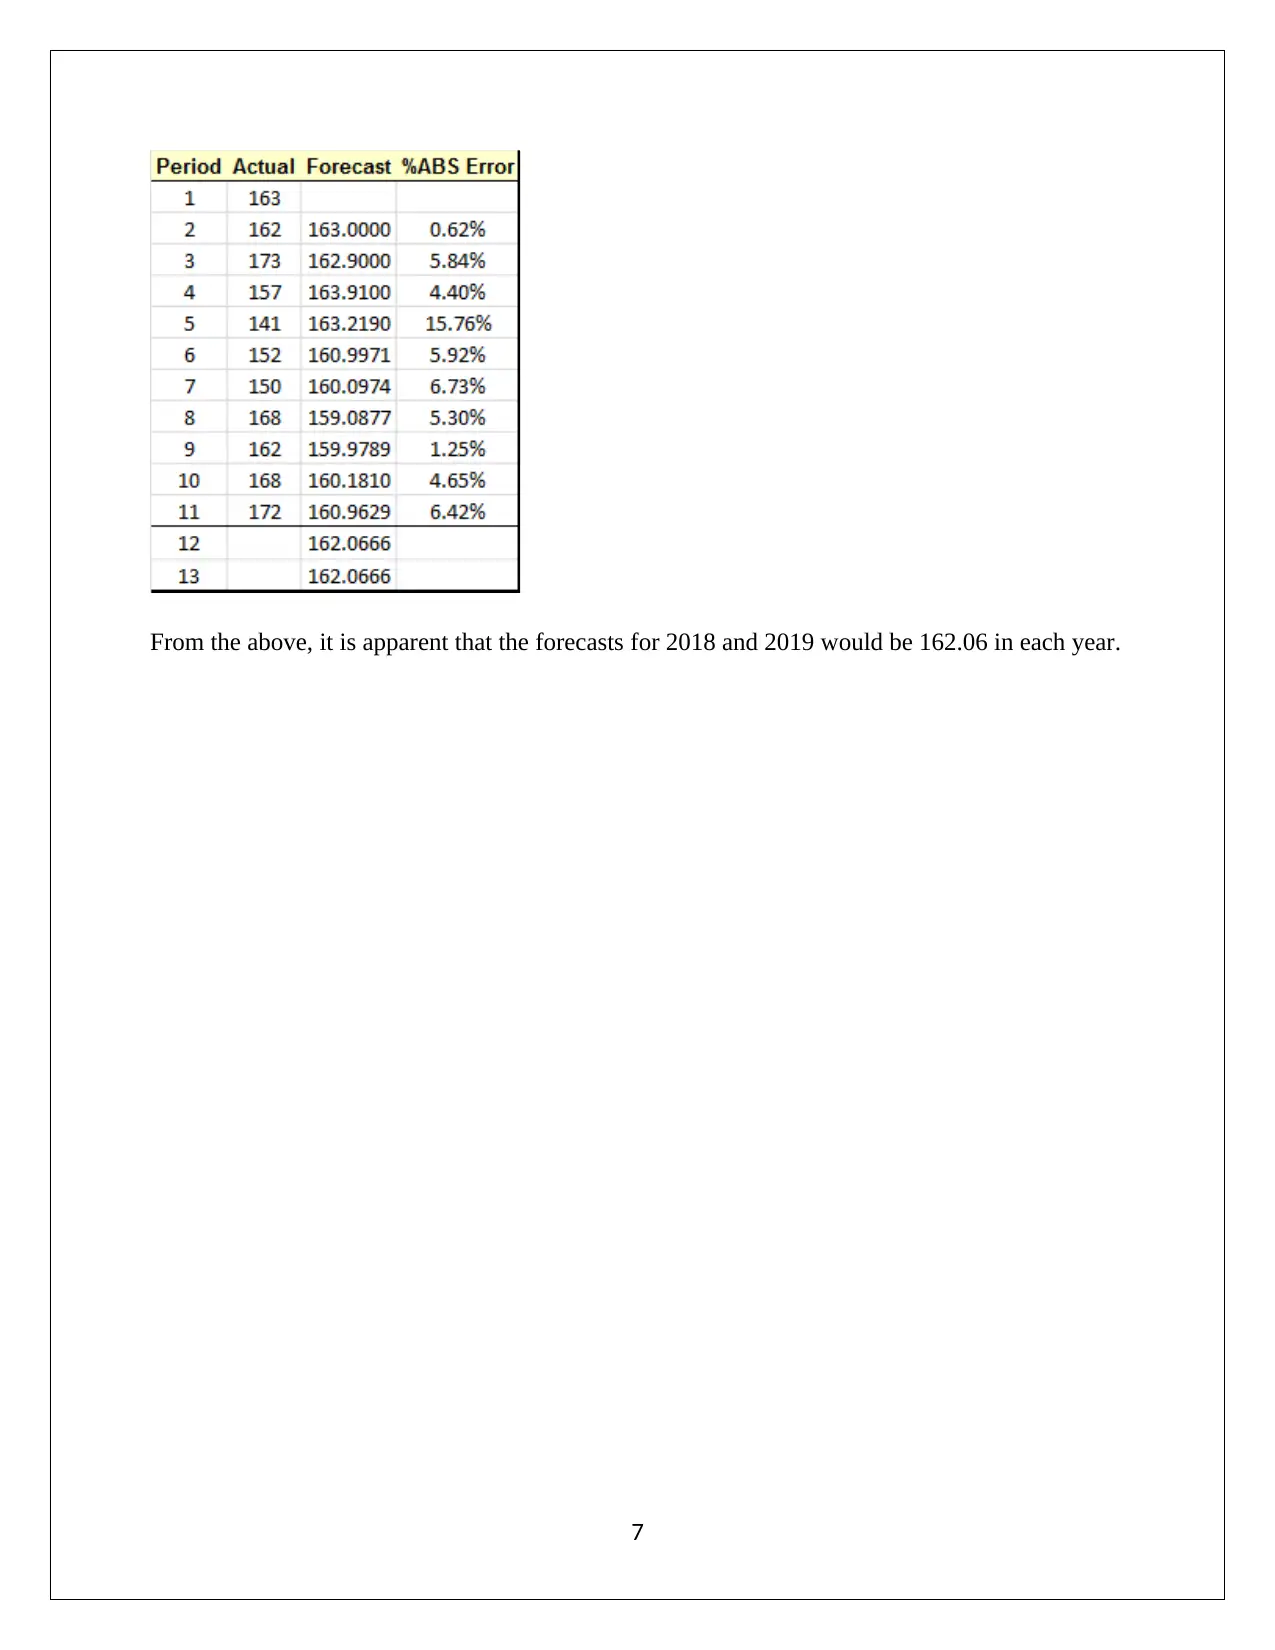
This document presents a complete solution to a statistics assignment that involves analyzing survey data using Chi-square tests. The assignment explores the association between a company's country of origin and its decision to operate in the UK, the relationship between company size and UK operations for Italian companies, and the general association between company size and UK operations across all surveyed companies. The solution includes the formulation of null and alternative hypotheses, observed and expected frequencies, Chi-square calculations, degrees of freedom, p-values, and conclusions based on a 5% significance level. Additionally, the assignment touches upon time series analysis, including the use of exponential smoothing to reduce random noise and forecast future values. Detailed calculations, interpretations, and relevant graphs are provided throughout the solution, offering a comprehensive understanding of the statistical methods applied.
Document Page
STATISTICS
STUDENT NAME/ID
[Pick the date]
tabler-icon-diamond-filled.svg

Paraphrase This Document

Need a fresh take? Get an instant paraphrase of this document with our AI Paraphraser
Document Page
Question 1
Survey data to represents the companies based on which are operated on routes into or not into
the UK is highlighted below.
(a) Whether company operates into the UK and the country in which the company is based
would be determined through Chi- square test.
Null hypothesis H0: There is no dependency between the country of origin and the decision to
operate in UK or not.
Alternative hypothesis H1: There is dependency between the country of origin and the decision to
operate in UK or not.
Observed frequencies
France Italy
Into UK 102+43+29= 174 151+61+35= 247
Not into UK 56+66+38= 160 90+108+56 = 254
Expected frequencies
Country
France Italy Totals
Operate
d on
routes
Into UK =(421/835)*334 = 168.4000 =(421/835)*501 =252.6000 421
1
Document Page
Not into UK =(414/835)*334 = 165.6000 =(414/835)*501 = 248.4000 414
Totals 334 501 835
Chi- square calculation
Chi-square calculations
Country
France Italy
Operated
on routes
Into UK =(168.4-174)^2 /168.4 = 0.1862 =(252.6-247)^2/252.6= 0.1241
Not into UK =(165.6-160)^2 /165.6 = 0.1894 =(248.4-254)^2/248.4= 0.1262
Chi square statistic
X2 =0.1862+ 0.1241+0.1894+0.1262=0.6260
Degree of freedom = (r-1) (c-1) = (2-1)*(2-1) = 1
The corresponding p value = 0.428
Assuming a level of significance of 5%, it can be said that p value is higher than 5% and hence,
null hypothesis would not be rejected. It can be concluded that the decision to operate the
company in UK or not is not dependent on the country in which the company is based. It is
noteworthy that data on some additional nations would be required as France and Italy can both
show similar pattern especially considering the similar region and historical background.
(b) Whether company operates into the UK and the country in which the company is based Italy
would be determined through Chi- square test.
Null hypothesis H0: There is no dependency between the size of companies and the decision to
operate in UK or not for Italian companies.
Alternative hypothesis H1: There is dependency between the size of companies and the decision
to operate in UK or not for Italian companies.
2
Document Page
Observed frequencies
Expected frequencies
Operated on routes (Italy)
Into UK Not into UK Totals
Size of
compan
y
Large =(241/501)*247 = 118.8164 =(241/501)*254 =122.1836 241
Medium =(169/501)*247 =83.3194 =(169/501)*254 =85.6806 169
Small =(91/501)*247= 44.8643 =(91/501)*254 =46.1357 91
Totals 247 254 501
Chi- square calculation
Chi-square calculations
Operated on routes (Italy)
Into UK Not into UK
Size of
company
Large =(118.8-151)^2 / 118.8 = 8.7175 =(122.1-90)^2/122.1 = 8.4773
Mediu
m
= (83.3-61)^2 / 83.3 = 5.9788 =(85.6-108)^2 /85.6 = 5.8141
Small =(44.8-35)^2 /44.8 = 2.1688 =(46.1-56)^2 /46.1 = 2.1091
Chi square statistic
3
tabler-icon-diamond-filled.svg

Paraphrase This Document

Need a fresh take? Get an instant paraphrase of this document with our AI Paraphraser
Document Page
X2 =8.717+8.477+5.978+ 5.814+2.168+2.109=33.26
Degree of freedom = (r-1) (c-1) = (3-1)*(2-1) = 2
The corresponding p value = 0.00
Assuming a level of significance of 5%, it can be said that p value is lower than 5% and hence,
sufficient evidence is present to reject the null hypothesis and to accept the alternative
hypothesis. Therefore, it can be concluded that there is dependency between the size of
companies and the decision to operate in UK or not for Italian companies.
(c) Whether company operates into the UK for all the companies based the size of the company
would be determined through Chi- square test.
Null hypothesis H0: There is no dependency between the size of company and the decision to
operate in UK or not for all the surveyed companies irrespective of their underlying location.
Alternative hypothesis H1: There is dependency between the size of company and the decision to
operate in UK or not for all the surveyed companies irrespective of their underlying location.
Observed frequencies
Actual frequencies
Operated on routes
Into UK Not into UK Totals
Size of
company
Large =102+151 = 253 =56+90 = 146 399
Medium =43+61 = 104 = 66+108 = 174 278
Small =29+35= 64 =38+56 = 94 158
Totals 421 414 835
Expected frequencies
4
Document Page
Operated on routes
Into UK Not into UK Totals
Size of
company
Large =(399/835)*421 = 201.1725 =(399/835)*414 =
197.8275
399
Medium =(278/835)*421140.1653 =(278/835)*414 =
137.8347
278
Small =(158/835)*421 = 79.6623 =(158/835)*414 = 78.3377 158
Totals 421 414 835
Chi- square calculation
Chi-square calculations
Operated on routes
Into UK Not into UK
Size of
company
Large =(201-1-253)^2 /201.1 = 13.3522 =(197.8-146)^2/197.8 = 13.5780
Medium =(140.1-104)^2/140.1 = 9.3313 =(137.8-174)^2/137.8 = 9.4891
Small =(79.6-64)^2/79.6 = 3.0793 =(78.3-94)^2/78.3 = 3.1314
Chi square statistic
X2 =13.35+13.57+9.33+ 9.48+ 3.079+3.13=51.96
Degree of freedom = (r-1) (c-1) = (3-1)*(2-1) = 2
The corresponding p value = 0.00
Assuming a level of significance of 5%, it can be said that p value is lower than 5% and hence,
sufficient evidence is present to reject the null hypothesis and to accept the alternative
hypothesis. Therefore, it can be concluded that irrespective of the location of the company, size
5
Document Page
plays a key role with regards to taking a decision whether the company should be based in UK or
not.
Question 2
a) The requisite graph is indicated below.
2006 2008 2010 2012 2014 2016 2018
130
135
140
145
150
155
160
165
170
175
180
Freight carried
year
Freight carried (millions of tonnes)
There is no particular trend as the freight carried tends to increase as well as decrease during the
given period with no particular consistent trend or pattern. Further, the seasonality also seems to
be lacking as there is no particular peaking out of sale that is visible from the given data.
b) Considering the above observations, it is imperative that the random noise needs to be reduced
which can be carried out by using exponential smoothing. This has been done and the relevant
output is indicated as follows. The value of smoothing constant (alpha) has been taken as 0.1 for
this forcasting.
6
tabler-icon-diamond-filled.svg

Paraphrase This Document

Need a fresh take? Get an instant paraphrase of this document with our AI Paraphraser
Document Page
From the above, it is apparent that the forecasts for 2018 and 2019 would be 162.06 in each year.
7
chevron_up_icon
1 out of 8
circle_padding
hide_on_mobile
zoom_out_icon
[object Object]