Statistics for Business STA101: Assignment 1 Analysis and Solutions

Verified

Added on  2023/04/21

|8
|1593
|240
Homework Assignment
AI Summary
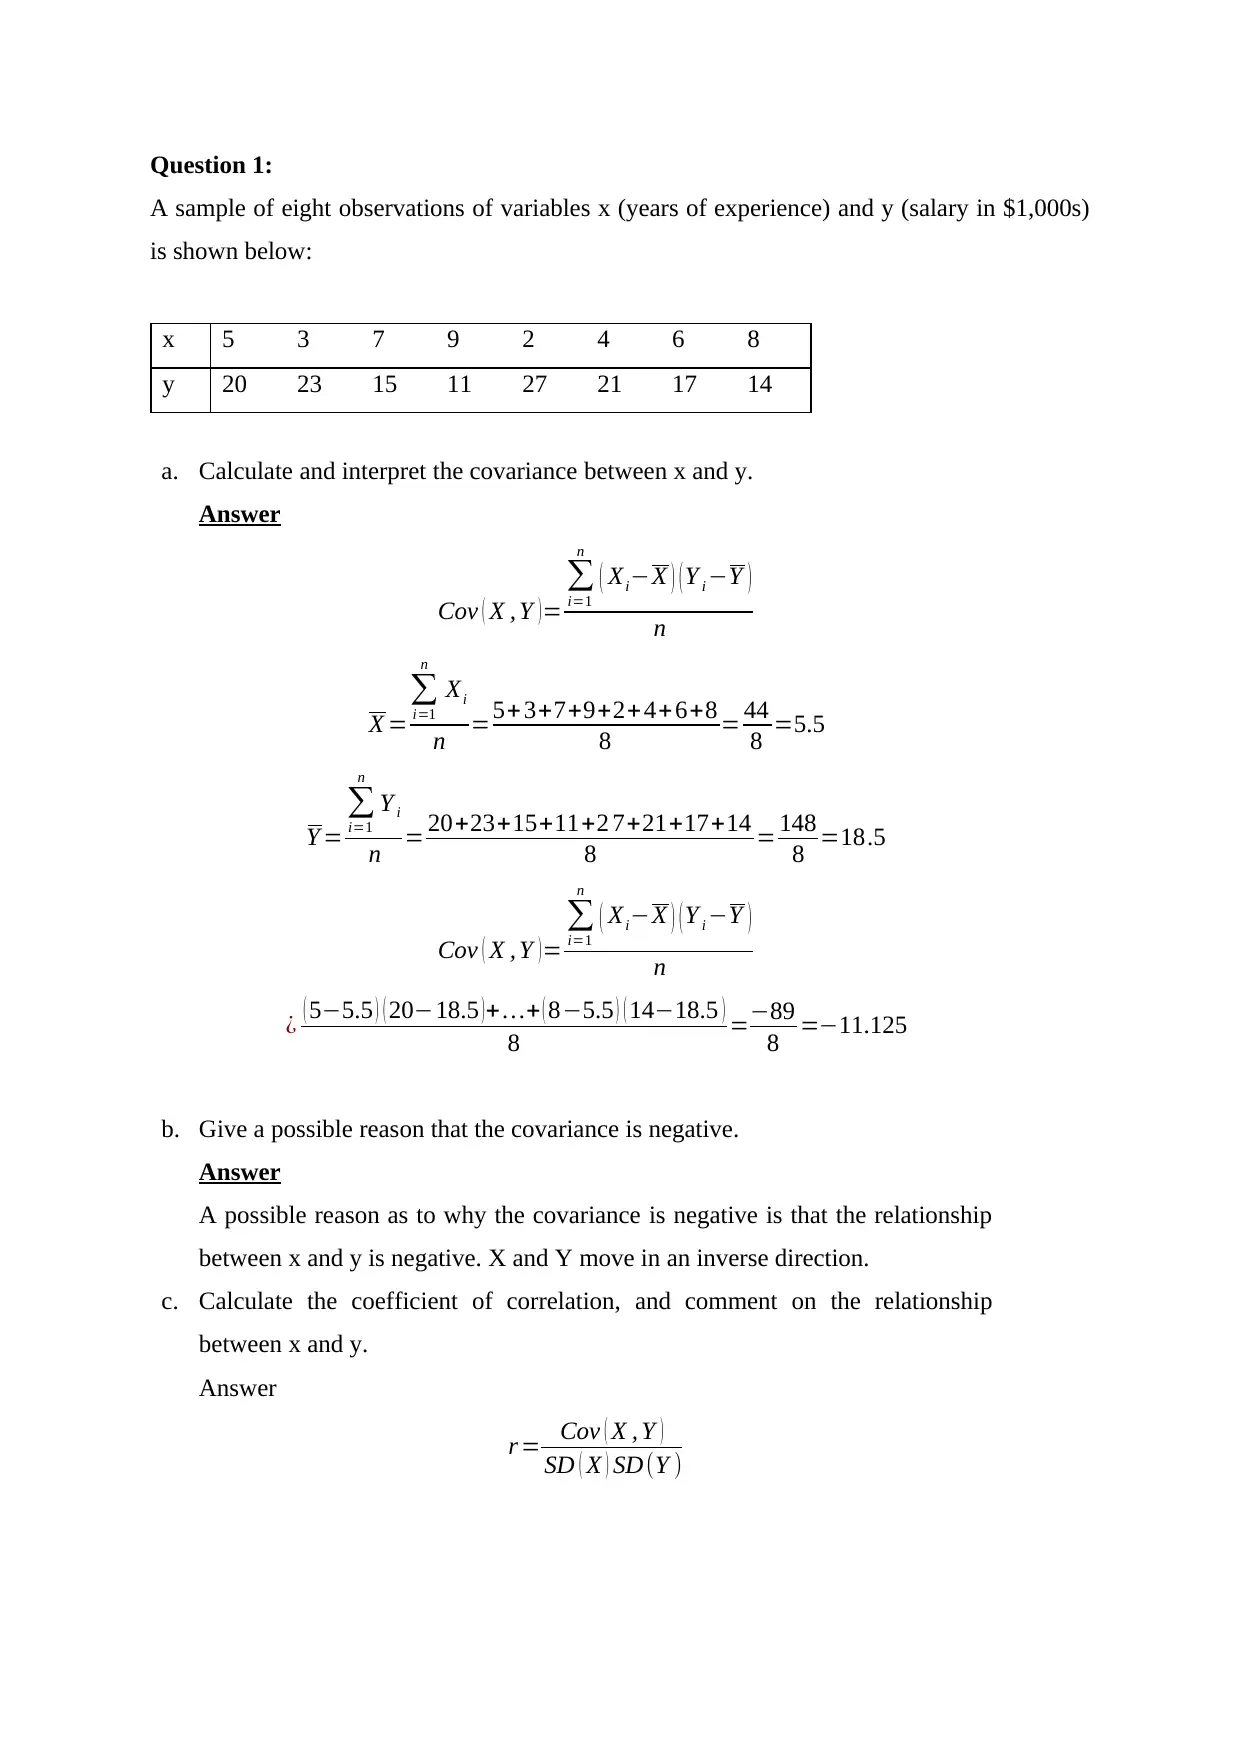
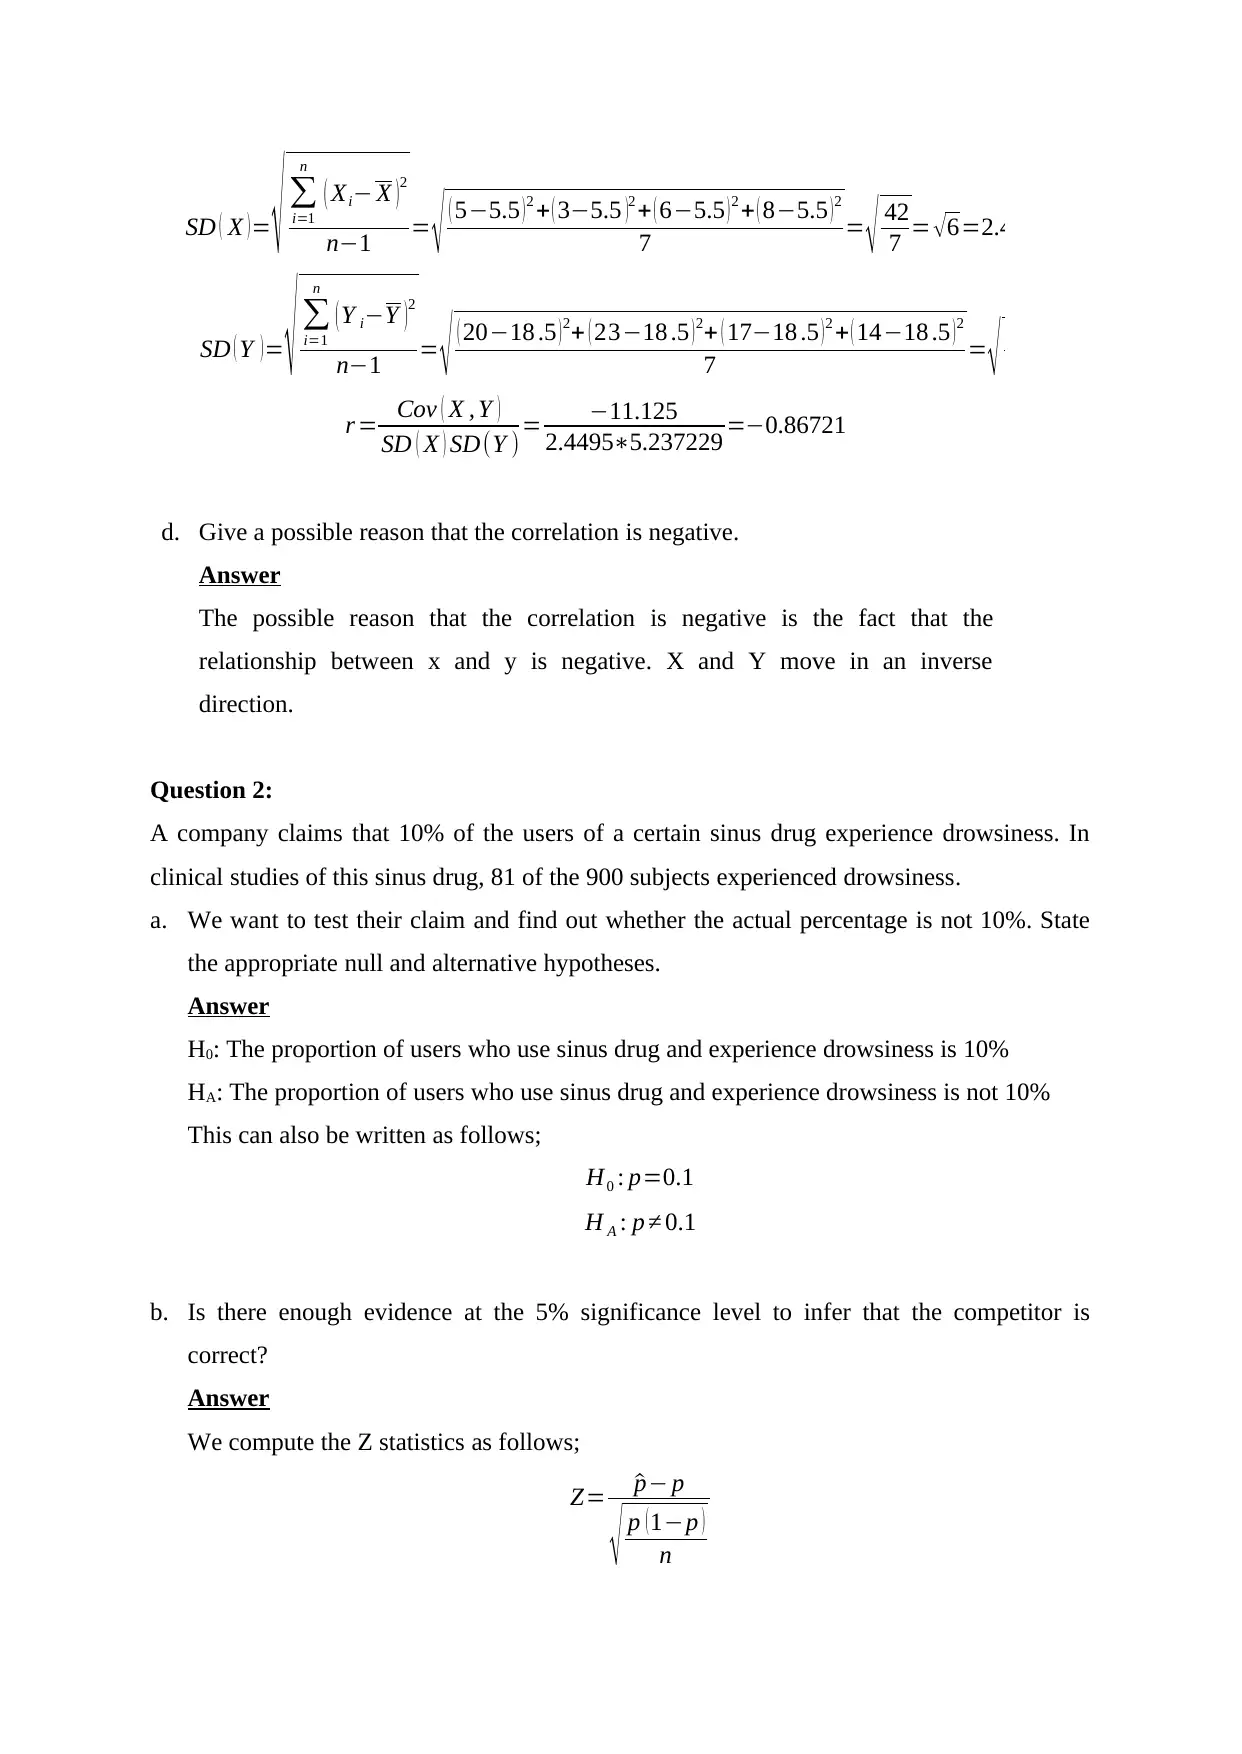
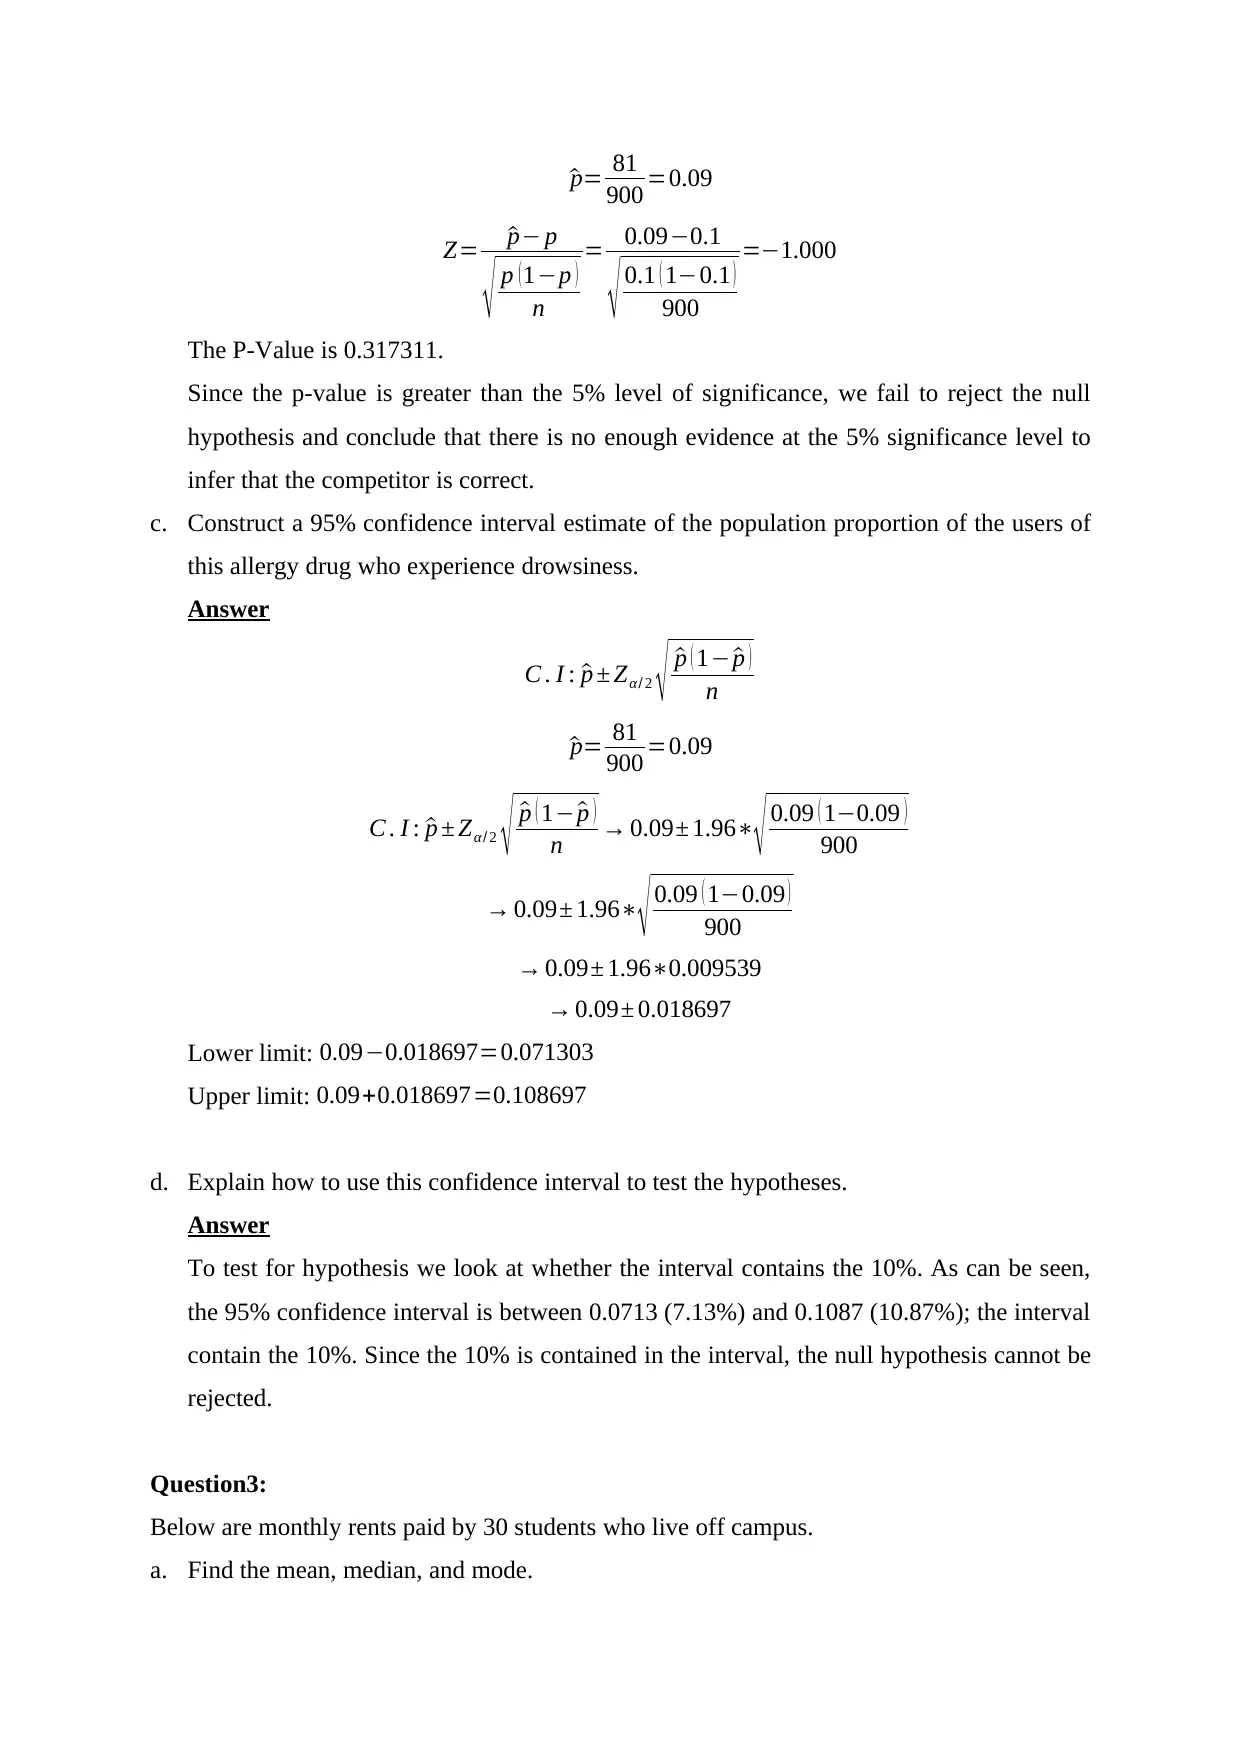
This document presents a comprehensive solution to Assignment 1 for the STA101 Statistics for Business course. The solution encompasses a range of statistical concepts, including covariance and correlation analysis of sample data, hypothesis testing to determine if the actual percentage of users experiencing drowsiness from a sinus drug differs from a company's claim, construction of confidence intervals, and interpretation. Further, the assignment addresses measures of central tendency (mean, median, and mode) and dispersion, identifying outliers and unusual data values, and evaluating whether the data aligns with the empirical rule for a normal distribution. Finally, the solution explores probability calculations related to on-time delivery rates of messenger services, including conditional probabilities and the application of Bayes' theorem to determine probabilities of events given new information.
Document Page
Assessment 1 - Assignment
Unit:STA101 – Statistics for Business
Student Name:
Student Number:
Course Instructor:
Date: 19th January 2019
tabler-icon-diamond-filled.svg

Paraphrase This Document

Need a fresh take? Get an instant paraphrase of this document with our AI Paraphraser
Document Page
Question 1:
A sample of eight observations of variables x (years of experience) and y (salary in $1,000s)
is shown below:
x 5 3 7 9 2 4 6 8
y 20 23 15 11 27 21 17 14
a. Calculate and interpret the covariance between x and y.
Answer
Cov ( X , Y )=

i=1
n
( XiX ) ( Y i Y )
n
X =

i=1
n
Xi
n =5+3+7+9+2+4+ 6+8
8 = 44
8 =5.5
Y =

i=1
n
Y i
n = 20+23+15+11+2 7+21+17+14
8 = 148
8 =18.5
Cov ( X , Y ) =

i=1
n
( XiX ) ( Y i Y )
n
¿ ( 55.5 ) ( 2018.5 )+ + ( 85.5 ) ( 1418.5 )
8 =89
8 =11.125
b. Give a possible reason that the covariance is negative.
Answer
A possible reason as to why the covariance is negative is that the relationship
between x and y is negative. X and Y move in an inverse direction.
c. Calculate the coefficient of correlation, and comment on the relationship
between x and y.
Answer
r = Cov ( X , Y )
SD ( X ) SD(Y )
Document Page
SD ( X ) =
i=1
n
( Xi X )
2
n1 = ( 55.5 ) 2 + ( 35.5 )2 + ( 65.5 ) 2 + ( 85.5 ) 2
7 = 42
7 = 6=2.4495
SD ( Y ) =
i=1
n
( Y iY )
2
n1 = ( 2018 .5 ) 2+ ( 2318 .5 ) 2+ ( 1718 .5 ) 2 + ( 1418 .5 ) 2
7 = 19 2
7 = 27.42857=5.23
r = Cov ( X , Y )
SD ( X ) SD(Y )= 11.125
2.44955.237229 =0.86721
d. Give a possible reason that the correlation is negative.
Answer
The possible reason that the correlation is negative is the fact that the
relationship between x and y is negative. X and Y move in an inverse
direction.
Question 2:
A company claims that 10% of the users of a certain sinus drug experience drowsiness. In
clinical studies of this sinus drug, 81 of the 900 subjects experienced drowsiness.
a. We want to test their claim and find out whether the actual percentage is not 10%. State
the appropriate null and alternative hypotheses.
Answer
H0: The proportion of users who use sinus drug and experience drowsiness is 10%
HA: The proportion of users who use sinus drug and experience drowsiness is not 10%
This can also be written as follows;
H0 : p=0.1
H A : p 0.1
b. Is there enough evidence at the 5% significance level to infer that the competitor is
correct?
Answer
We compute the Z statistics as follows;
Z= ^p p
p ( 1p )
n
Document Page
^p= 81
900 =0.09
Z= ^p p
p (1p )
n
= 0.090.1
0.1 ( 10.1 )
900
=1.000
The P-Value is 0.317311.
Since the p-value is greater than the 5% level of significance, we fail to reject the null
hypothesis and conclude that there is no enough evidence at the 5% significance level to
infer that the competitor is correct.
c. Construct a 95% confidence interval estimate of the population proportion of the users of
this allergy drug who experience drowsiness.
Answer
C . I : ^p ± Zα/ 2 ^p ( 1 ^p )
n
^p= 81
900 =0.09
C . I : ^p ± Zα/ 2 ^p ( 1 ^p )
n 0.09± 1.96
0.09 ( 10.09 )
900
0.09± 1.96
0.09 ( 10.09 )
900
0.09± 1.960.009539
0.09± 0.018697
Lower limit: 0.090.018697=0.071303
Upper limit: 0.09+0.018697=0.108697
d. Explain how to use this confidence interval to test the hypotheses.
Answer
To test for hypothesis we look at whether the interval contains the 10%. As can be seen,
the 95% confidence interval is between 0.0713 (7.13%) and 0.1087 (10.87%); the interval
contain the 10%. Since the 10% is contained in the interval, the null hypothesis cannot be
rejected.
Question3:
Below are monthly rents paid by 30 students who live off campus.
a. Find the mean, median, and mode.
tabler-icon-diamond-filled.svg

Paraphrase This Document

Need a fresh take? Get an instant paraphrase of this document with our AI Paraphraser
Document Page
Answer
Mean , x=

i=1
n
xi
n = 730+730++720+700
30 = 21740
30 =725
Median= 15 thvalue+16 th value
2 = 720+720
2 = 1440
2 =720
Mode=most frequent=730
b. Do the measures of central tendency agree? Explain.
Answer
Yes the measures of central tendency seem to agree. This is because the values for the
three measures are almost equal hence we conclude that they agree.
c. Calculate the standard deviation.
Answer
SD=
i=1
n
( xi x )2
n1 = ( 730725 )2+ (730725 )2 ++ ( 720725 )2 + ( 70 0725 )2
301 = 378750
29 = 13060.34=1
d. Are there outliers or unusual data values?
Answer
We compute the inner fences
Q1=662.5
Q3=755.0
Interquartile range ( IQR ) =Q3Q1 755.0662.5=92.5
Upper boundary: 755.0+1.592.5=893.75
Lower boundary: 662.51.592.5=523.75
Values such as 1030, 930 and 500 are outside the boundary hence they can be regarded as
outliers or unusual data values. Thus we can confidently say that there are outliers or
unusual data values.
e. Using the Empirical Rule, do you think the data could be from a normal population?
Answer
μ ±1 SD
725 ±1114.2814
725114.2814=610.7186
Document Page
725+114.2814=839.2814
From the data, 70% fall within one standard deviation of the mean.
μ ±2 SD
725 ±2114.2814
725228.5628=496.4372
725+228.5628=953.5628
From the data, 96.7% fall within two standard deviation of the mean.
μ ±3 SD
725 ±3114.2814
725342.8442=382.1558
725+342.8442=1067.8442
From the data, 100.0% fall within three standard deviation of the mean.
According to the empirical rule it is supposed to be 68-95-99 7. Where 68% of the data
fall with one standard deviation of the mean; 95% fall within two standard deviation of
the mean and 99.7% fall within three standard deviation of the mean. Since the data is not
from the empirical rule, the give dataset can be thought of following a normal
distribution.
730 730 730 930 700 570
690 1,030 740 620 720 670
560 740 650 660 850 930
600 620 760 690 710 500
730 800 820 840 720 700
Question 4:
Three messenger services deliver to a small town in Oregon. Service A has 60% of all the
scheduled deliveries, service B has 30%, and service C has the remaining 10%. Their on-time
rates are 80%, 60%, and 40% respectively. Define event O as a service delivers a package on
time.
a. Calculate P(A and O).
Document Page
Answer
P ( AO ) =P ( A ) P ( O|A )=0.60.8=0.48
b. Calculate the probability that a package was delivered on time.
Answer
P(O)=P(OA )+P(OB)+ P(OC)
¿ P( A)P (O A)+ P(B)P(OB)+P(C)P (OC)
¿ 0.60.8+0.30.6+ 0.10.4=0.48+ 0.18+0.04
¿ 0.7=70 %
Thus probability that a package was delivered on time is 70% (0.7).
c. If a package was delivered on time, what is the probability that it was service A?
Answer
P( AO)= P( AO)
P(O)
¿ P (O A)P( A)
P (O)
¿ 0.80.6
0.7
¿ 0.686=68.6 %
d. If a package was delivered 40 minutes late, what is the probability that it was service B?
Answer
P( BO )= P(BO )
P(O )
¿ P (O B)P(B)
P (O )
¿ (1P (OB))P (B)
(1P(O))
tabler-icon-diamond-filled.svg

Paraphrase This Document

Need a fresh take? Get an instant paraphrase of this document with our AI Paraphraser
Document Page
¿ (10.6)0.3
(10.7)
¿ 0.40.3
0.3
¿ 0.4=40 %
e. If a package was delivered 40 minutes late, what is the probability that it was service C?
Answer
P(CO )= P(CO )
P(O )
¿ P (O C)P(C)
P(O )
¿( 1P(OC ))P (C)¿ ¿
(1P(O))
¿ (10.4)0.1
( 10.7)
¿ 0.60.1
0.3
¿ 0.2=20 %
chevron_up_icon
1 out of 8
circle_padding
hide_on_mobile
zoom_out_icon
[object Object]