Comprehensive Analysis: Statistics HI6007 Assignment on Data Analysis

Verified

Added on  2023/06/10

|9
|914
|153
Homework Assignment
AI Summary
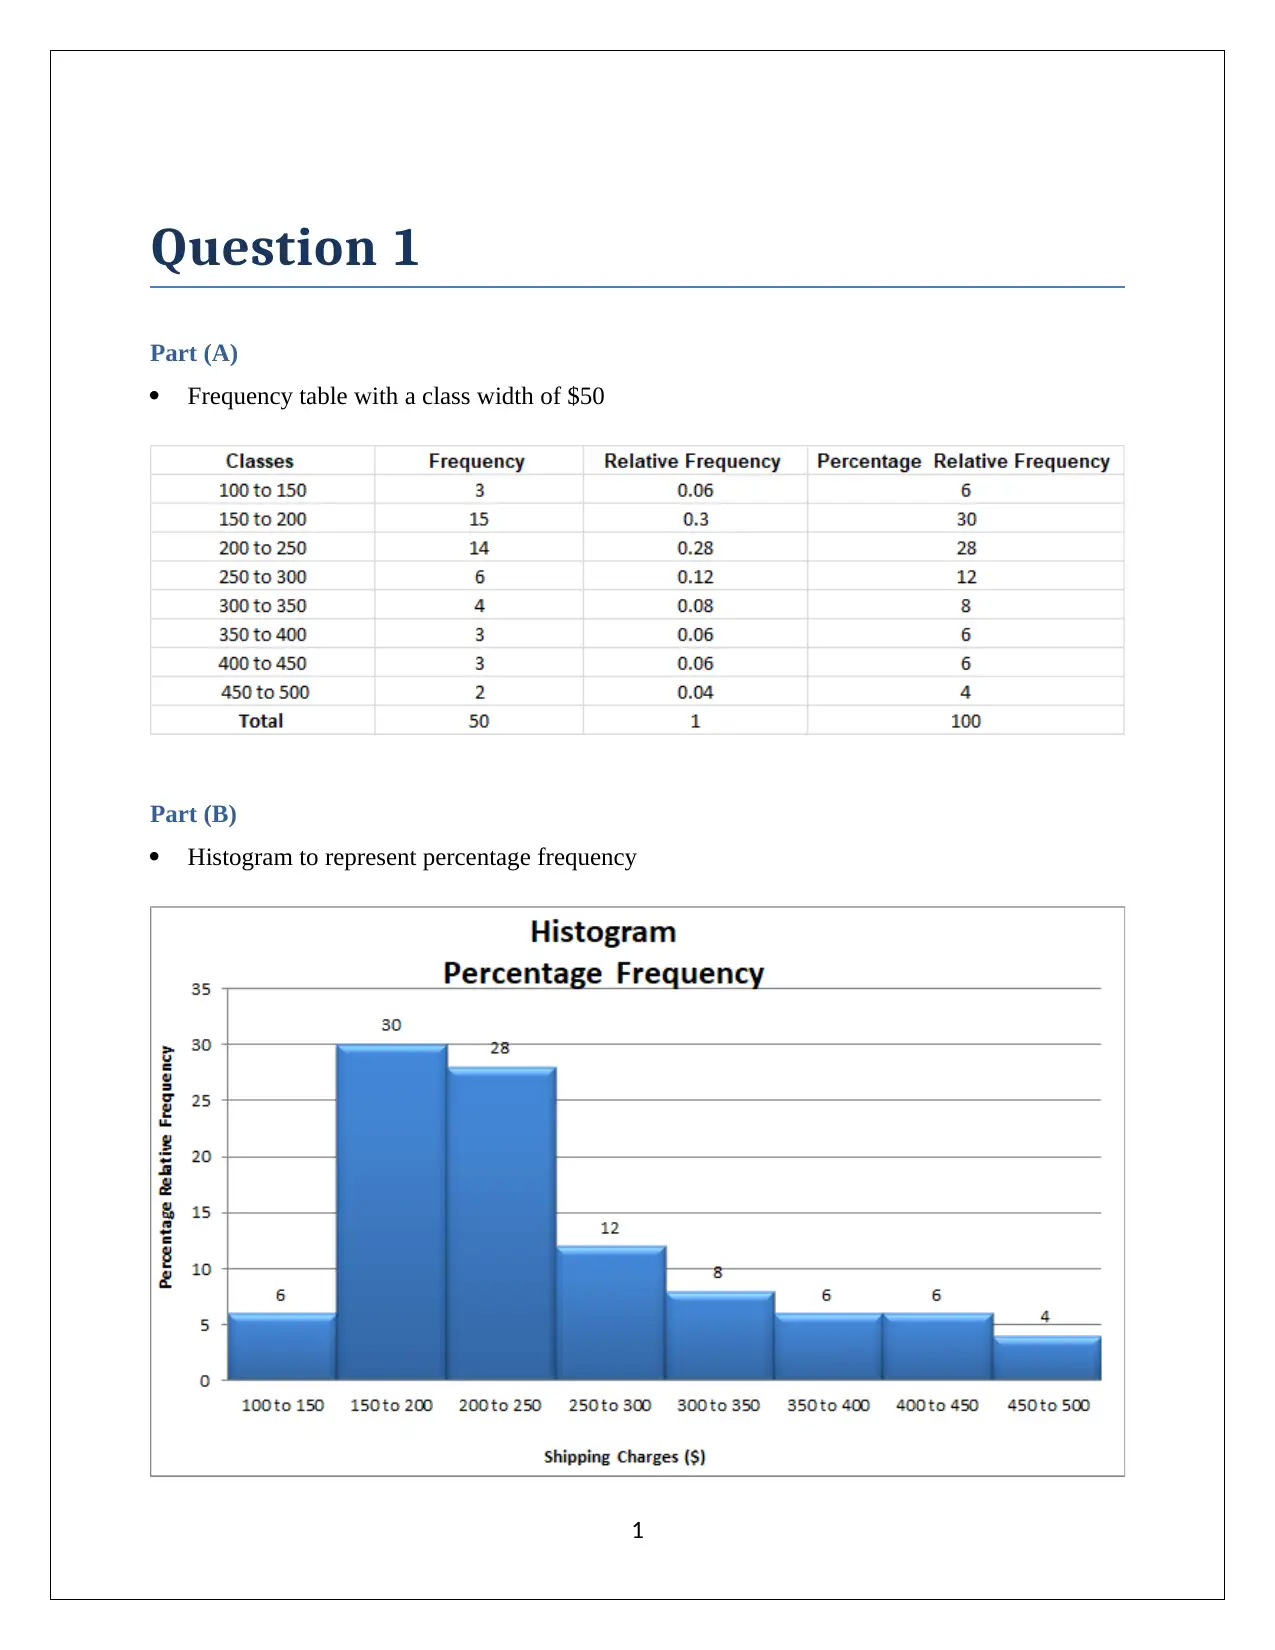
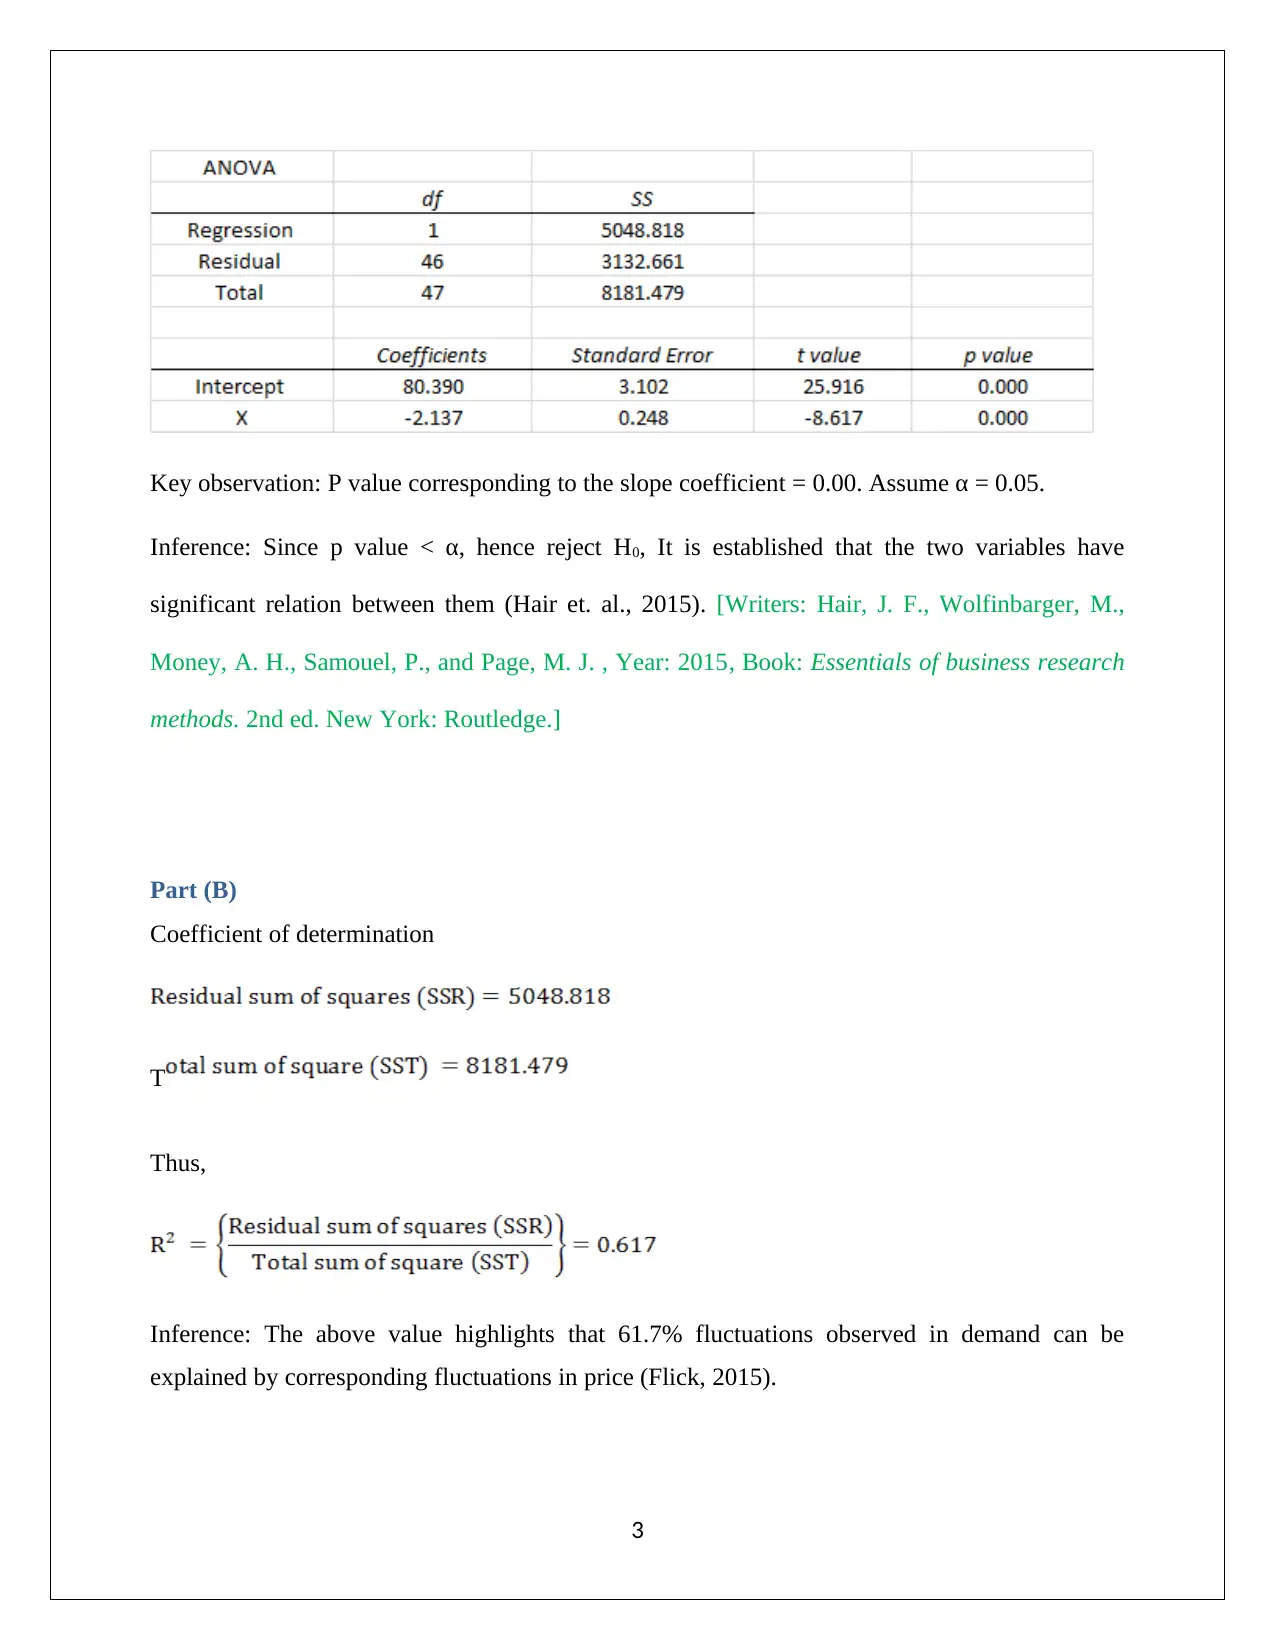
This document presents a comprehensive solution to a Statistics HI6007 assignment, addressing key concepts such as frequency distribution, hypothesis testing, and regression analysis. The solution involves creating a frequency table and histogram to analyze data distribution, conducting hypothesis tests to determine the relationship between variables like demand and unit price, and applying regression models to predict mobile sales based on advertising spots and mobile prices. The analysis includes interpretations of p-values, coefficients of determination and correlation, and beta coefficients to draw meaningful conclusions and make informed decisions. References to relevant textbooks and research methodologies are provided to support the analytical approaches used in the assignment. Desklib offers a wide range of such solved assignments and resources for students.
tabler-icon-diamond-filled.svg

Contribute Materials

Your contribution can guide someone’s learning journey. Share your documents today.
Document Page
STATISTICS
HI6007 GROUP ASSIGNMENT
Student Name
[Pick the date]
tabler-icon-diamond-filled.svg

Secure Best Marks with AI Grader

Need help grading? Try our AI Grader for instant feedback on your assignments.
Document Page
Question 1
Part (A)
Frequency table with a class width of $50
Part (B)
Histogram to represent percentage frequency
1
Document Page
Key Observation: There is a long rightward tail present. For a symmetric graph, the left and right
tails are equal in size.
Inference: The graph is asymmetric in shape and underlying variable does not follow normal
distribution.
Part (C)
The above discussion clearly highlights the asymmetric shape and hints at possible presence of
outliers on the positive end. This indicates that unsuitability of mean as a central tendency
measure in this scenario since owing to these abnormally high values, the mean may be higher
than true average. Thus, under the given scenario, it makes sense to deploy median as the central
tendency measure. This is justified since median does not get distorted by presence by extreme
values (Hillier, 2016).
[Book Name: Introduction to Operations Research, Ninth Edition, Year: 2016, Writers: Frederick
S. Hillier, Gerald, J. Lieberman, Bodhibrata Nag, Preetam Basu. Page No.: Not mentioned]
Question 2
Part (A)
The objective is to find whether the two variables demand and unit prices are associated or not.
Relevant Hypotheses
2
Document Page
Key observation: P value corresponding to the slope coefficient = 0.00. Assume α = 0.05.
Inference: Since p value < α, hence reject H0, It is established that the two variables have
significant relation between them (Hair et. al., 2015). [Writers: Hair, J. F., Wolfinbarger, M.,
Money, A. H., Samouel, P., and Page, M. J. , Year: 2015, Book: Essentials of business research
methods. 2nd ed. New York: Routledge.]
Part (B)
Coefficient of determination
T
Thus,
Inference: The above value highlights that 61.7% fluctuations observed in demand can be
explained by corresponding fluctuations in price (Flick, 2015).
3
tabler-icon-diamond-filled.svg

Secure Best Marks with AI Grader

Need help grading? Try our AI Grader for instant feedback on your assignments.
Document Page
Part (C)
Coefficient of correlation
From the above, two possibilities arise for the correlation coefficient. In order to make the right
choice, consideration has to be given to the slope coefficient which in this case is negative. This
implies that correlation coefficient would also be negative and hence the acceptable value is -
0.786 (Hillier, 2016).
Question 3
Relevant Hypotheses
Observation: Alpha (α) = 0.05 and significance F or p value = 0.00
Inference: Since p value < α, hence reject H0. Accept H1. This implies that the average for a
minimum of one population deviates from the others (Flick, 2015).
Question 4
The complete excel output is shown below:
4
Document Page
Part (A)
Regression equation y = a + b1 x1 +b2 x2
Part (B)
Relevant Hypotheses
Observation: Alpha (α) = 0.05 and significance F or p value = 0.00
Inference: Since p value < α, hence reject H0. Accept H1. Hence, it can be concluded that there
exists atleast one independent whose slope coefficient is significant which implies that the
multiple regression model is significant (Hair et. al., 2015).
5
Document Page
[Writers: Hair, J. F., Wolfinbarger, M., Money, A. H., Samouel, P., and Page, M. J. , Year: 2015,
Book: Essentials of business research methods. 2nd ed. New York: Routledge.]
Part (C)
Relevant hypotheses for variable mobile price x1
Relevant hypotheses for variable advertising spots x2
Observation: Alpha (α) = 0.05 and p value for slope coefficient of advertisement spots variable =
0.00
Inference: Since p value < α, hence reject H0. Accept H1. Therefore, the slope coefficient cannot
be assumed to be zero which highlights its significance (Flick, 2015).
Part (D)
Observation: βadvertising = 0.4733
Inferences: A unit change in the advertising spots count would lead to change in mobile sales by
0.4733 on a daily basis. Also, considering the directly proportional relationship, the change
observed in the two variables mentioned above would be unidirectional (Hillier, 2016).
Part (E)
Regression equation y = a + b1 x1 +b2 x2
6
tabler-icon-diamond-filled.svg

Paraphrase This Document

Need a fresh take? Get an instant paraphrase of this document with our AI Paraphraser
Document Page
Hence,
Thus, based on the input values provided, daily mobile sales would be 9960.
References
Flick, U. (2015) Introducing research methodology: A beginner's guide to doing a research
project. 4th ed. New York: Sage Publications.
Hair, J. F., Wolfinbarger, M., Money, A. H., Samouel, P., and Page, M. J. (2015) Essentials of
business research methods. 2nd ed. New York: Routledge.
Hillier, F. (2016) Introduction to Operations Research. 6th ed. New York: McGraw Hill
Publications.
7
Document Page
8
chevron_up_icon
1 out of 9
circle_padding
hide_on_mobile
zoom_out_icon
logo.png

Your All-in-One AI-Powered Toolkit for Academic Success.

Available 24*7 on WhatsApp / Email

[object Object]