Statistics for Managerial Decision Assignment - Analysis and Report

Verified

Added on  2022/11/13

|11
|628
|156
Homework Assignment
AI Summary
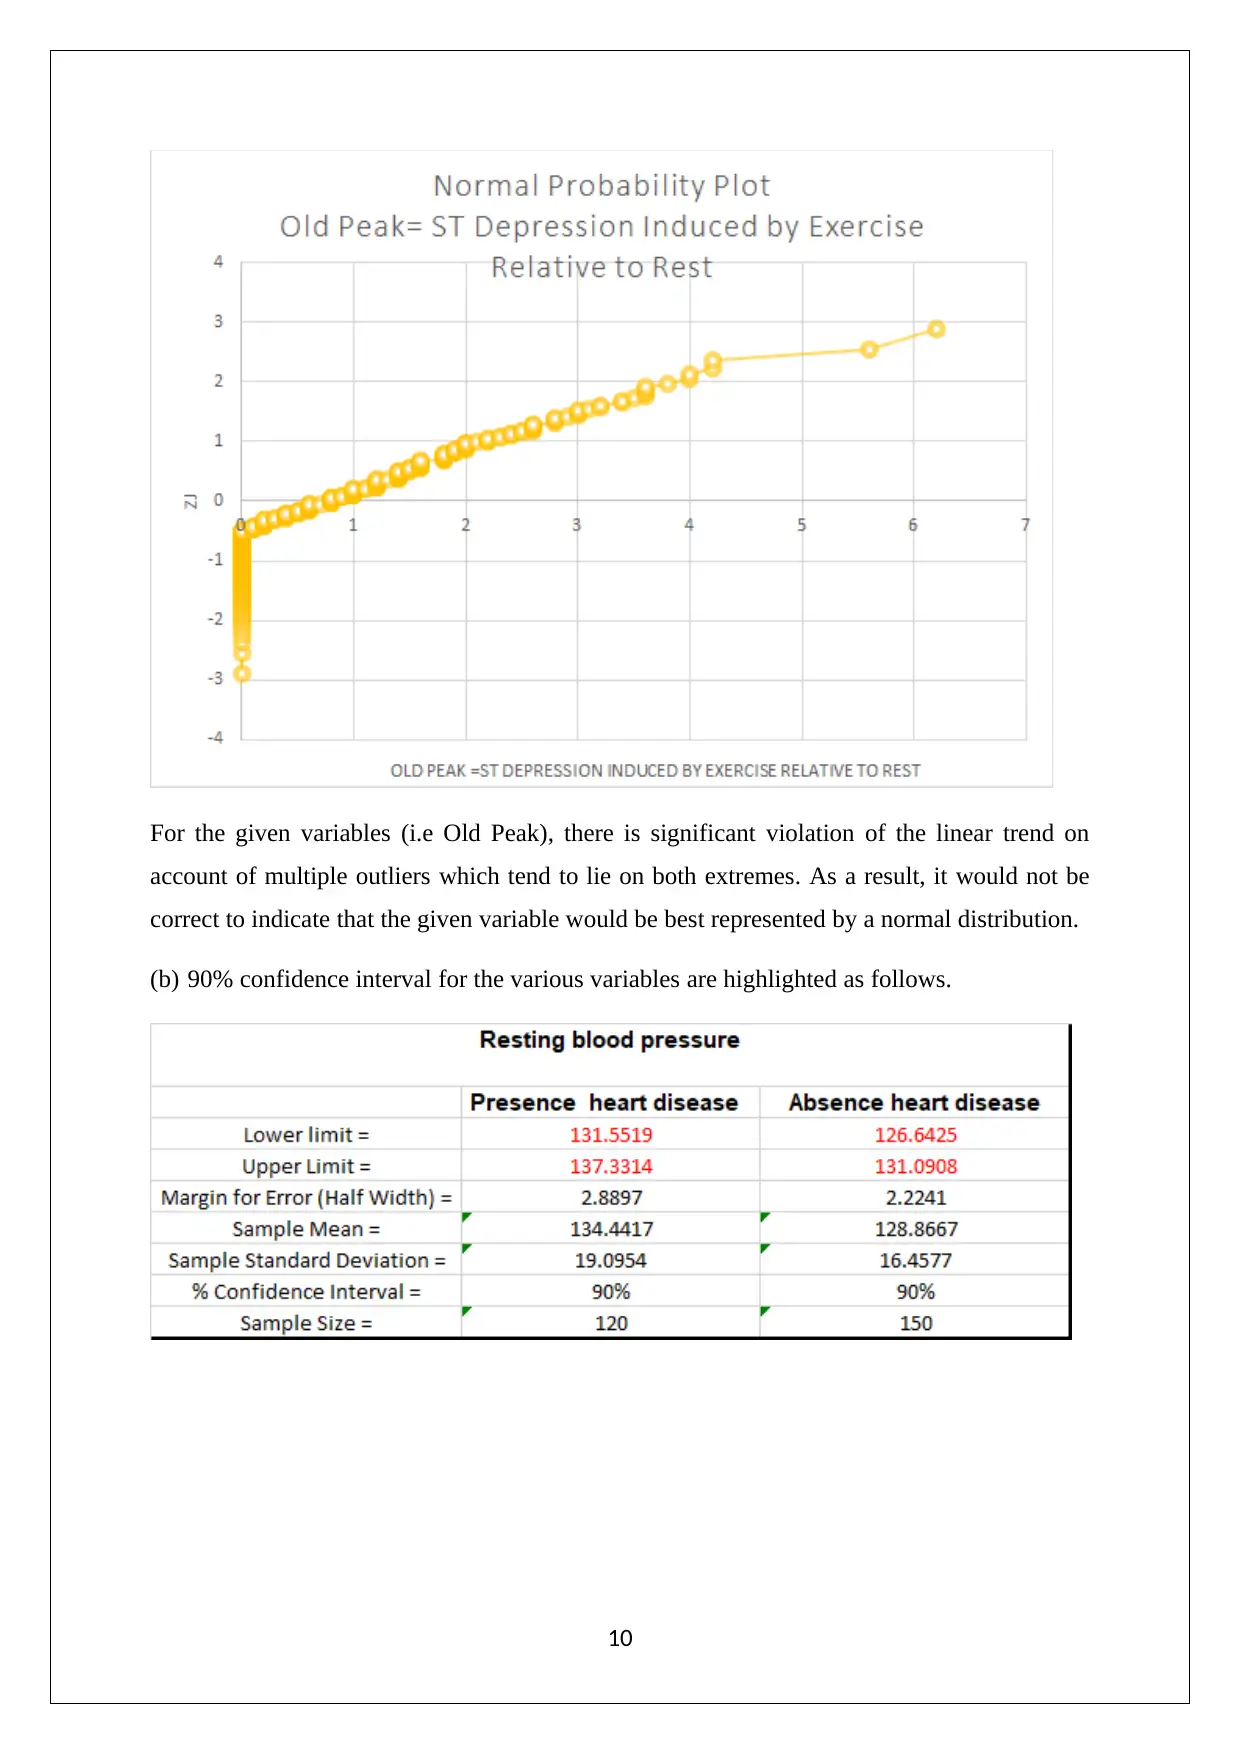
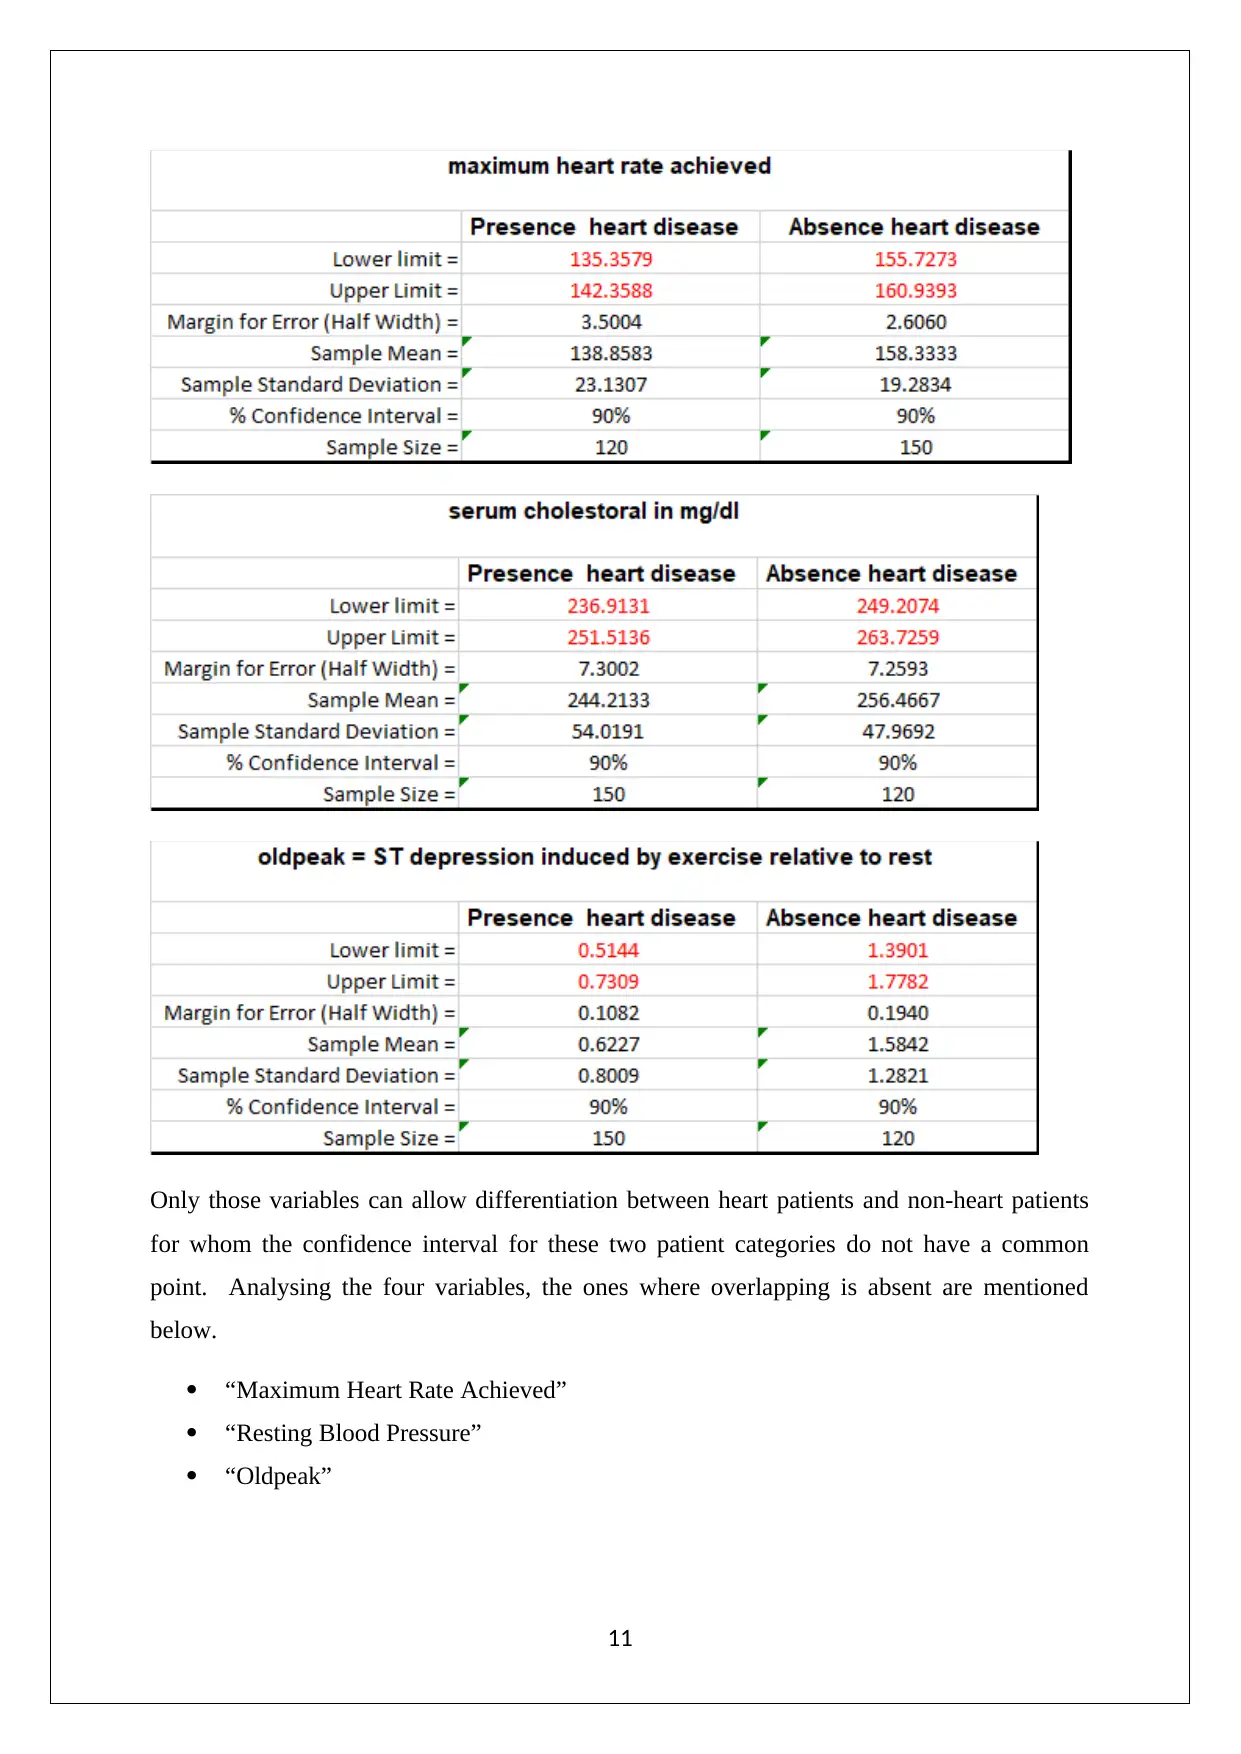
This assignment solution addresses statistical concepts relevant to managerial decision-making. It includes analysis of financial data for healthcare companies (RMD and FPH), descriptive statistics (mean, median, standard deviation, box plots) of weekly rent in various cities, probability calculations related to crop yields and rainfall distribution (Poisson and Normal), and the interpretation of normal probability plots for various health-related variables (resting blood pressure, serum cholesterol, maximum heart rate, and old peak). The solution also covers the construction of confidence intervals and the identification of variables that can differentiate between heart patients and non-heart patients. The assignment demonstrates the application of statistical methods to real-world scenarios and data interpretation.
Document Page
STATISTICS FOR MANAGERIAL DECISION
STUDENT ID:
[Pick the date]
tabler-icon-diamond-filled.svg

Paraphrase This Document

Need a fresh take? Get an instant paraphrase of this document with our AI Paraphraser
Document Page
Question 1
(a) The required quarterly opening pricefor RMD and FPHand stem-leaf display
(b) Relevant graph
2
Document Page
(c) The relevant bar graph for six listed healthcare companies on ASX is shown as follows.
Relevant data for the above graph is December 31, 2018.
(d) A comparison between the two stocks ought to be drawn so as to select the better choice.
There has been significant debt reduction during FY2018 for RMD owing to which
significant deleveraging has happened.
Further, P/E ratio for RMD stock is 52.82 in comparison to FPH which trades at a P/E
ratio of 63.
3
Document Page
Additionally, in the current year till date while FPH has given significant gains, RMD
has been rather subdued.
Considering the above factors, RMD seems to be a preferable bet considering scope for
future appreciation form a medium to long term perspective.
Question 2
(a) Required mean, median, Q1 and Q3
(b) Standard deviation, range and mean absolute deviation
(c) Box plot
4
tabler-icon-diamond-filled.svg

Paraphrase This Document

Need a fresh take? Get an instant paraphrase of this document with our AI Paraphraser
Document Page
(d) The descriptive statistics in the context of weekly rent along with the box plots clearly
reflect the significant variation in trends observed in the various cities. The mean weekly
rent seem to be the most stable in Perth while they are the most volatile in Sydney as is
reflected from the dimensions of boxplot and standard deviation. Further, Sydney
commands a significant premium in terms of location over other cities. With regards to
listings in Airbnb, a huge variation was observed with regards to Sydney prices but the
average prices were lower than computed value using the given data.
Question 3
(a) Probability that selected field will be canola in Australia
P =2538678/ (4623527+2538678+371339+955321+11720277)=0.1256
(b) Probability that selected field will be wheat in NSW
= 9556517/ ((2755310+1201045+403121+483081+9556517)) =0.6637
(c) Yield would be determined by diving the production of crop with the area of field.
5
Document Page
(d) For the state of South Australia, grain sorghum estimates would be categorised as
unrealistic on account of the very high (in excess of 50%) relative standard error by ABS
in estimates.
Question 4
(a) Rainfall amount distribution given asPoisson.
(i) P (No rainfall)
(ii) P (X>= 3)
(b) Rainfall amount distribution given as Normal.
(i) P (10< X<50)
6
Document Page
(ii) Rainfall amount is X mm
Question 5
(a) The normal probability plots
7
tabler-icon-diamond-filled.svg

Paraphrase This Document

Need a fresh take? Get an instant paraphrase of this document with our AI Paraphraser
Document Page
A linear trend is broadly adhered to by the normal probability, hence resting blood pressure
can be said to fit a normal distribution.
In the above normality plot, there is one outlier on the higher end with a corresponding z
value of +3. If that value is ignored, then a broad linear trend is adhered by the serum
cholesterol and it would be said to be normally distributed.
8
Document Page
A linear trend is broadly adhered to by the normal probability, hence maximum heart rate
achieved can be said to fit a normal distribution.
9
Document Page
For the given variables (i.e Old Peak), there is significant violation of the linear trend on
account of multiple outliers which tend to lie on both extremes. As a result, it would not be
correct to indicate that the given variable would be best represented by a normal distribution.
(b) 90% confidence interval for the various variables are highlighted as follows.
10
tabler-icon-diamond-filled.svg

Paraphrase This Document

Need a fresh take? Get an instant paraphrase of this document with our AI Paraphraser
Document Page
Only those variables can allow differentiation between heart patients and non-heart patients
for whom the confidence interval for these two patient categories do not have a common
point. Analysing the four variables, the ones where overlapping is absent are mentioned
below.
“Maximum Heart Rate Achieved”
“Resting Blood Pressure”
“Oldpeak”
11
chevron_up_icon
1 out of 11
circle_padding
hide_on_mobile
zoom_out_icon
[object Object]