Statistics Homework: Confidence Intervals and Hypothesis Testing

Verified

Added on  2022/09/09

|8
|444
|22
Homework Assignment
AI Summary
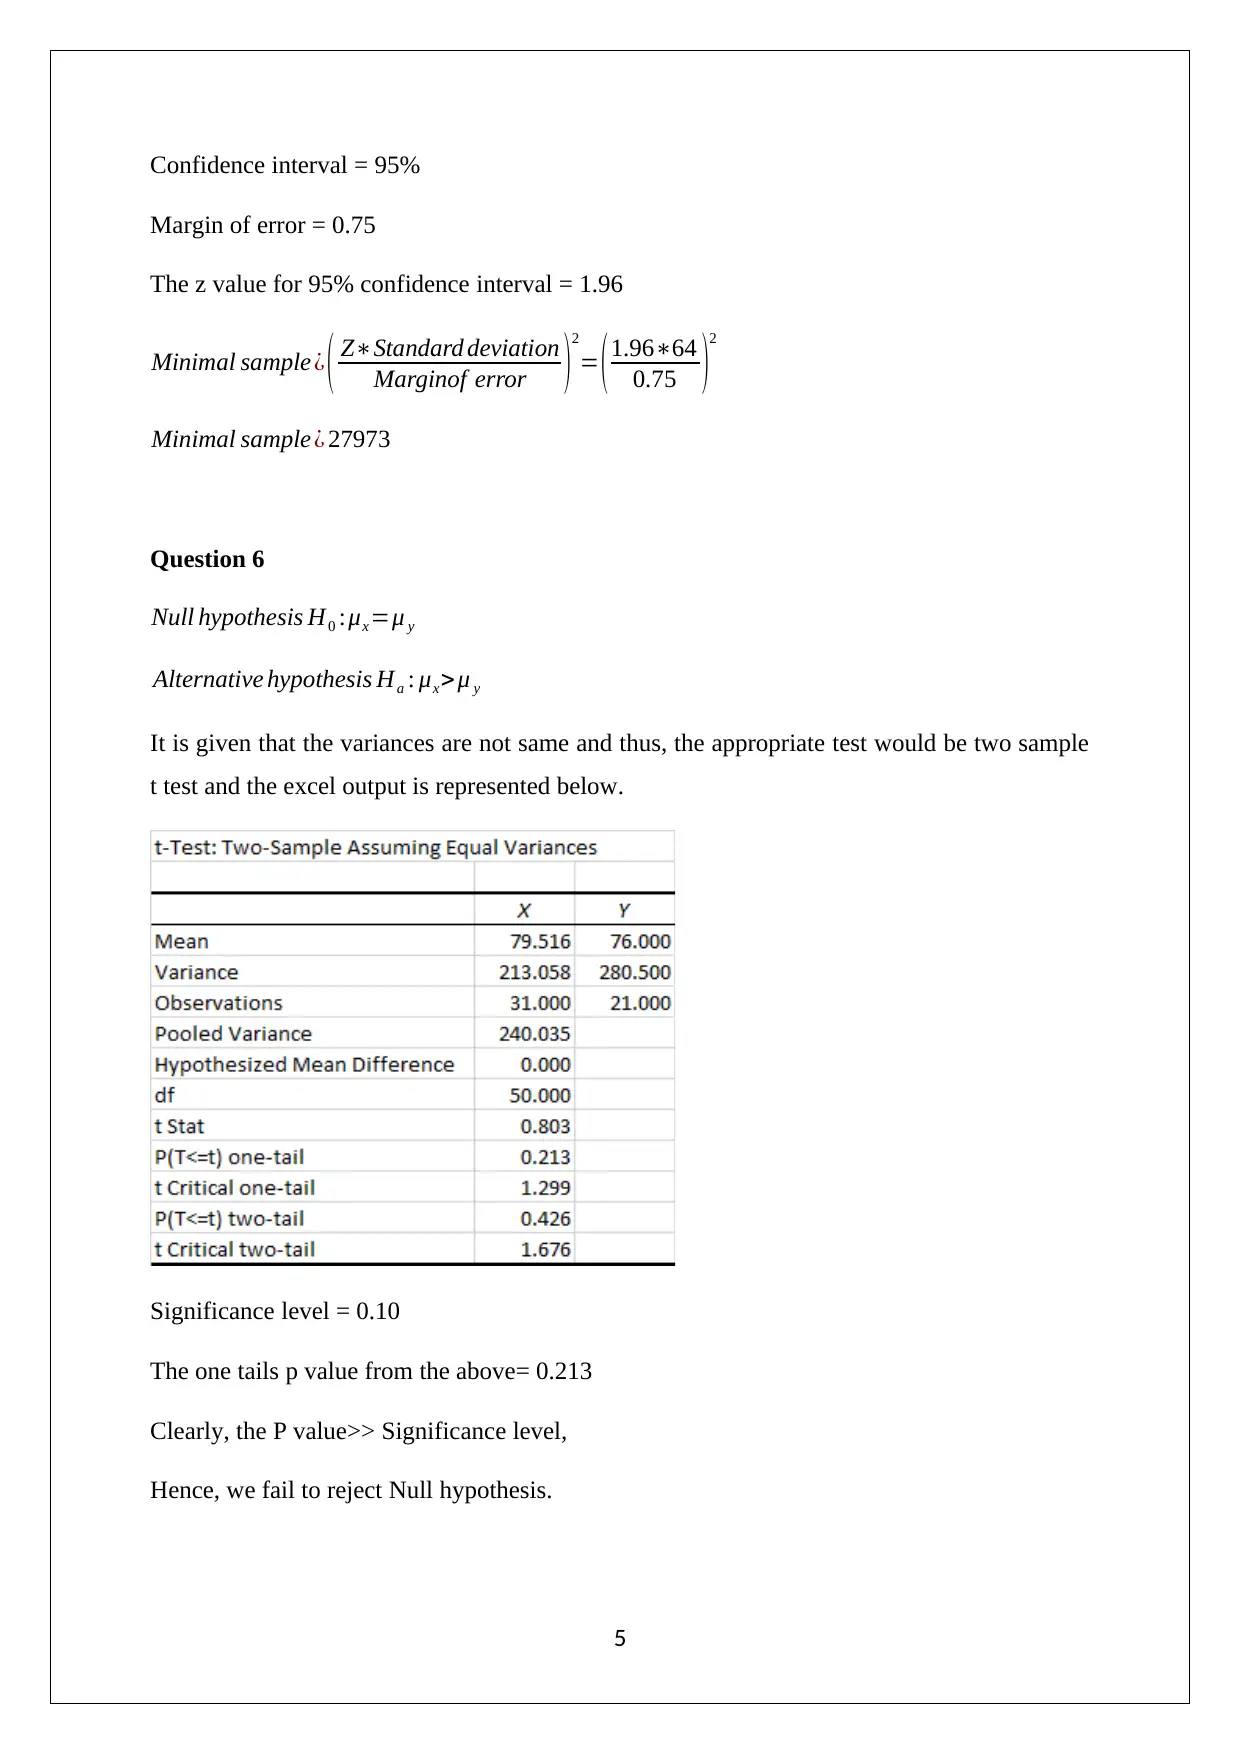
This statistics assignment provides solutions to several problems related to statistical inference. The assignment covers the calculation and interpretation of confidence intervals, including determining the appropriate distribution (t-distribution) and calculating confidence intervals for the mean. It also addresses hypothesis testing, including setting up null and alternative hypotheses, determining the test statistic (z-score or t-score), and making decisions based on the p-value. Specific problems include testing the effectiveness of a program, determining the required sample size, and performing a two-sample t-test. Finally, the assignment includes a one-sample proportion test, calculating the test statistic, and drawing conclusions based on the critical value and p-value. The assignment includes a variety of statistical concepts and applications, demonstrating the use of different statistical methods.
tabler-icon-diamond-filled.svg

Contribute Materials

Your contribution can guide someone’s learning journey. Share your documents today.
Document Page
MATHEMATICAL STATISTICS
[DATE]
tabler-icon-diamond-filled.svg

Secure Best Marks with AI Grader

Need help grading? Try our AI Grader for instant feedback on your assignments.
Document Page
Question 1
(a) Stem-leaf display
(b) All quartiles
(c) Interquartile range
IQR = Third Quartile – First Quartile = 132.7-130.6 = 2.1
(d) 15th percentile and 78th percentile
Working
1
Document Page
Question 2
(a) Mean of X
Mean of X = 49
(b) Standard deviation of X
Standard deviation of X= σ
n = 8
81 = 8
9 =0.89
(c) Approximate distribution of X
Approximate distribution of X is termed as “Normal Distribution.” N ( 49 , 0.89 ) .
2
Document Page
Question 3
95% confidence interval
As the population standard deviation is not given and thus, z distribution can not be used
here. Therefore, the appropriate distribution would be t distribution.
Degree of freedom = 9-1 = 8
The t value for 95% confidence interval = 2.306
Now,
Lower limit of 95 % confidence interval=Mean t valuestandard deviation
¿ ¿
¿ 244 (2.30621.74 / (9))=227.29
Upper limit of 95 %confidence interval=Mean+t valuestandard deviation
¿ ¿
¿ 244 (2.30621.74 /sqr t (9))=260.71
95%confidence interval = [227.29 260.71]
It can be said with 95% confidence that the mean energy of a particle would fall within
227.29 and 260.71.
Question 4
Null and alternative hypothesis
H0: Mean (After) - Mean (Before) = 0
Ha: Mean (After) -Mean (Before) 0
3
tabler-icon-diamond-filled.svg

Secure Best Marks with AI Grader

Need help grading? Try our AI Grader for instant feedback on your assignments.
Document Page
As the population standard deviation is not given and thus, z distribution cannot be used here.
Therefore, the appropriate distribution would be t distribution.
Degree of freedom = 9-1 = 8
The t value for 95% confidence interval = 2.306
Now,
Lower limit of 95 % confidence interval=Mean t valuestandard deviation
¿ ¿
¿ 3 (2.3063/ (9))=0.69
Upper limit of 95 %confidence interval=Mean+t valuestandard deviation
¿ ¿
¿ 3+(2.3063/ (9))=5.31
As zero does not include in this interval and hence, It can be said that the program does not
enhance the speed of the pitcher’s fastball.
Question 5
Minimal sample size =?
Standard deviation = 64
4
Document Page
Confidence interval = 95%
Margin of error = 0.75
The z value for 95% confidence interval = 1.96
Minimal sample ¿ ( ZStandard deviation
Marginof error )
2
= ( 1.9664
0.75 )
2
Minimal sample ¿ 27973
Question 6
Null hypothesis H0 :μx=μ y
Alternative hypothesis Ha : μx> μ y
It is given that the variances are not same and thus, the appropriate test would be two sample
t test and the excel output is represented below.
Significance level = 0.10
The one tails p value from the above= 0.213
Clearly, the P value>> Significance level,
Hence, we fail to reject Null hypothesis.
5
Document Page
Question 7
Hypotheses
Null hypothesis H0 : p 1=1
6
Alternative hypothesis Ha : p 1< 1
6
(a) Significance level = 0.01
Critical z value = -2.326
Reject null hypothesis when computed z value < z critical value
(b) The test statistics
Sample proportion P= 785/5000 = 0.157
z= Pp
p 1 1p 1
n
=
0.157 1
6
( 1
6 ) (1 1
6 )
5000
=1.840
Here, computed z value > z critical value and as a result of this, null hypothesis will only be
rejected. Also, the conclusion can be drawn that the proportion is not less than 1/6.
(c) The P Value
The left-tailed p value corresponding to z score is 0.0330.
The p value (0.0330) > 0.01 and thereby, reject null hypothesis.
6
tabler-icon-diamond-filled.svg

Paraphrase This Document

Need a fresh take? Get an instant paraphrase of this document with our AI Paraphraser
Document Page
7
chevron_up_icon
1 out of 8
circle_padding
hide_on_mobile
zoom_out_icon
logo.png

Your All-in-One AI-Powered Toolkit for Academic Success.

Available 24*7 on WhatsApp / Email

[object Object]