161.101 Statistics for Business: Assignment 1, Summer Semester 2018
VerifiedAdded on 2023/05/28
|10
|2394
|240
Homework Assignment
AI Summary
This assignment for Statistics for Business course covers several key concepts in statistics. It begins by differentiating between discrete and continuous variables, providing examples for each. It then discusses ordinal and nominal data in the context of rating a smartphone. The assignment includes questions on random sampling, stratified sampling, cluster sampling, and systematic sampling methods, explaining their advantages and disadvantages. Furthermore, it involves analyzing a dataset of house selling prices using summary statistics, boxplots, and pivot tables to interpret housing market trends and property characteristics. The analysis includes calculating mean, median, quartiles, range, and standard deviation for house prices, interpreting boxplots to compare prices in different city quadrants, and summarizing findings from a pivot table of bathrooms and bedrooms.
Name: ____________________ 161.101 Statistics for Business
ID Number: Assignment 1 – 2018-SS
University
Statistics
By
Your Name
Date
Page 1 of 10
© <Your Name> 2018
ID Number: Assignment 1 – 2018-SS
University
Statistics
By
Your Name
Date
Page 1 of 10
© <Your Name> 2018
Paraphrase This Document
Need a fresh take? Get an instant paraphrase of this document with our AI Paraphraser
Name: ____________________ 161.101 Statistics for Business
ID Number: Assignment 1 – 2018-SS
161.101 - 2018 Summer Semester: Assignment 1 [40 marks]
Q1. [10 marks]
a) Use examples to explain the differences between discrete and continuous
variables.
Discrete variables are variables that can only take a particular defined set of values within
a specified range. Numerical discrete data include number of children, number people with
a certain blood group, and number of match sticks in a match box. On the other hand,
categorical discrete data includes gender (male or female), and colours (red, blue, red).
Continuous variables refer to numeric variables that can take an infinite set of values
within a specified range and usually designate measured characteristics such as weight,
height, temperature, income, etc.
b) The members of a focus group are asked to rate a new smart phone on a 5-point
scale, from 1= “market leader” to 5= “piece of junk”. Should the data be
regarded as ordinal or nominal? Discuss.
When members of the focus group rate the smartphone on a 5-poinyt scale where 1
represents the market leader while five represent a piece of junk, the data is regarded as
ordinal because it just it classifies the smartphones into ordered categories of 1 to 5.
c) A group of 246 customers was identified, and each was allocated an identification
number from 1 to 246. Use the row of random digits below, start at the
beginning, and use consecutive groups of digits to draw a random sample of five
unique individuals from these 246.
Page 2 of 10
© <Your Name> 2018
Name: ____________________ 161.101 Statistics for Business
ID Number: Assignment 1 – 2018-SS
82931 91284 12103 71511 40013 53953 12859 90368
Use the first random number as the start value.
Since 246 is a three-digit number group the digits of the random numbers into three
from left starting with the first random number.
We will have the values 829, 912, 121, 715, 400, 539, 128, 903
The only values within our range are 121 and 128.
Since we have not got the 5 random numbers we repeat the steps again, this time
starting with the second digit of every random numbers,
The random samples will be 293, 128, 210, 001,395, 285, 036.
The random samples within our range are 128, 210, 151, 001, 036.
Since 128 repeats itself in the first and second sample we reject it and use the rest
The random sample will therefore be 121, 210, 151, 001, and 036.
Q2. [12marks]
A shopping mall contains 60 stores. You are interested in assessing the job satisfaction
level of employees at the mall. You talk to store owners and hand out questionnaire
forms to each store employee personally, and give them a week to answer them. After a
week, you have received completed responses from only 10 stores.
a) What problem is your survey suffering from? Why is this a problem, and how
might you fix it?
When only ten stores out of sixty stores give their responses, it means that the survey is
Page 3 of 10
© <Your Name> 2018
⊘ This is a preview!⊘
Do you want full access?
Subscribe today to unlock all pages.
Trusted by 1+ million students worldwide
Name: ____________________ 161.101 Statistics for Business
ID Number: Assignment 1 – 2018-SS
face faced with the problem of low response rate and therefore is not representative of the
whole population.
To fix the problem, the researcher needs to access the cause of the low response rate, if it is
as a result of poor design of the questionnaire, the researcher can redesign the
questionnaire again by making as simple and attractive as possible so it can attract the
respondent to give the information required, If the problem is as a result of the respondents
inability to find time to fill the questionnaire, the researcher can request the owner of the
store to give the respondents some time to respond to the questionnaires so that he/she can
obtain adequate information to continue with the research analysis.
You are also tasked with assessing how much floorspace of each store is devoted to
promotions, sales, and specials etc. You have a method for measuring this but it is time
consuming so you decide to sample only about 15 of the 60 stores.
b) Describe how one might perform a stratified random sample in this case to assess
the amount of floorspace dedicated to promotions. What are the advantages and
disadvantages of a stratified random sample?
To perform a stratified random sampling to determine the floor space that is dedicated to
promotions, the we use the 15 chosen stores as the population elements. They are divided
into groups that are non-overlapping called the strata. Simple random samples sample are
then selected from each stratum. Strata created in this case will be donated by promotions
(Indicating floor space devoted for promotion), sales (indicating floor space devoted for
sales), and specials (indicating floor space devoted for specials). The stratified random
sampling performed will assist in obtaining information about the whole same (15 stores
chose, each stratum (promotion, special, sales) and the relationship between the strata.
Once conclusive results are reached they can be extended to the whole population (60
stores).
Page 4 of 10
© <Your Name> 2018
Paraphrase This Document
Need a fresh take? Get an instant paraphrase of this document with our AI Paraphraser
Name: ____________________ 161.101 Statistics for Business
ID Number: Assignment 1 – 2018-SS
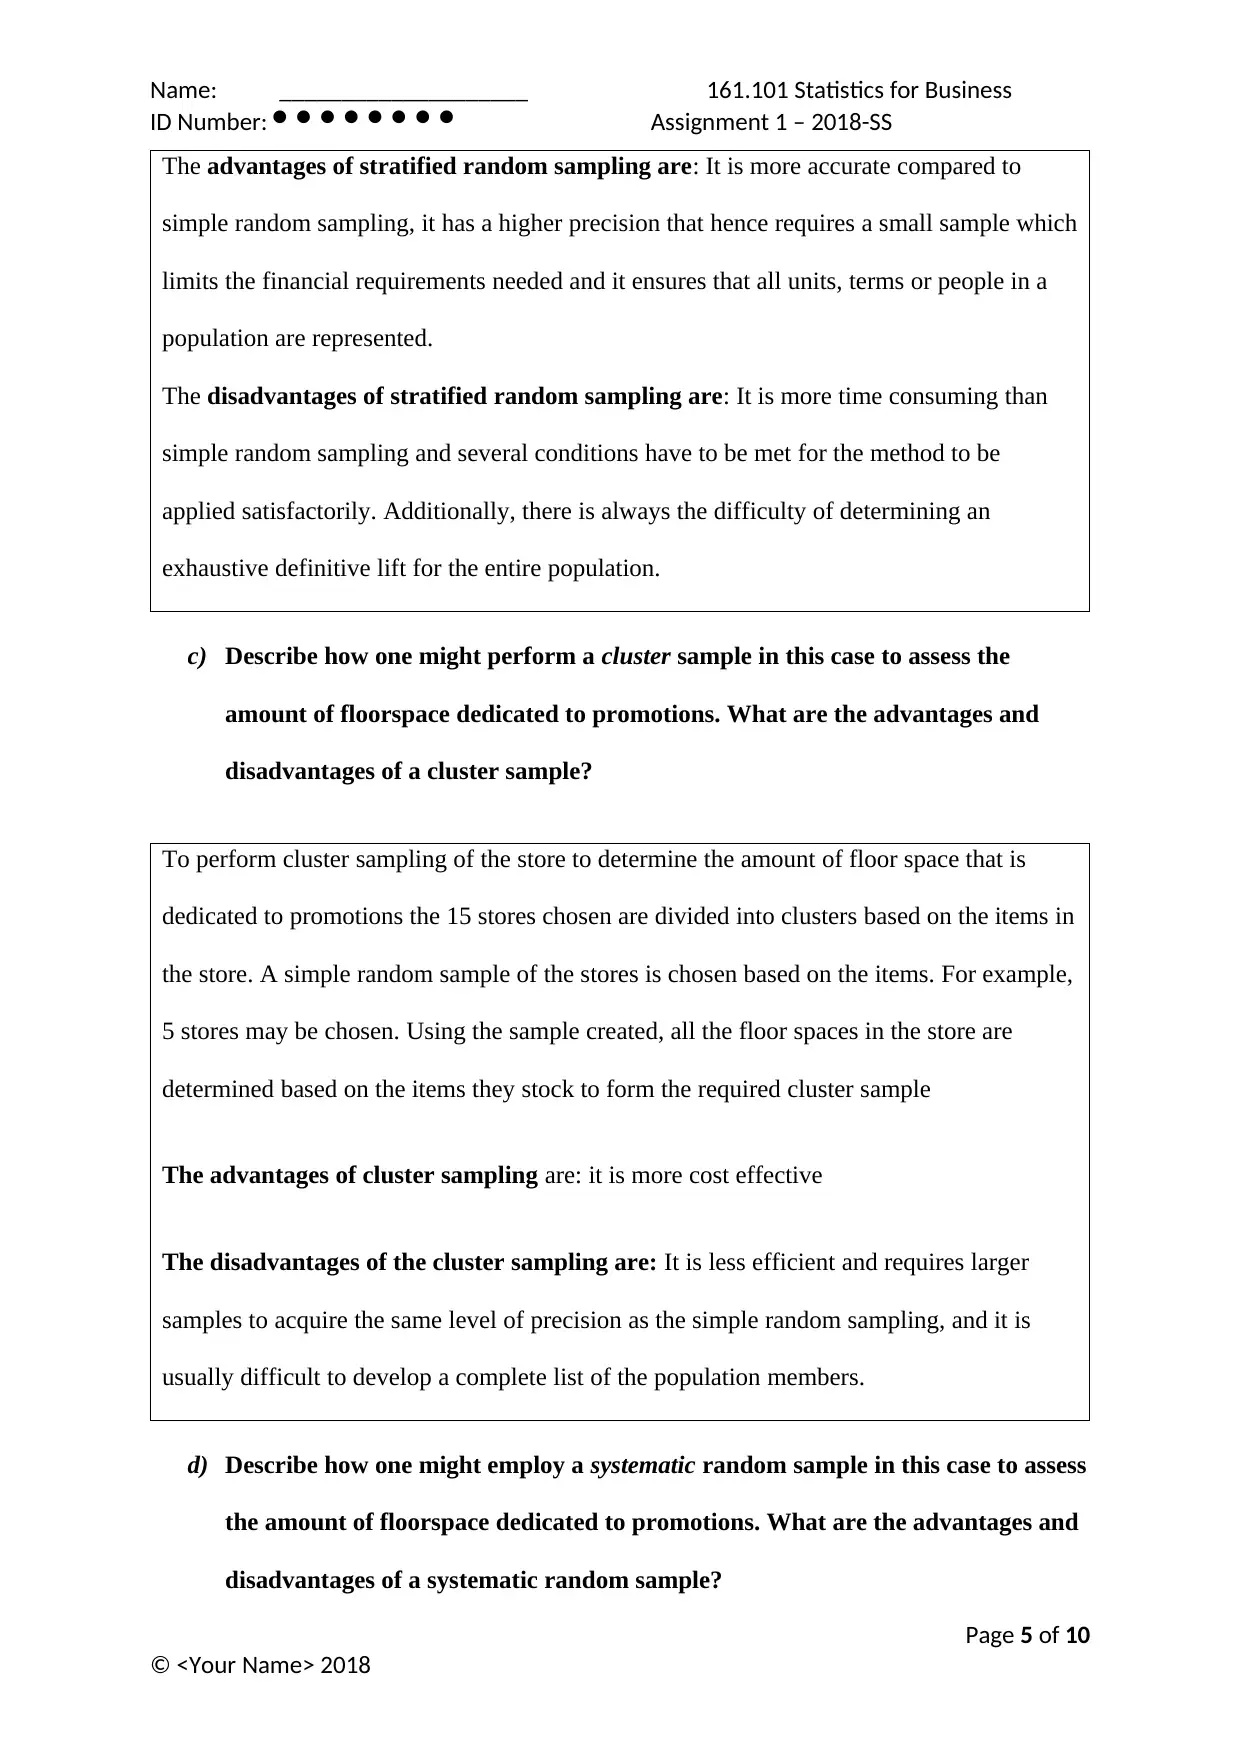
The advantages of stratified random sampling are: It is more accurate compared to
simple random sampling, it has a higher precision that hence requires a small sample which
limits the financial requirements needed and it ensures that all units, terms or people in a
population are represented.
The disadvantages of stratified random sampling are: It is more time consuming than
simple random sampling and several conditions have to be met for the method to be
applied satisfactorily. Additionally, there is always the difficulty of determining an
exhaustive definitive lift for the entire population.
c) Describe how one might perform a cluster sample in this case to assess the
amount of floorspace dedicated to promotions. What are the advantages and
disadvantages of a cluster sample?
To perform cluster sampling of the store to determine the amount of floor space that is
dedicated to promotions the 15 stores chosen are divided into clusters based on the items in
the store. A simple random sample of the stores is chosen based on the items. For example,
5 stores may be chosen. Using the sample created, all the floor spaces in the store are
determined based on the items they stock to form the required cluster sample
The advantages of cluster sampling are: it is more cost effective
The disadvantages of the cluster sampling are: It is less efficient and requires larger
samples to acquire the same level of precision as the simple random sampling, and it is
usually difficult to develop a complete list of the population members.
d) Describe how one might employ a systematic random sample in this case to assess
the amount of floorspace dedicated to promotions. What are the advantages and
disadvantages of a systematic random sample?
Page 5 of 10
© <Your Name> 2018
ID Number: Assignment 1 – 2018-SS
The advantages of stratified random sampling are: It is more accurate compared to
simple random sampling, it has a higher precision that hence requires a small sample which
limits the financial requirements needed and it ensures that all units, terms or people in a
population are represented.
The disadvantages of stratified random sampling are: It is more time consuming than
simple random sampling and several conditions have to be met for the method to be
applied satisfactorily. Additionally, there is always the difficulty of determining an
exhaustive definitive lift for the entire population.
c) Describe how one might perform a cluster sample in this case to assess the
amount of floorspace dedicated to promotions. What are the advantages and
disadvantages of a cluster sample?
To perform cluster sampling of the store to determine the amount of floor space that is
dedicated to promotions the 15 stores chosen are divided into clusters based on the items in
the store. A simple random sample of the stores is chosen based on the items. For example,
5 stores may be chosen. Using the sample created, all the floor spaces in the store are
determined based on the items they stock to form the required cluster sample
The advantages of cluster sampling are: it is more cost effective
The disadvantages of the cluster sampling are: It is less efficient and requires larger
samples to acquire the same level of precision as the simple random sampling, and it is
usually difficult to develop a complete list of the population members.
d) Describe how one might employ a systematic random sample in this case to assess
the amount of floorspace dedicated to promotions. What are the advantages and
disadvantages of a systematic random sample?
Page 5 of 10
© <Your Name> 2018
Name: ____________________ 161.101 Statistics for Business
ID Number: Assignment 1 – 2018-SS
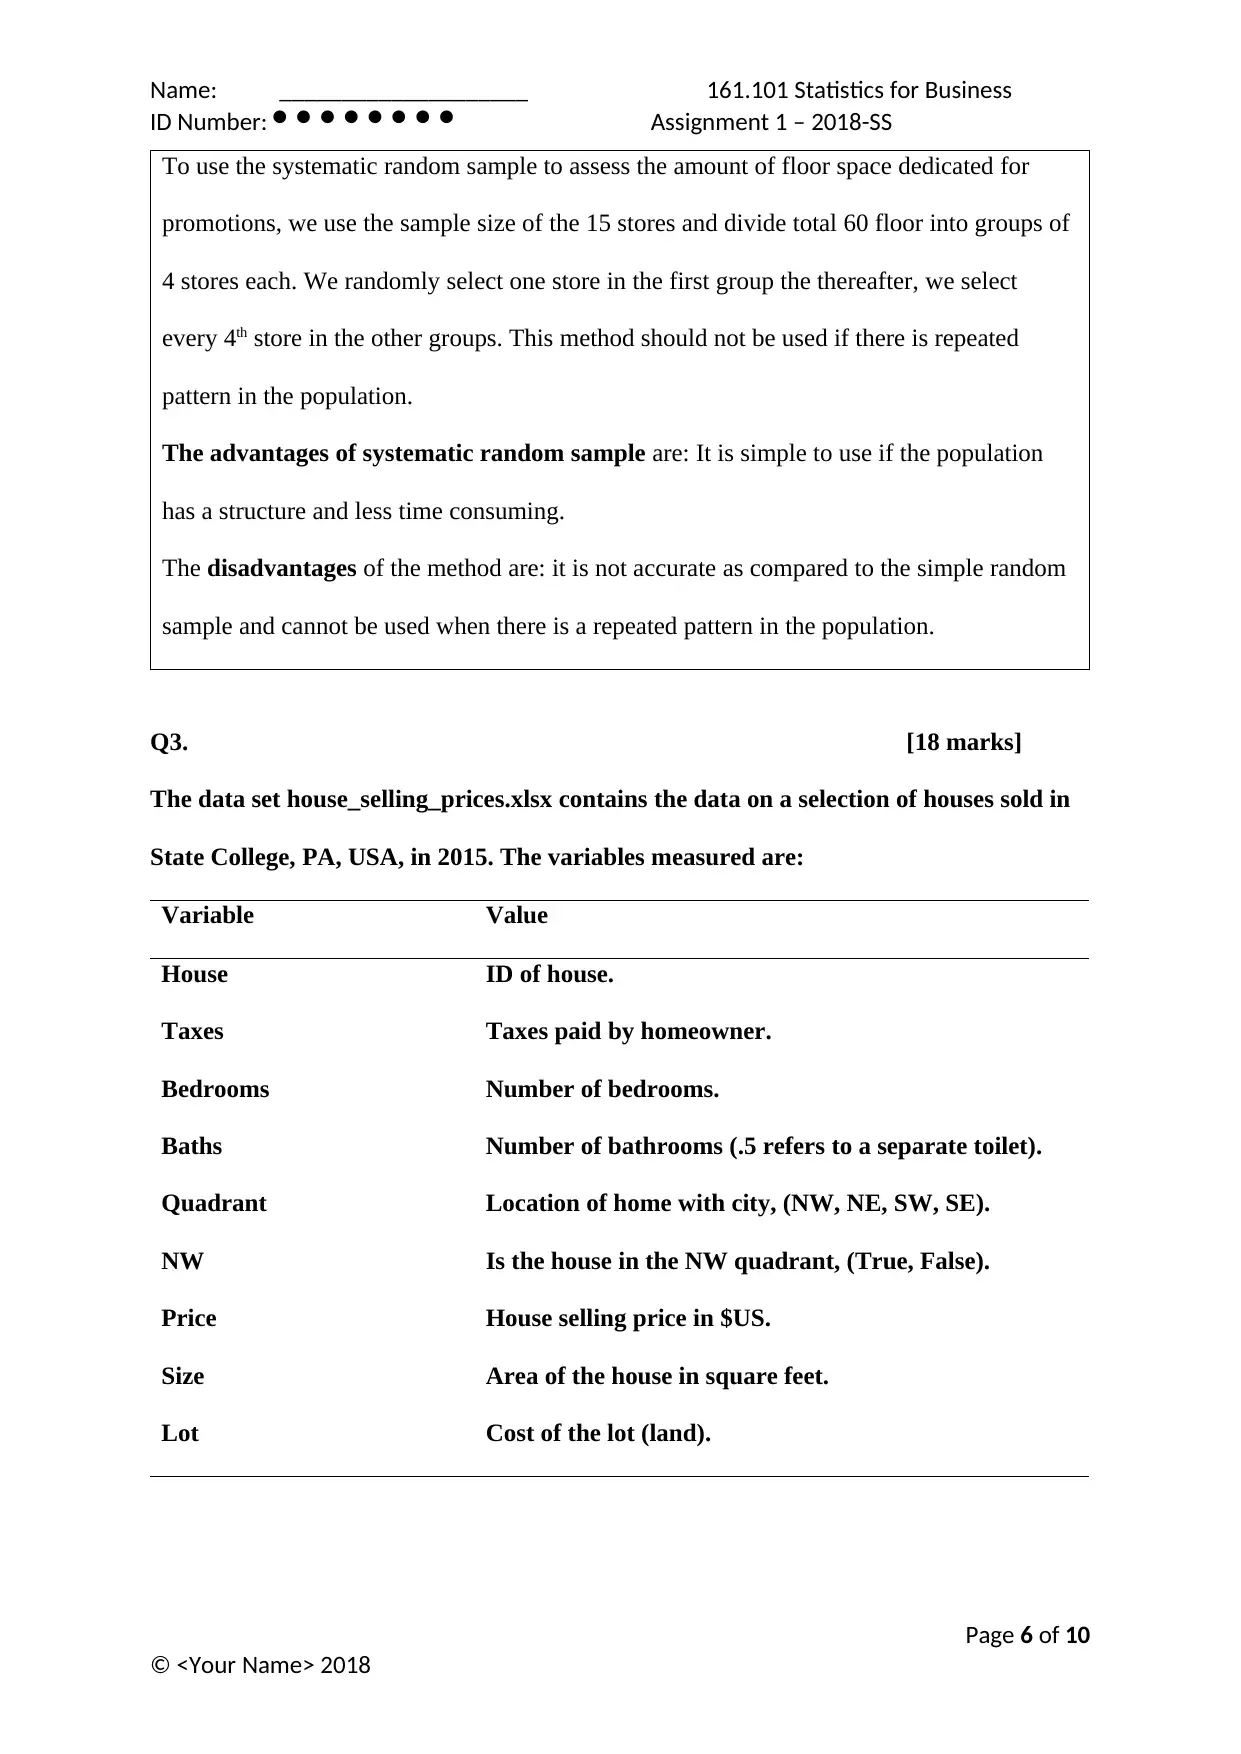
To use the systematic random sample to assess the amount of floor space dedicated for
promotions, we use the sample size of the 15 stores and divide total 60 floor into groups of
4 stores each. We randomly select one store in the first group the thereafter, we select
every 4th store in the other groups. This method should not be used if there is repeated
pattern in the population.
The advantages of systematic random sample are: It is simple to use if the population
has a structure and less time consuming.
The disadvantages of the method are: it is not accurate as compared to the simple random
sample and cannot be used when there is a repeated pattern in the population.
Q3. [18 marks]
The data set house_selling_prices.xlsx contains the data on a selection of houses sold in
State College, PA, USA, in 2015. The variables measured are:
Variable Value
House ID of house.
Taxes Taxes paid by homeowner.
Bedrooms Number of bedrooms.
Baths Number of bathrooms (.5 refers to a separate toilet).
Quadrant Location of home with city, (NW, NE, SW, SE).
NW Is the house in the NW quadrant, (True, False).
Price House selling price in $US.
Size Area of the house in square feet.
Lot Cost of the lot (land).
Page 6 of 10
© <Your Name> 2018
ID Number: Assignment 1 – 2018-SS
To use the systematic random sample to assess the amount of floor space dedicated for
promotions, we use the sample size of the 15 stores and divide total 60 floor into groups of
4 stores each. We randomly select one store in the first group the thereafter, we select
every 4th store in the other groups. This method should not be used if there is repeated
pattern in the population.
The advantages of systematic random sample are: It is simple to use if the population
has a structure and less time consuming.
The disadvantages of the method are: it is not accurate as compared to the simple random
sample and cannot be used when there is a repeated pattern in the population.
Q3. [18 marks]
The data set house_selling_prices.xlsx contains the data on a selection of houses sold in
State College, PA, USA, in 2015. The variables measured are:
Variable Value
House ID of house.
Taxes Taxes paid by homeowner.
Bedrooms Number of bedrooms.
Baths Number of bathrooms (.5 refers to a separate toilet).
Quadrant Location of home with city, (NW, NE, SW, SE).
NW Is the house in the NW quadrant, (True, False).
Price House selling price in $US.
Size Area of the house in square feet.
Lot Cost of the lot (land).
Page 6 of 10
© <Your Name> 2018
⊘ This is a preview!⊘
Do you want full access?
Subscribe today to unlock all pages.
Trusted by 1+ million students worldwide
Name: ____________________ 161.101 Statistics for Business
ID Number: Assignment 1 – 2018-SS
a) Calculate the summary statistics for Price and use them to complete the table
below.
The mean is a measure of central tendency defined by the sum of the all the
specified terms divided by the total specified terms.
μ= ∑ x
x
The median is the data value that occurs in the middle when the dataset is
arranged in either ascending or descending order.
The first quartile represents the value that occurs in the first quarter of the data
set ordered in ascending order.
The third quartile represents the value that occurs in the third quarter of the
data set ordered in ascending order.
Interquartile range is the difference between the first and the quartile.
IQr =IQ3−IQ1
Range is the difference between the maximum value and minimum value.
R=max−min
Standard deviation is the measure of dispersion and is the square root of
variance.
σ = √σ2
Statistic Price
Page 7 of 10
© <Your Name> 2018
Paraphrase This Document
Need a fresh take? Get an instant paraphrase of this document with our AI Paraphraser
Name: ____________________ 161.101 Statistics for Business
ID Number: Assignment 1 – 2018-SS
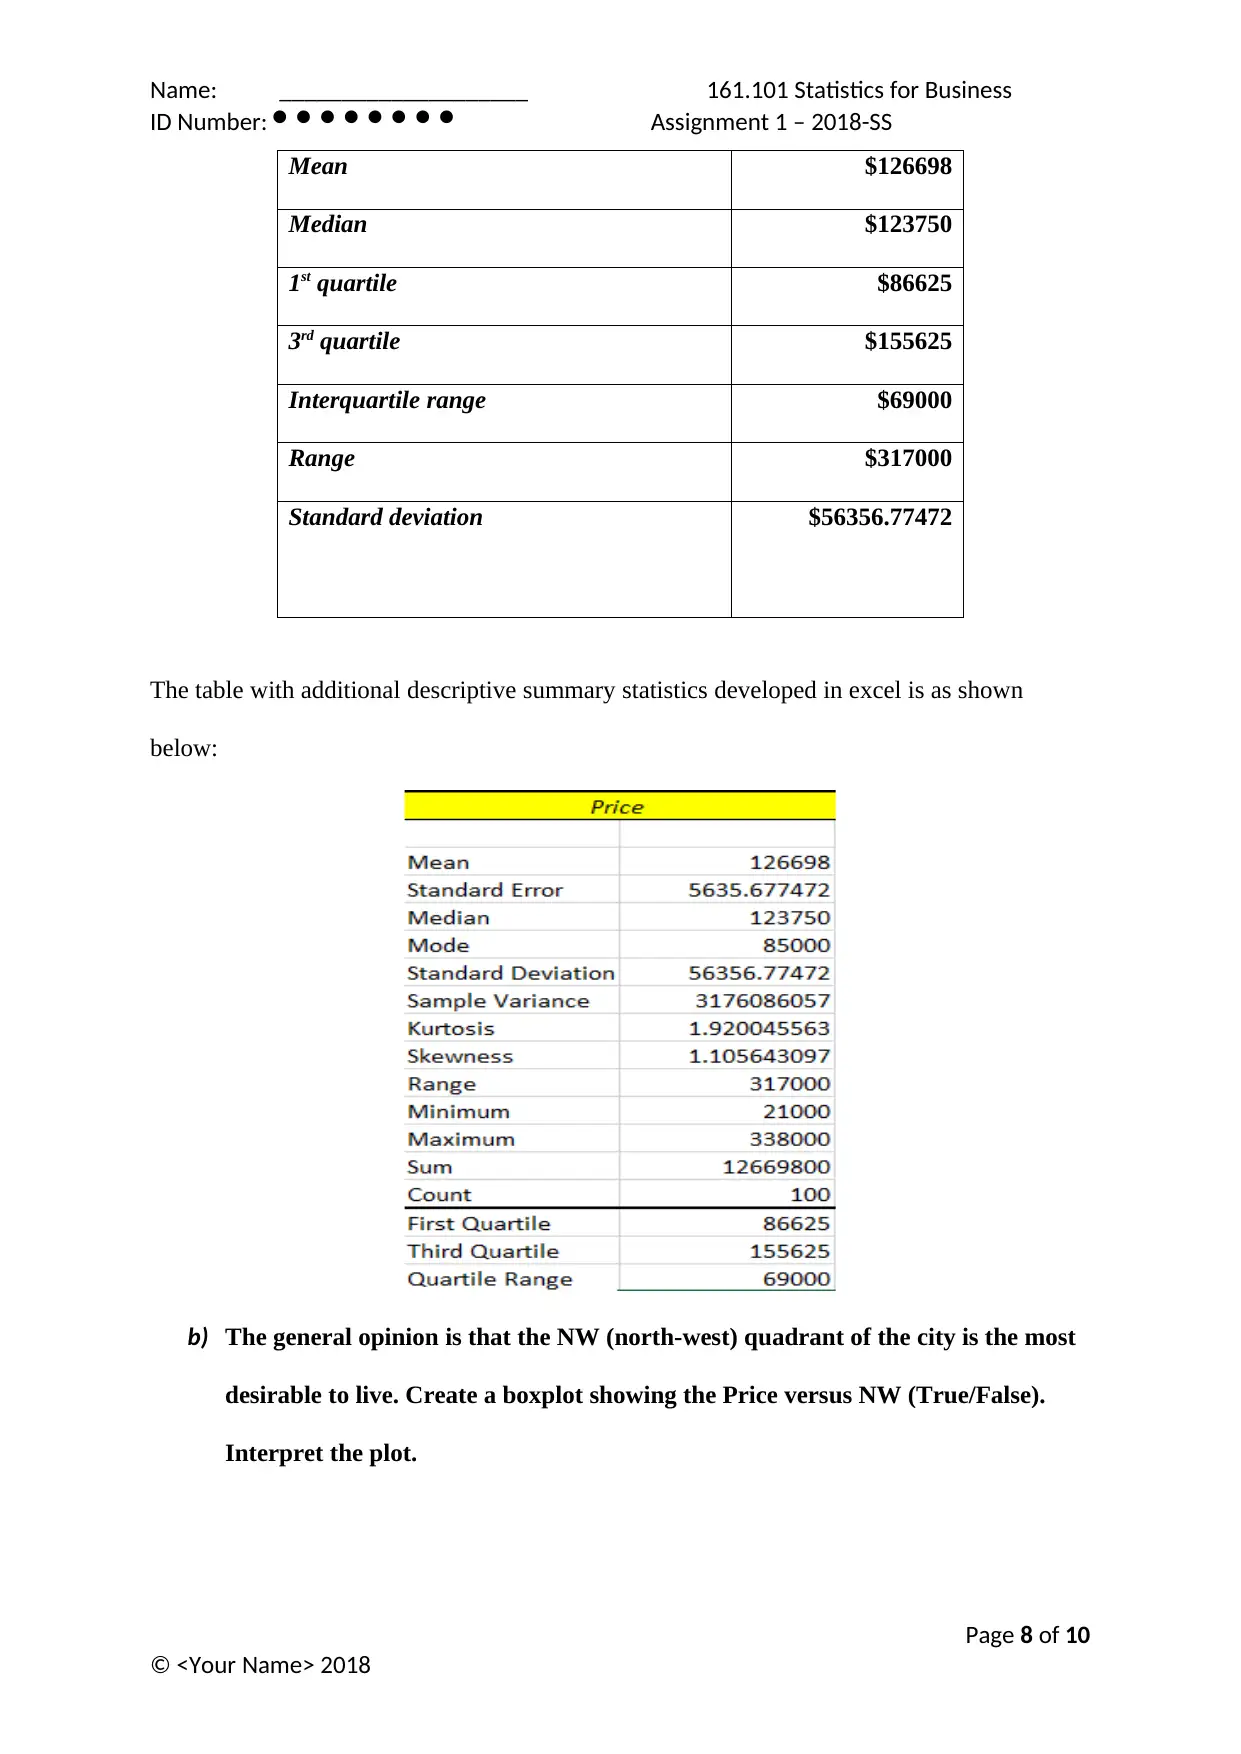
Mean $126698
Median $123750
1st quartile $86625
3rd quartile $155625
Interquartile range $69000
Range $317000
Standard deviation $56356.77472
The table with additional descriptive summary statistics developed in excel is as shown
below:
b) The general opinion is that the NW (north-west) quadrant of the city is the most
desirable to live. Create a boxplot showing the Price versus NW (True/False).
Interpret the plot.
Page 8 of 10
© <Your Name> 2018
ID Number: Assignment 1 – 2018-SS
Mean $126698
Median $123750
1st quartile $86625
3rd quartile $155625
Interquartile range $69000
Range $317000
Standard deviation $56356.77472
The table with additional descriptive summary statistics developed in excel is as shown
below:
b) The general opinion is that the NW (north-west) quadrant of the city is the most
desirable to live. Create a boxplot showing the Price versus NW (True/False).
Interpret the plot.
Page 8 of 10
© <Your Name> 2018
Name: ____________________ 161.101 Statistics for Business
ID Number: Assignment 1 – 2018-SS
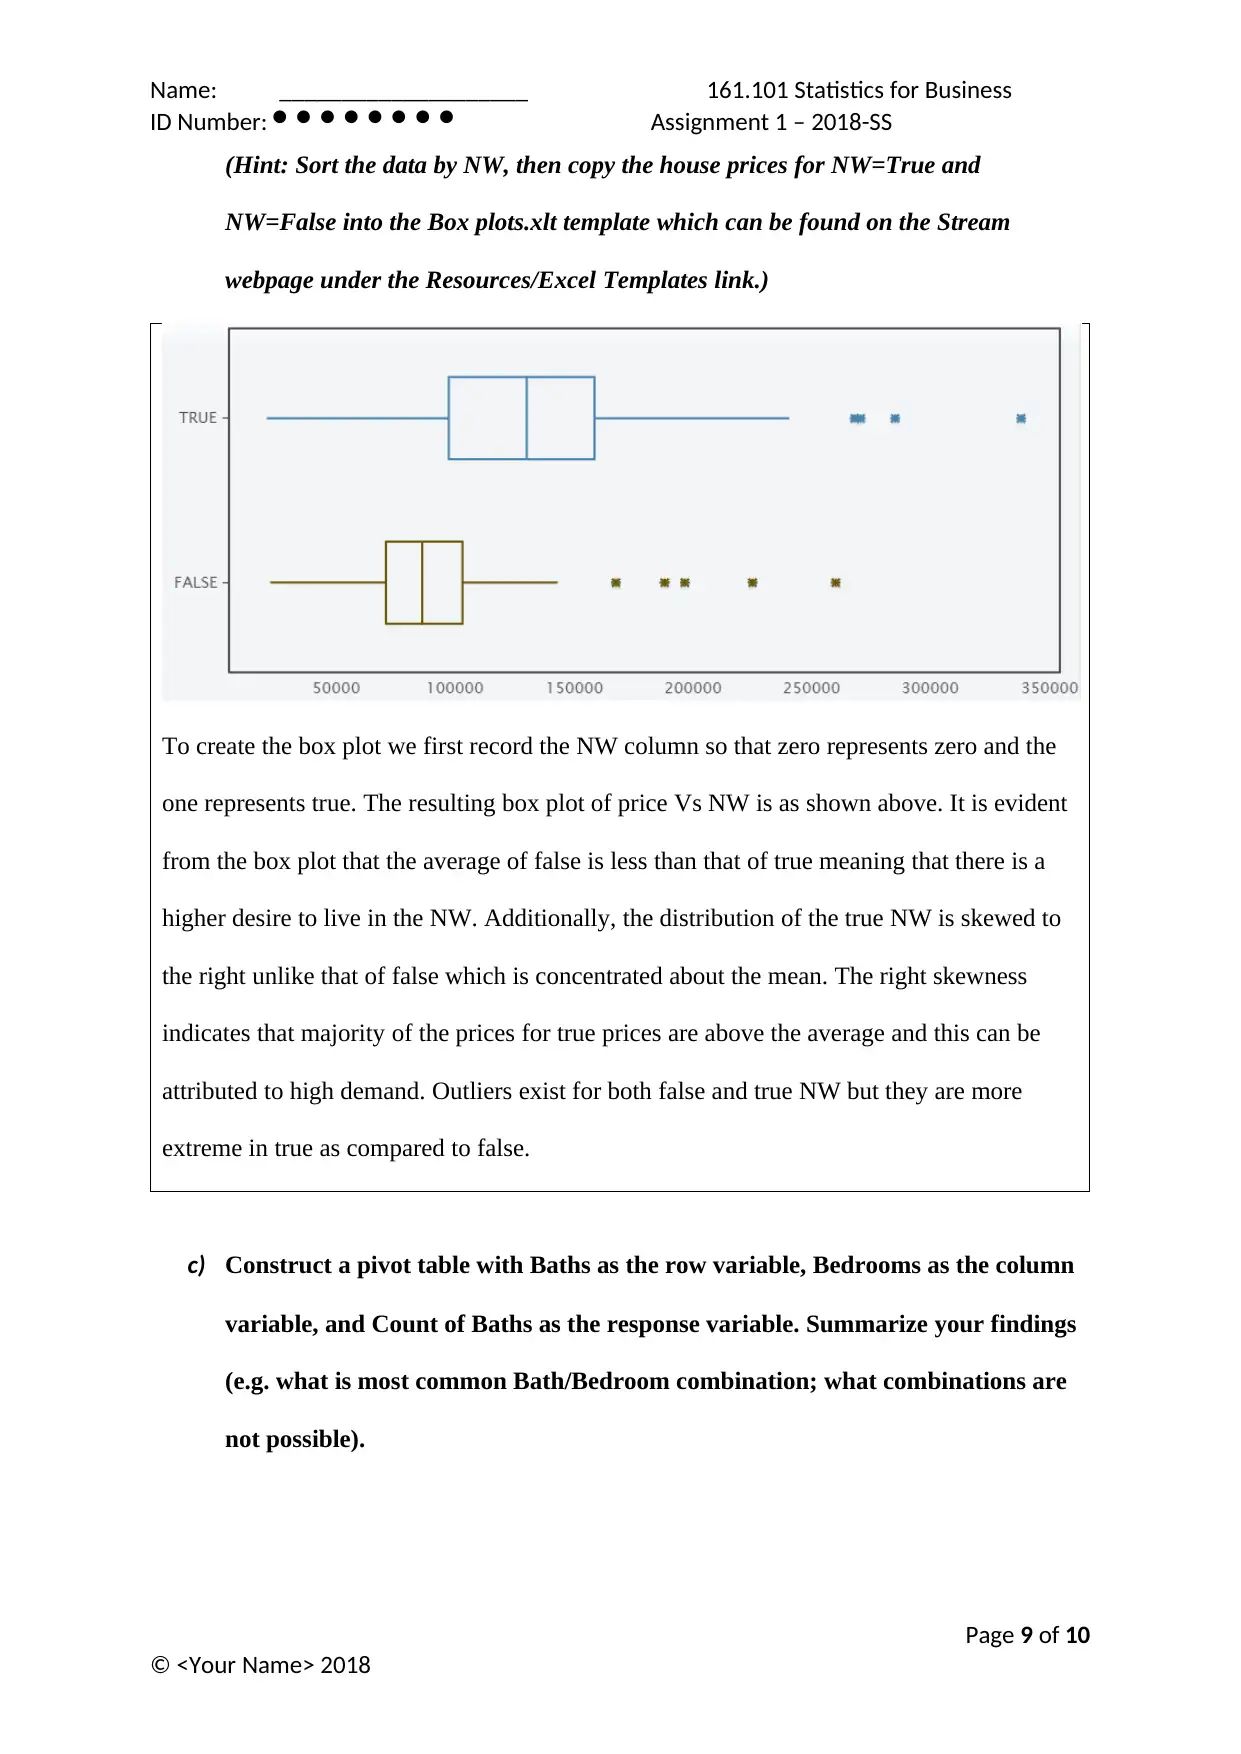
(Hint: Sort the data by NW, then copy the house prices for NW=True and
NW=False into the Box plots.xlt template which can be found on the Stream
webpage under the Resources/Excel Templates link.)
To create the box plot we first record the NW column so that zero represents zero and the
one represents true. The resulting box plot of price Vs NW is as shown above. It is evident
from the box plot that the average of false is less than that of true meaning that there is a
higher desire to live in the NW. Additionally, the distribution of the true NW is skewed to
the right unlike that of false which is concentrated about the mean. The right skewness
indicates that majority of the prices for true prices are above the average and this can be
attributed to high demand. Outliers exist for both false and true NW but they are more
extreme in true as compared to false.
c) Construct a pivot table with Baths as the row variable, Bedrooms as the column
variable, and Count of Baths as the response variable. Summarize your findings
(e.g. what is most common Bath/Bedroom combination; what combinations are
not possible).
Page 9 of 10
© <Your Name> 2018
ID Number: Assignment 1 – 2018-SS
(Hint: Sort the data by NW, then copy the house prices for NW=True and
NW=False into the Box plots.xlt template which can be found on the Stream
webpage under the Resources/Excel Templates link.)
To create the box plot we first record the NW column so that zero represents zero and the
one represents true. The resulting box plot of price Vs NW is as shown above. It is evident
from the box plot that the average of false is less than that of true meaning that there is a
higher desire to live in the NW. Additionally, the distribution of the true NW is skewed to
the right unlike that of false which is concentrated about the mean. The right skewness
indicates that majority of the prices for true prices are above the average and this can be
attributed to high demand. Outliers exist for both false and true NW but they are more
extreme in true as compared to false.
c) Construct a pivot table with Baths as the row variable, Bedrooms as the column
variable, and Count of Baths as the response variable. Summarize your findings
(e.g. what is most common Bath/Bedroom combination; what combinations are
not possible).
Page 9 of 10
© <Your Name> 2018
⊘ This is a preview!⊘
Do you want full access?
Subscribe today to unlock all pages.
Trusted by 1+ million students worldwide
Name: ____________________ 161.101 Statistics for Business
ID Number: Assignment 1 – 2018-SS
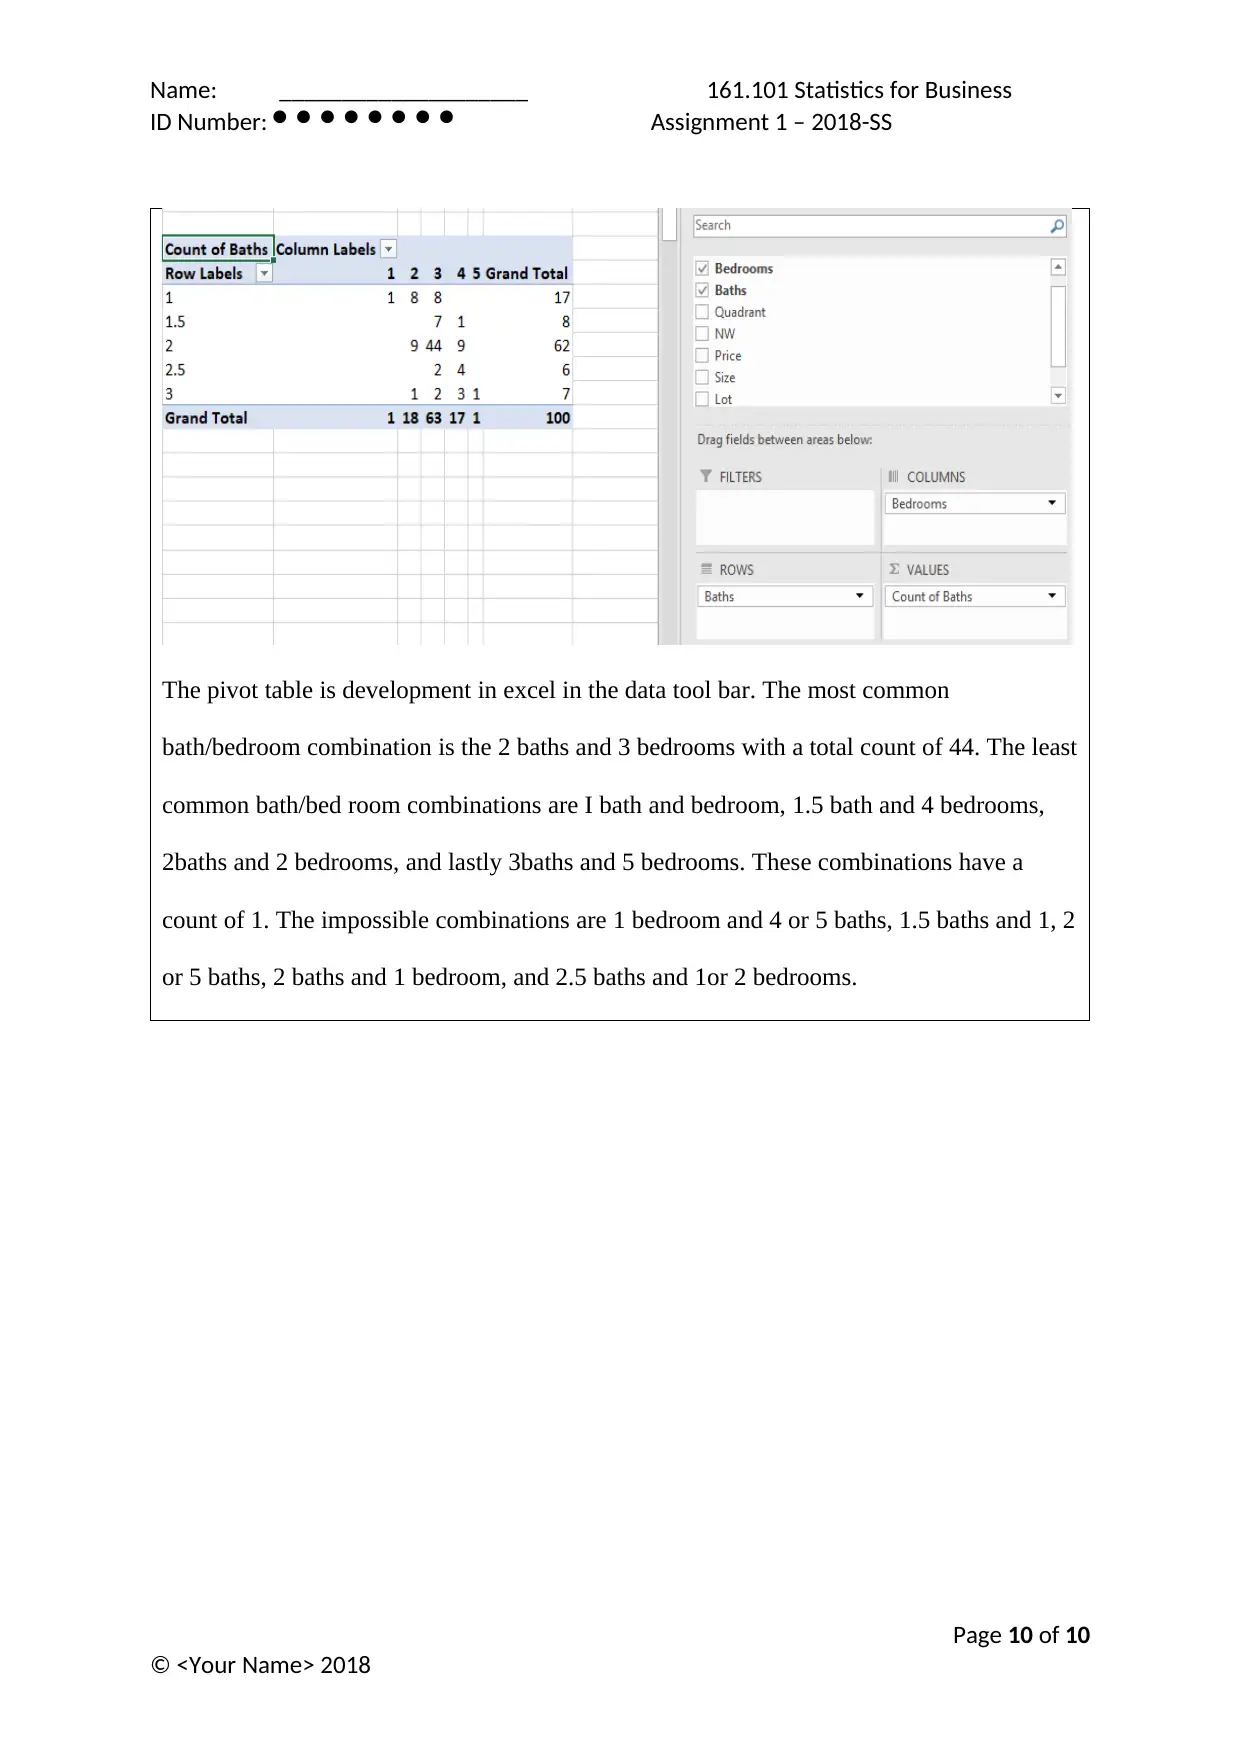
The pivot table is development in excel in the data tool bar. The most common
bath/bedroom combination is the 2 baths and 3 bedrooms with a total count of 44. The least
common bath/bed room combinations are I bath and bedroom, 1.5 bath and 4 bedrooms,
2baths and 2 bedrooms, and lastly 3baths and 5 bedrooms. These combinations have a
count of 1. The impossible combinations are 1 bedroom and 4 or 5 baths, 1.5 baths and 1, 2
or 5 baths, 2 baths and 1 bedroom, and 2.5 baths and 1or 2 bedrooms.
Page 10 of 10
© <Your Name> 2018
ID Number: Assignment 1 – 2018-SS
The pivot table is development in excel in the data tool bar. The most common
bath/bedroom combination is the 2 baths and 3 bedrooms with a total count of 44. The least
common bath/bed room combinations are I bath and bedroom, 1.5 bath and 4 bedrooms,
2baths and 2 bedrooms, and lastly 3baths and 5 bedrooms. These combinations have a
count of 1. The impossible combinations are 1 bedroom and 4 or 5 baths, 1.5 baths and 1, 2
or 5 baths, 2 baths and 1 bedroom, and 2.5 baths and 1or 2 bedrooms.
Page 10 of 10
© <Your Name> 2018
1 out of 10
Your All-in-One AI-Powered Toolkit for Academic Success.
+13062052269
info@desklib.com
Available 24*7 on WhatsApp / Email
![[object Object]](/_next/static/media/star-bottom.7253800d.svg)
Unlock your academic potential
Copyright © 2020–2026 A2Z Services. All Rights Reserved. Developed and managed by ZUCOL.