Statistics for Business, Semester 1 Assignment: Solutions Included
VerifiedAdded on 2020/03/16
|11
|1372
|307
Homework Assignment
AI Summary
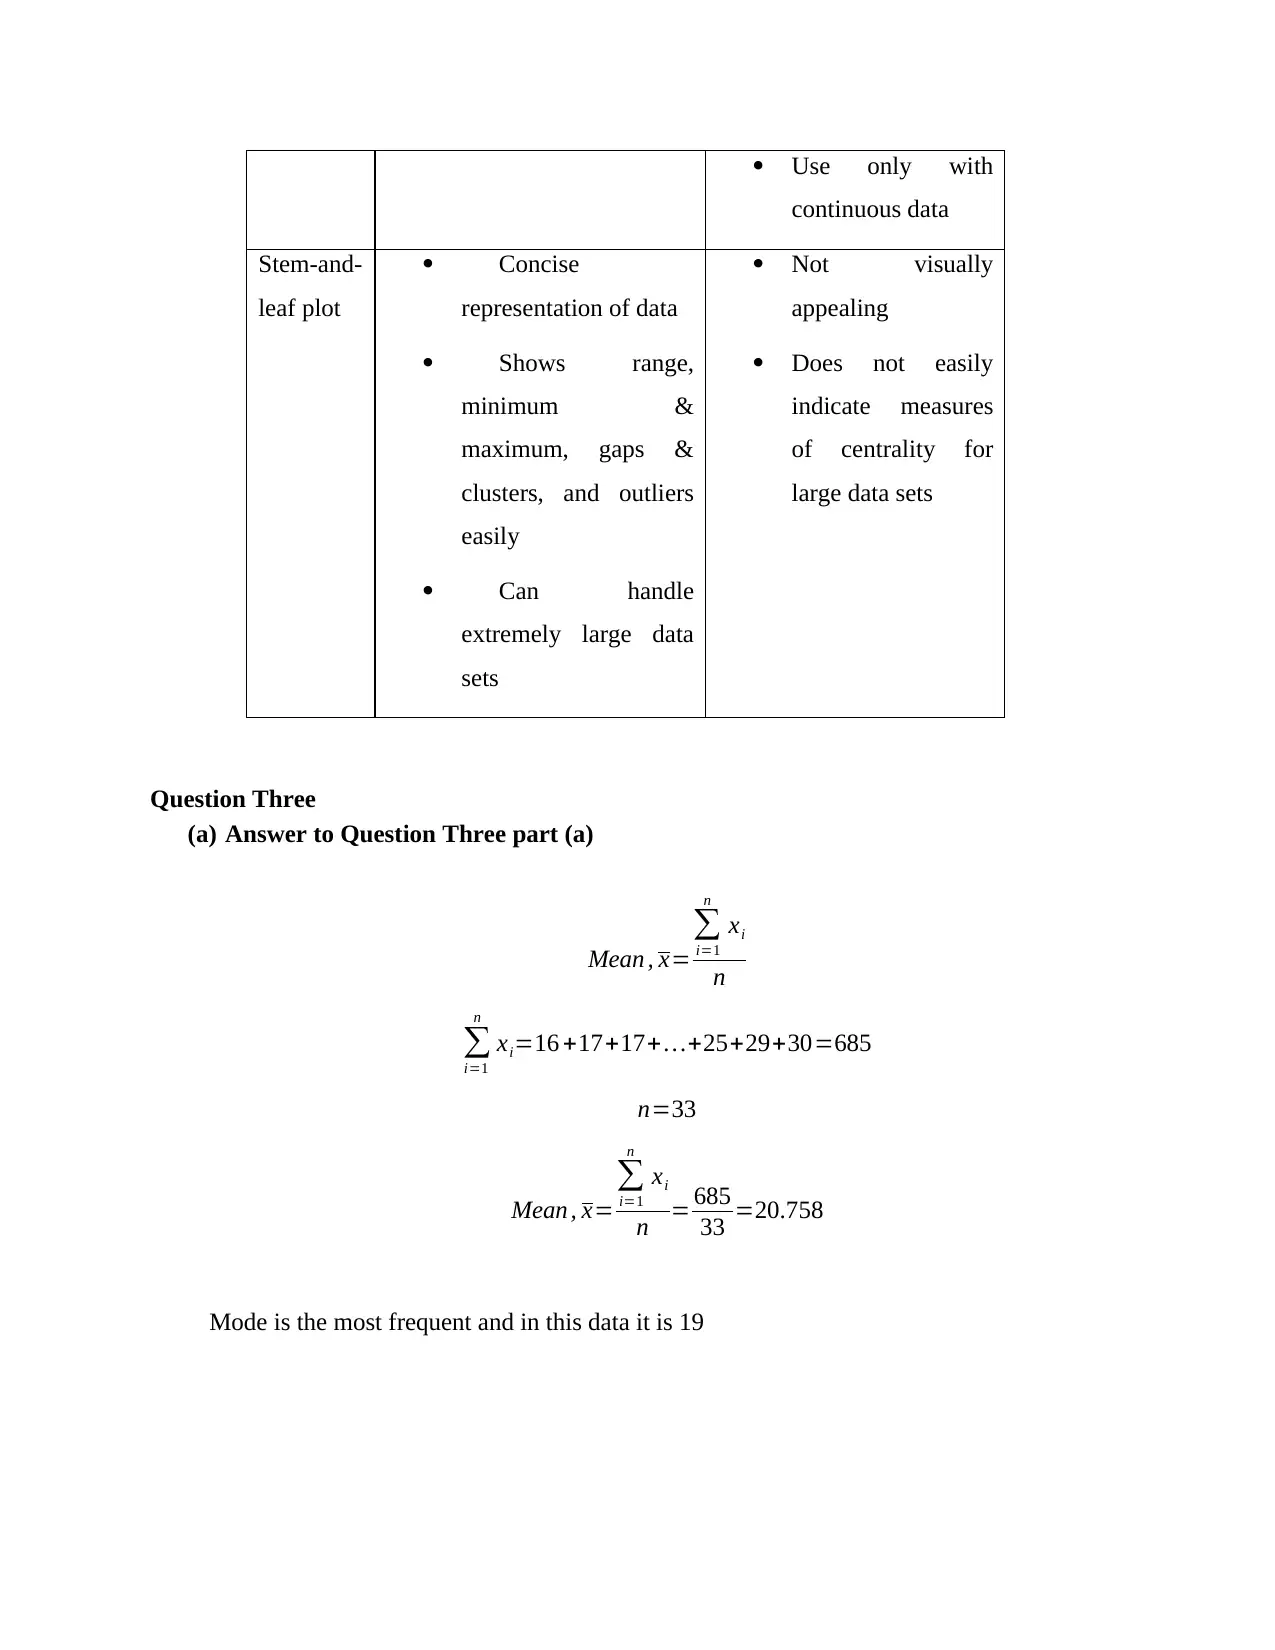
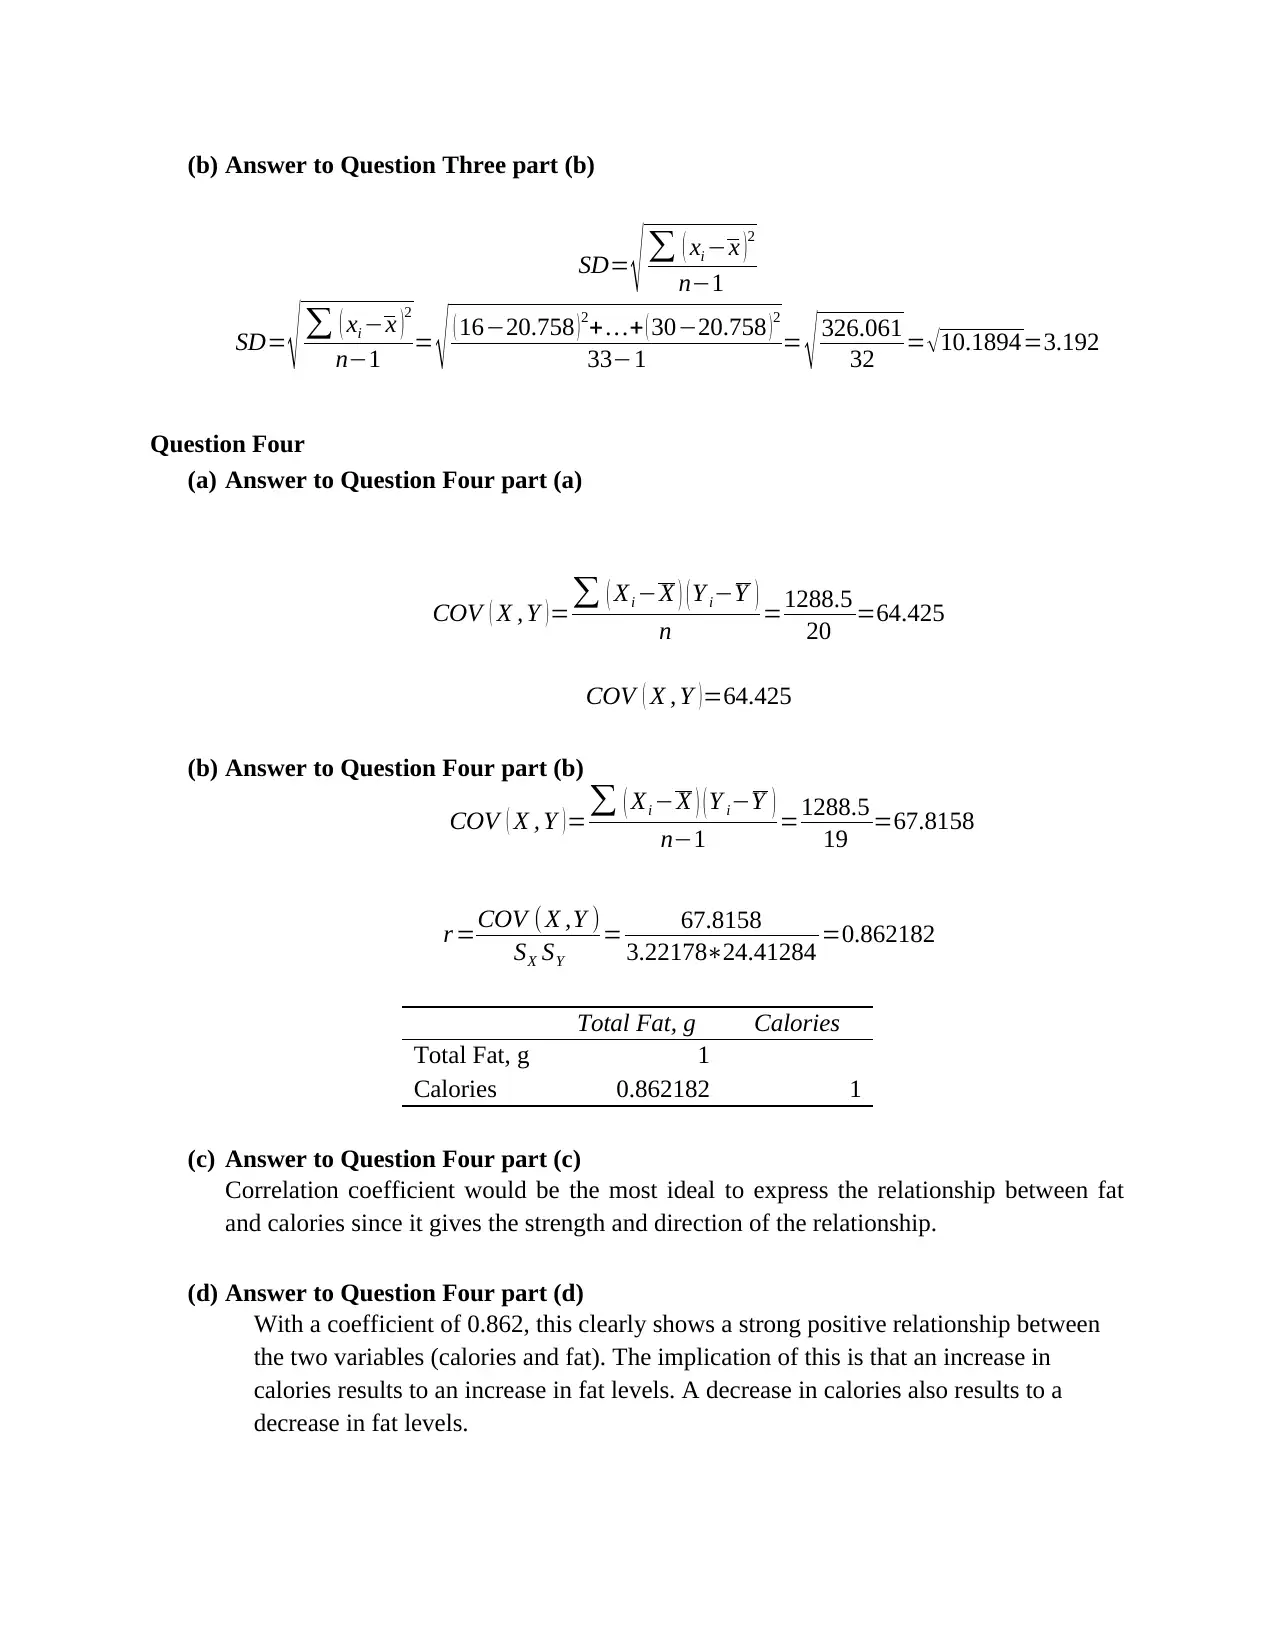
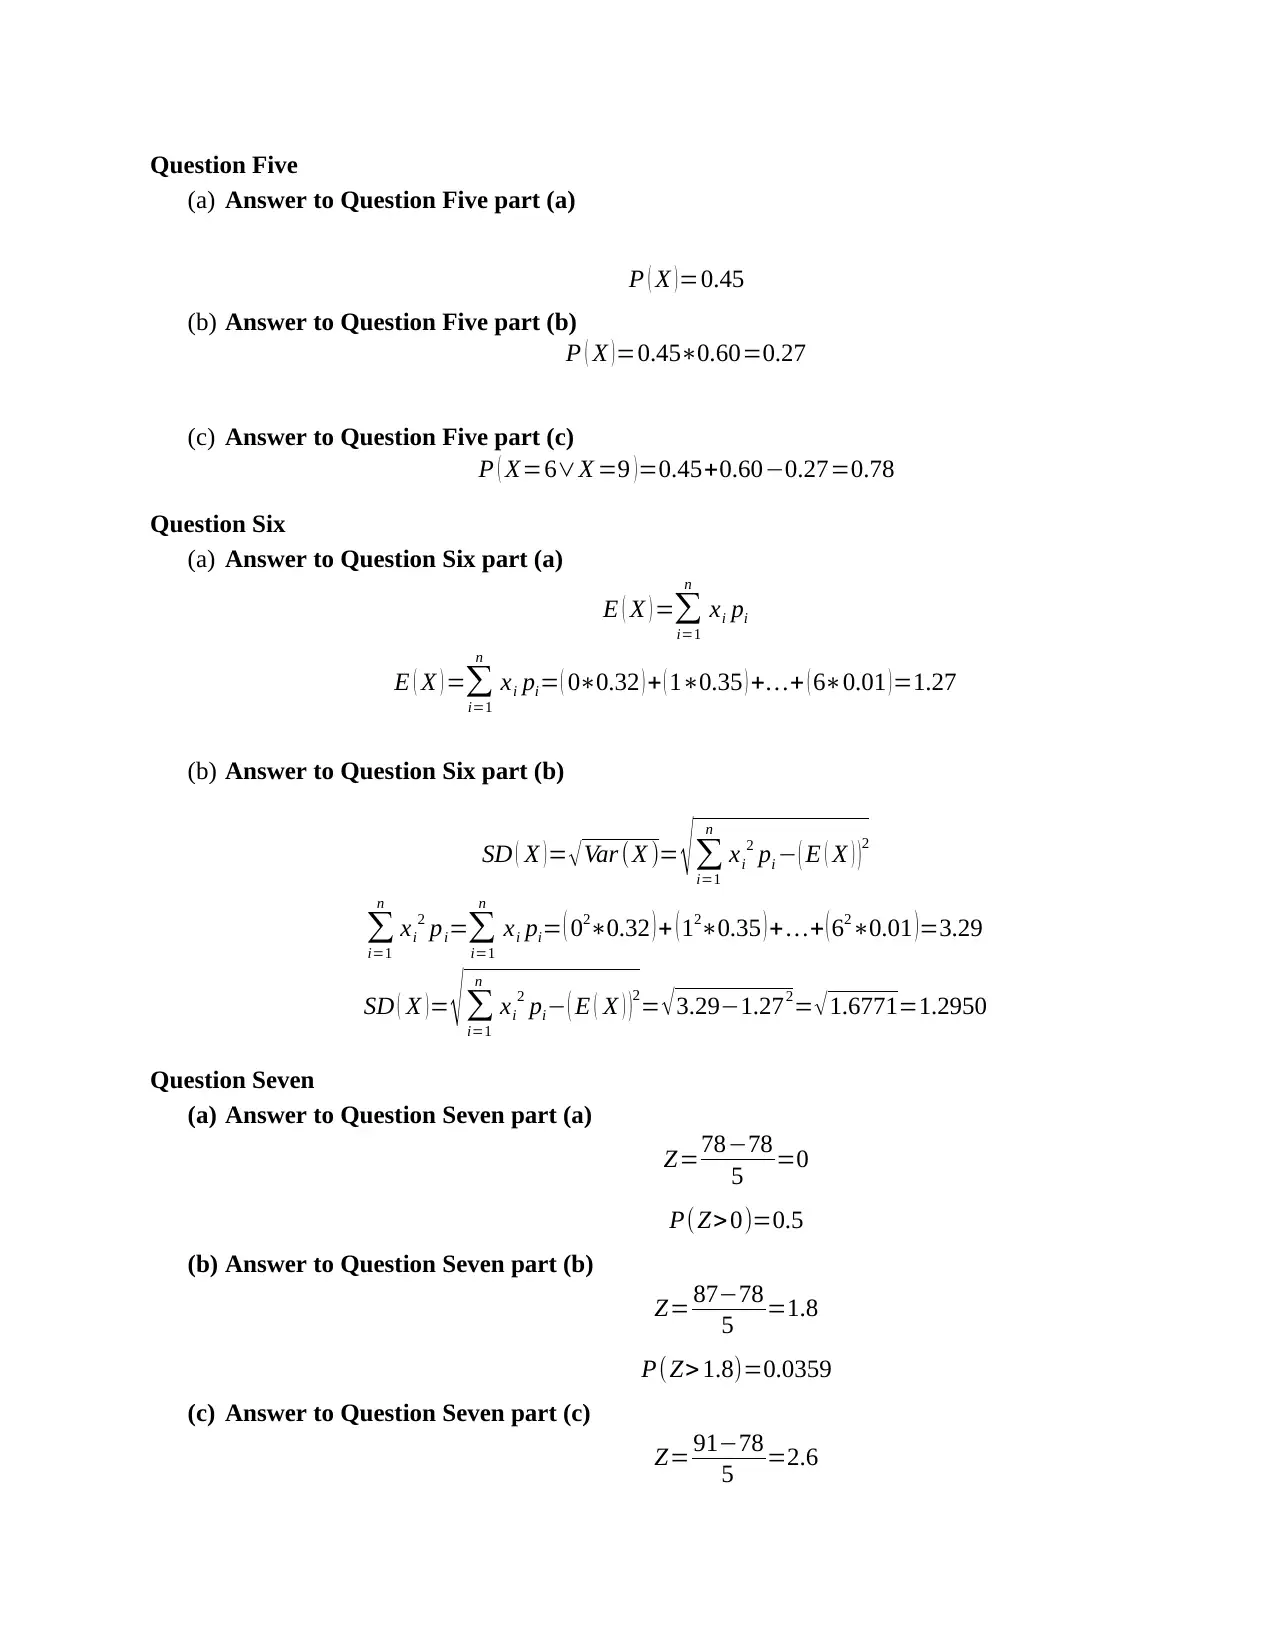
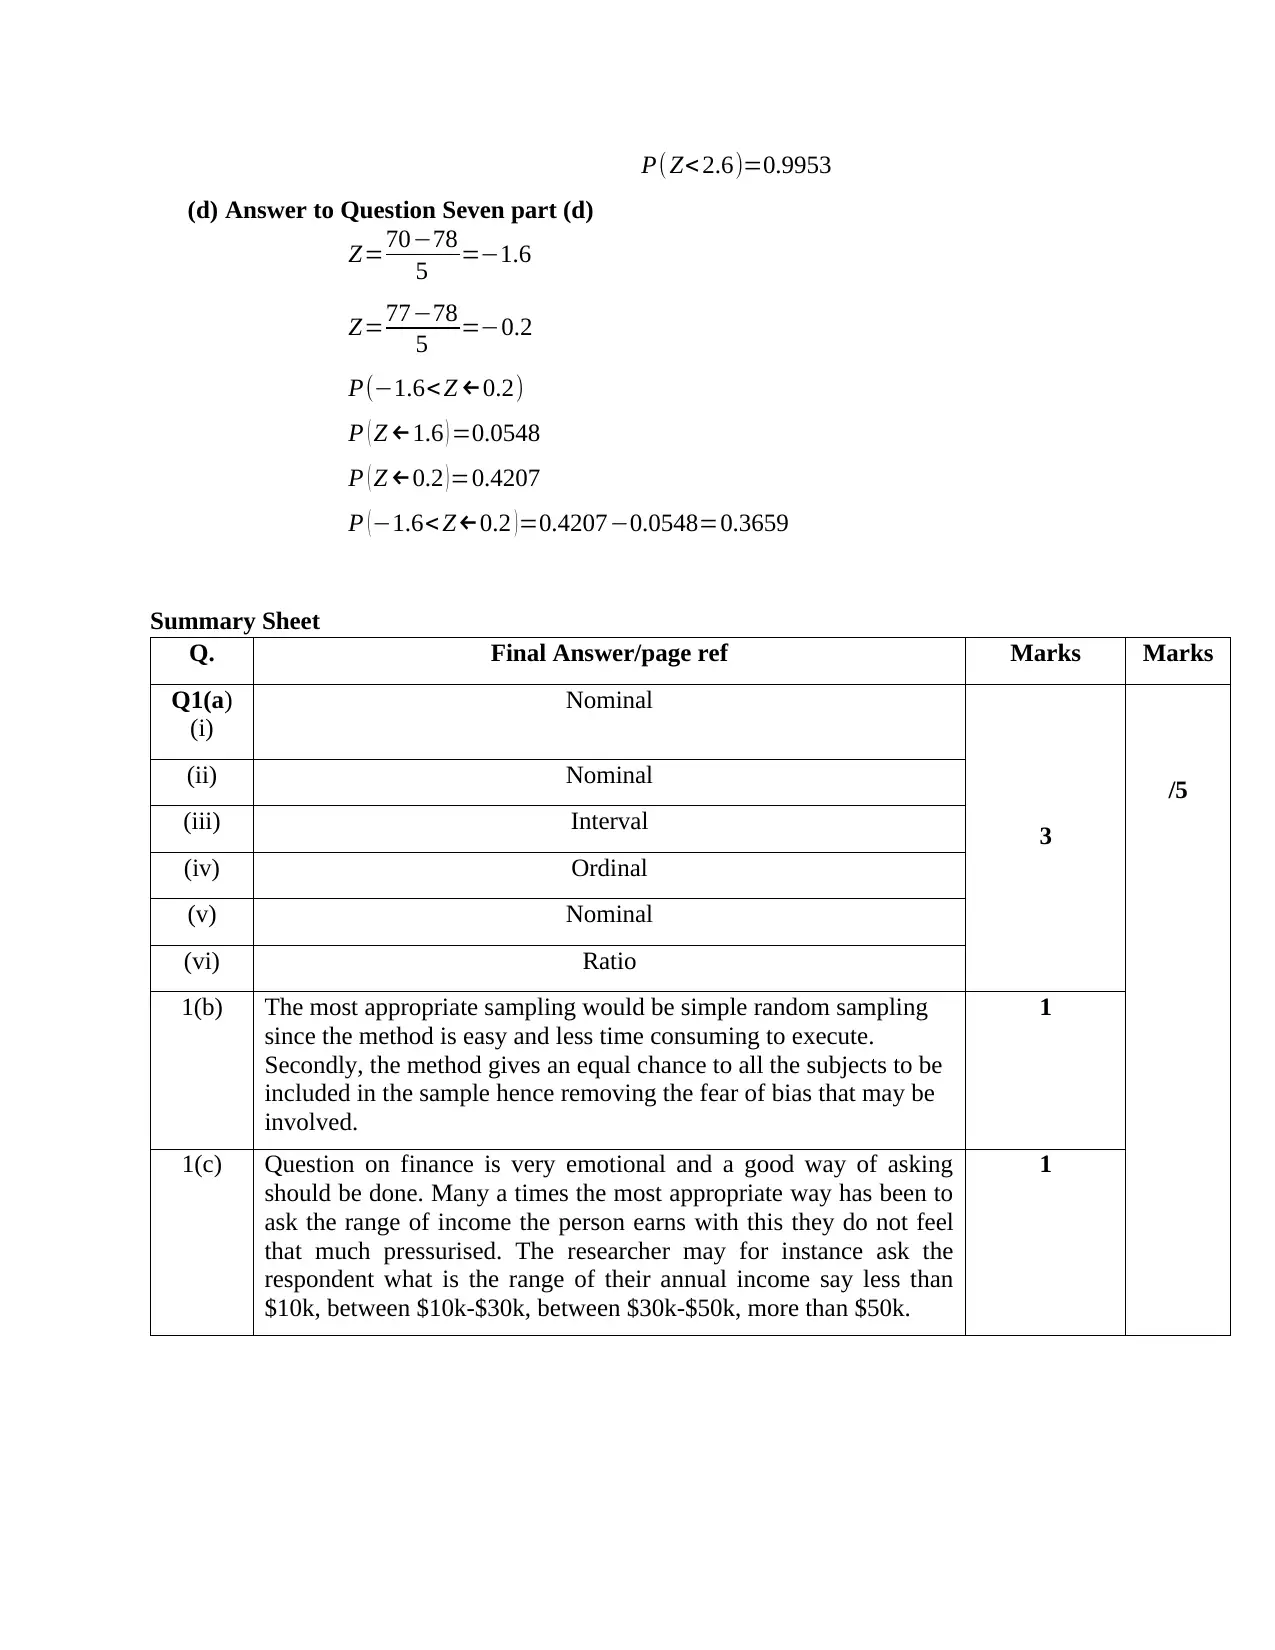
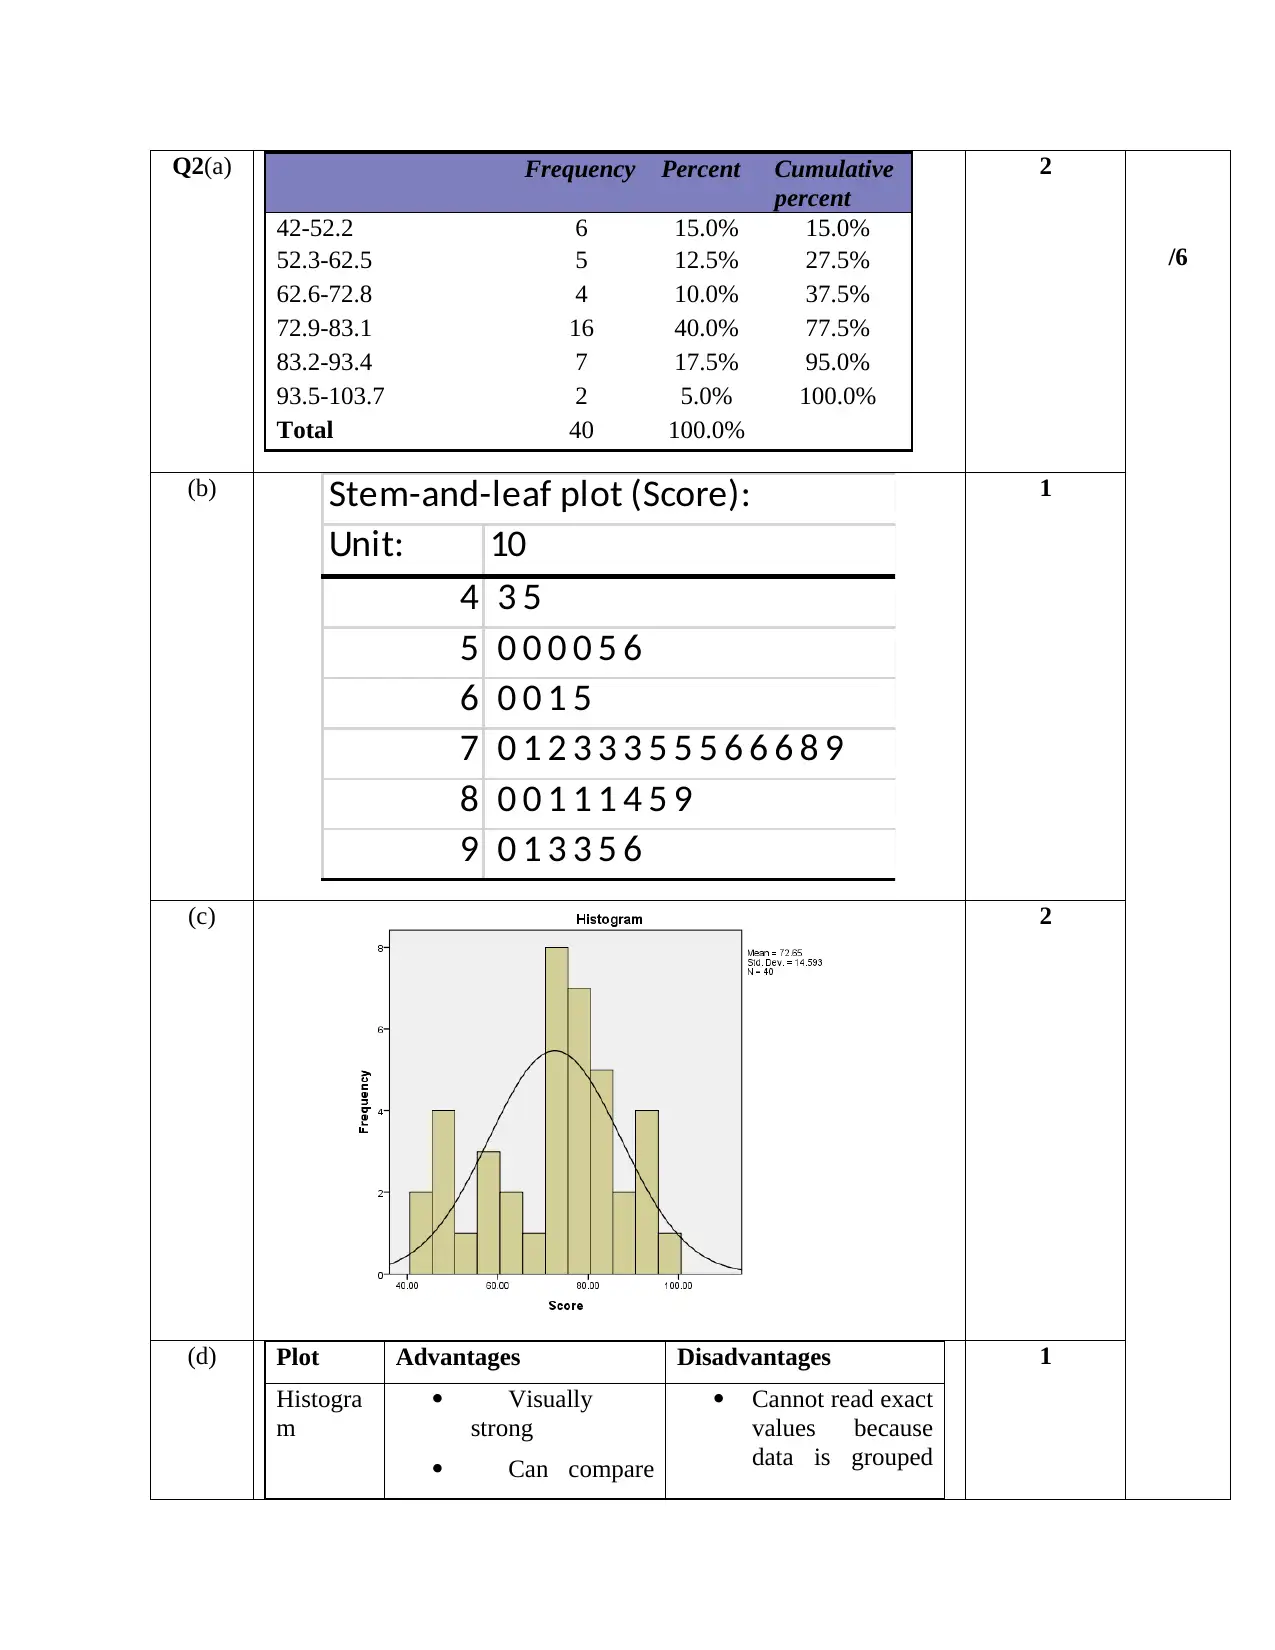
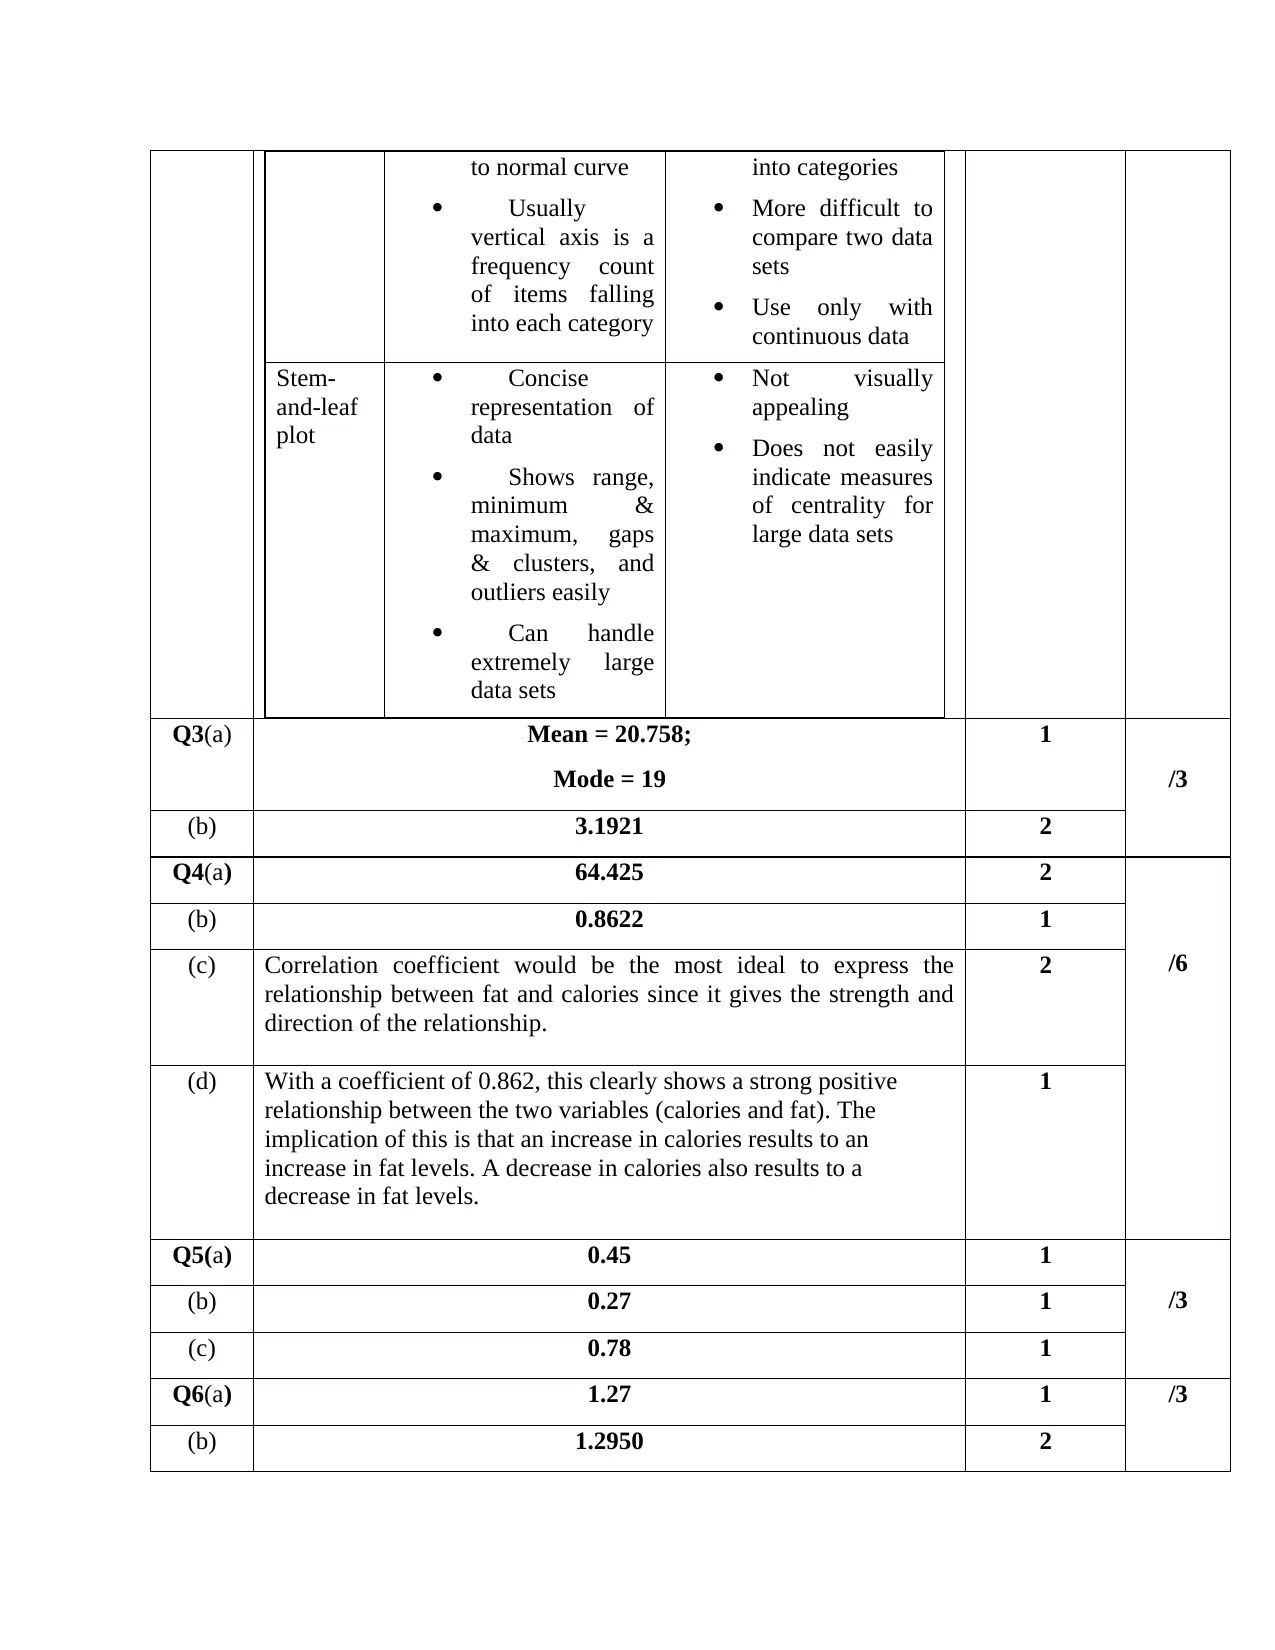
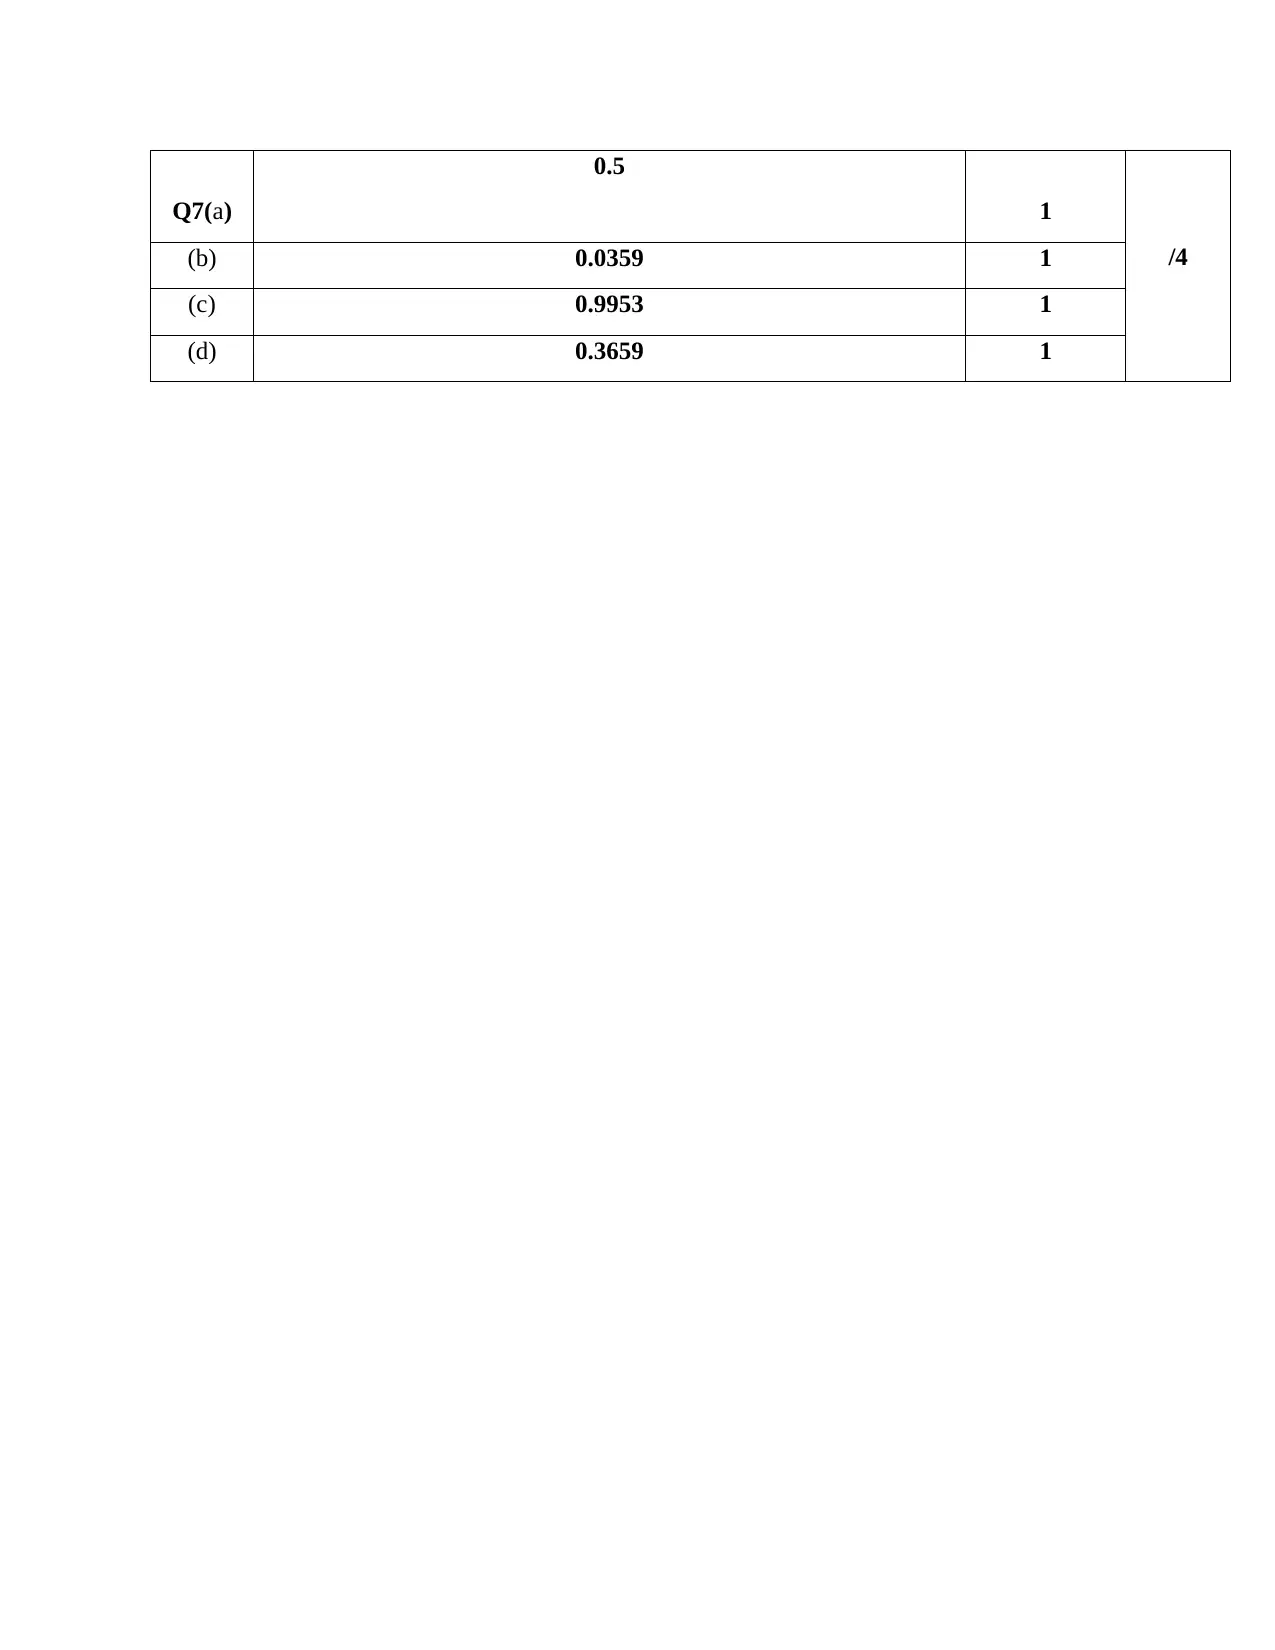
This statistics assignment solution covers a range of topics relevant to business statistics, including data types, sampling techniques, frequency distributions, and measures of central tendency. The assignment delves into the analysis of data, such as calculating frequencies, constructing histograms and...

Statistics for business
Group:
Student Numbers:
Lecturer Name:
30th September 2017
Group:
Student Numbers:
Lecturer Name:
30th September 2017
Secure Best Marks with AI Grader
Need help grading? Try our AI Grader for instant feedback on your assignments.

Table of Contents
Question One:..............................................................................................................................................3
(a) Answers to Question One part (a)................................................................................................3
(b) Answer to Question One part (b).................................................................................................3
(c) Answer to Question One part (c).................................................................................................3
Question Two..............................................................................................................................................3
(a) Answer to Question Two part (a).................................................................................................3
(b) Answer to Question Two part (b)................................................................................................4
(c) Answer to Question Two part (c).................................................................................................4
(d) Answer to Question Two part (d)................................................................................................4
Question Three............................................................................................................................................5
(a) Answer to Question Three part (a)...............................................................................................5
(b) Answer to Question Three part (b)...............................................................................................5
Question Four..............................................................................................................................................6
(a) Answer to Question Four part (a)................................................................................................6
(b) Answer to Question Four part (b)................................................................................................6
(c) Answer to Question Four part (c)................................................................................................6
(d) Answer to Question Four part (d)................................................................................................6
Question Five..............................................................................................................................................7
(a) Answer to Question Five part (a).................................................................................................7
(b) Answer to Question Five part (b).................................................................................................7
(c) Answer to Question Five part (c).................................................................................................7
Question Six................................................................................................................................................7
(a) Answer to Question Six part (a)...................................................................................................7
(b) Answer to Question Six part (b)..................................................................................................7
Question Seven............................................................................................................................................7
(a) Answer to Question Seven part (a)..............................................................................................7
(b) Answer to Question Seven part (b)..............................................................................................7
(c) Answer to Question Seven part (c)..............................................................................................8
(d) Answer to Question Seven part (d)..............................................................................................8
Summary Sheet...........................................................................................................................................8

Question One:
(a) Answers to Question One part (a)
(i) Nominal
(ii) Nominal
(iii) Interval
(iv) Ordinal
(v) Nominal
(vi) Ratio
(b) Answer to Question One part (b)
The most appropriate sampling would be simple random sampling since the method is
easy and less time consuming to execute. Secondly, the method gives an equal chance
to all the subjects to be included in the sample hence removing the fear of bias that may
be involved.
(c) Answer to Question One part (c)
Question on finance is very emotional and a good way of asking should be done. Many
a times the most appropriate way has been to ask the range of income the person earns
with this they do not feel that much pressurised. The researcher may for instance ask
the respondent what is the range of their annual income say less than $10k, between
$10k-$30k, between $30k-$50k, more than $50k.
Question Two
(a) Answer to Question Two part (a)
Frequency Percent Cumulative percent
42-52.2 6 15.0% 15.0%
52.3-62.5 5 12.5% 27.5%
62.6-72.8 4 10.0% 37.5%
72.9-83.1 16 40.0% 77.5%
83.2-93.4 7 17.5% 95.0%
93.5-103.7 2 5.0% 100.0%
Total 40 100.0%

(b) Answer to Question Two part (b)
Stem-and-leaf plot (Score):
Unit: 10
4 3 5
5 0 0 0 0 5 6
6 0 0 1 5
7 0 1 2 3 3 3 5 5 5 6 6 6 8 9
8 0 0 1 1 1 4 5 9
9 0 1 3 3 5 6
(c) Answer to Question Two part (c)
(d) Answer to Question Two part (d)
Plot Advantages Disadvantages
Histogram Visually strong
Can compare to
normal curve
Usually vertical
axis is a frequency
count of items falling
into each category
Cannot read exact
values because data
is grouped into
categories
More difficult to
compare two data
sets
Secure Best Marks with AI Grader
Need help grading? Try our AI Grader for instant feedback on your assignments.

Use only with
continuous data
Stem-and-
leaf plot
Concise
representation of data
Shows range,
minimum &
maximum, gaps &
clusters, and outliers
easily
Can handle
extremely large data
sets
Not visually
appealing
Does not easily
indicate measures
of centrality for
large data sets
Question Three
(a) Answer to Question Three part (a)
Mean , x=
∑
i=1
n
xi
n
∑
i=1
n
xi=16 +17+17+ …+25+29+30=685
n=33
Mean , x=
∑
i=1
n
xi
n = 685
33 =20.758
Mode is the most frequent and in this data it is 19

(b) Answer to Question Three part (b)
SD= √ ∑ ( xi −x ) 2
n−1
SD= √ ∑ ( xi −x )2
n−1 = √ ( 16−20.758 )2+ …+ ( 30−20.758 )2
33−1 = √ 326.061
32 = √10.1894=3.192
Question Four
(a) Answer to Question Four part (a)
COV ( X , Y )=∑ ( Xi −X ) ( Y i−Y )
n =1288.5
20 =64.425
COV ( X , Y )=64.425
(b) Answer to Question Four part (b)
COV ( X , Y ) =∑ ( Xi −X ) ( Y i−Y )
n−1 =1288.5
19 =67.8158
r =COV ( X ,Y )
SX SY
= 67.8158
3.22178∗24.41284 =0.862182
Total Fat, g Calories
Total Fat, g 1
Calories 0.862182 1
(c) Answer to Question Four part (c)
Correlation coefficient would be the most ideal to express the relationship between fat
and calories since it gives the strength and direction of the relationship.
(d) Answer to Question Four part (d)
With a coefficient of 0.862, this clearly shows a strong positive relationship between
the two variables (calories and fat). The implication of this is that an increase in
calories results to an increase in fat levels. A decrease in calories also results to a
decrease in fat levels.

Question Five
(a) Answer to Question Five part (a)
P ( X ) =0.45
(b) Answer to Question Five part (b)
P ( X ) =0.45∗0.60=0.27
(c) Answer to Question Five part (c)
P ( X=6∨X =9 ) =0.45+0.60−0.27=0.78
Question Six
(a) Answer to Question Six part (a)
E ( X ) =∑
i=1
n
xi pi
E ( X ) =∑
i=1
n
xi pi= ( 0∗0.32 ) + ( 1∗0.35 ) +…+ ( 6∗0.01 )=1.27
(b) Answer to Question Six part (b)
SD ( X )= √Var (X )= √∑
i=1
n
xi
2 pi − ( E ( X ) )2
∑
i=1
n
xi
2 pi=∑
i=1
n
xi pi= ( 02∗0.32 ) + ( 12∗0.35 ) +…+ ( 62∗0.01 )=3.29
SD ( X ) = √ ∑
i=1
n
xi
2 pi− ( E ( X ) )
2= √ 3.29−1.272= √ 1.6771=1.2950
Question Seven
(a) Answer to Question Seven part (a)
Z=78−78
5 =0
P(Z> 0)=0.5
(b) Answer to Question Seven part (b)
Z= 87−78
5 =1.8
P(Z> 1.8)=0.0359
(c) Answer to Question Seven part (c)
Z= 91−78
5 =2.6
Paraphrase This Document
Need a fresh take? Get an instant paraphrase of this document with our AI Paraphraser

P( Z< 2.6)=0.9953
(d) Answer to Question Seven part (d)
Z=70−78
5 =−1.6
Z=77−78
5 =−0.2
P(−1.6< Z ←0.2)
P ( Z ←1.6 ) =0.0548
P ( Z ←0.2 )=0.4207
P ( −1.6< Z←0.2 ) =0.4207−0.0548=0.3659
Summary Sheet
Q. Final Answer/page ref Marks Marks
Q1(a)
(i)
Nominal
3
/5
(ii) Nominal
(iii) Interval
(iv) Ordinal
(v) Nominal
(vi) Ratio
1(b) The most appropriate sampling would be simple random sampling
since the method is easy and less time consuming to execute.
Secondly, the method gives an equal chance to all the subjects to be
included in the sample hence removing the fear of bias that may be
involved.
1
1(c) Question on finance is very emotional and a good way of asking
should be done. Many a times the most appropriate way has been to
ask the range of income the person earns with this they do not feel
that much pressurised. The researcher may for instance ask the
respondent what is the range of their annual income say less than
$10k, between $10k-$30k, between $30k-$50k, more than $50k.
1

Q2(a) Frequency Percent Cumulative
percent
42-52.2 6 15.0% 15.0%
52.3-62.5 5 12.5% 27.5%
62.6-72.8 4 10.0% 37.5%
72.9-83.1 16 40.0% 77.5%
83.2-93.4 7 17.5% 95.0%
93.5-103.7 2 5.0% 100.0%
Total 40 100.0%
2
/6
(b) Stem-and-leaf plot (Score):
Unit: 10
4 3 5
5 0 0 0 0 5 6
6 0 0 1 5
7 0 1 2 3 3 3 5 5 5 6 6 6 8 9
8 0 0 1 1 1 4 5 9
9 0 1 3 3 5 6
1
(c) 2
(d) Plot Advantages Disadvantages
Histogra
m
Visually
strong
Can compare
Cannot read exact
values because
data is grouped
1

to normal curve
Usually
vertical axis is a
frequency count
of items falling
into each category
into categories
More difficult to
compare two data
sets
Use only with
continuous data
Stem-
and-leaf
plot
Concise
representation of
data
Shows range,
minimum &
maximum, gaps
& clusters, and
outliers easily
Can handle
extremely large
data sets
Not visually
appealing
Does not easily
indicate measures
of centrality for
large data sets
Q3(a) Mean = 20.758;
Mode = 19
1
/3
(b) 3.1921 2
Q4(a) 64.425 2
/6
(b) 0.8622 1
(c) Correlation coefficient would be the most ideal to express the
relationship between fat and calories since it gives the strength and
direction of the relationship.
2
(d) With a coefficient of 0.862, this clearly shows a strong positive
relationship between the two variables (calories and fat). The
implication of this is that an increase in calories results to an
increase in fat levels. A decrease in calories also results to a
decrease in fat levels.
1
Q5(a) 0.45 1
/3(b) 0.27 1
(c) 0.78 1
Q6(a) 1.27 1 /3
(b) 1.2950 2
Secure Best Marks with AI Grader
Need help grading? Try our AI Grader for instant feedback on your assignments.

Q7(a)
0.5
1
/4(b) 0.0359 1
(c) 0.9953 1
(d) 0.3659 1
0.5
1
/4(b) 0.0359 1
(c) 0.9953 1
(d) 0.3659 1
1 out of 11
Related Documents

Your All-in-One AI-Powered Toolkit for Academic Success.
+13062052269
info@desklib.com
Available 24*7 on WhatsApp / Email
Unlock your academic potential
© 2024 | Zucol Services PVT LTD | All rights reserved.