HI6007 Statistics and Research Methods Group Assignment

Verified

Added on  2022/11/13

|10
|734
|343
Homework Assignment
AI Summary
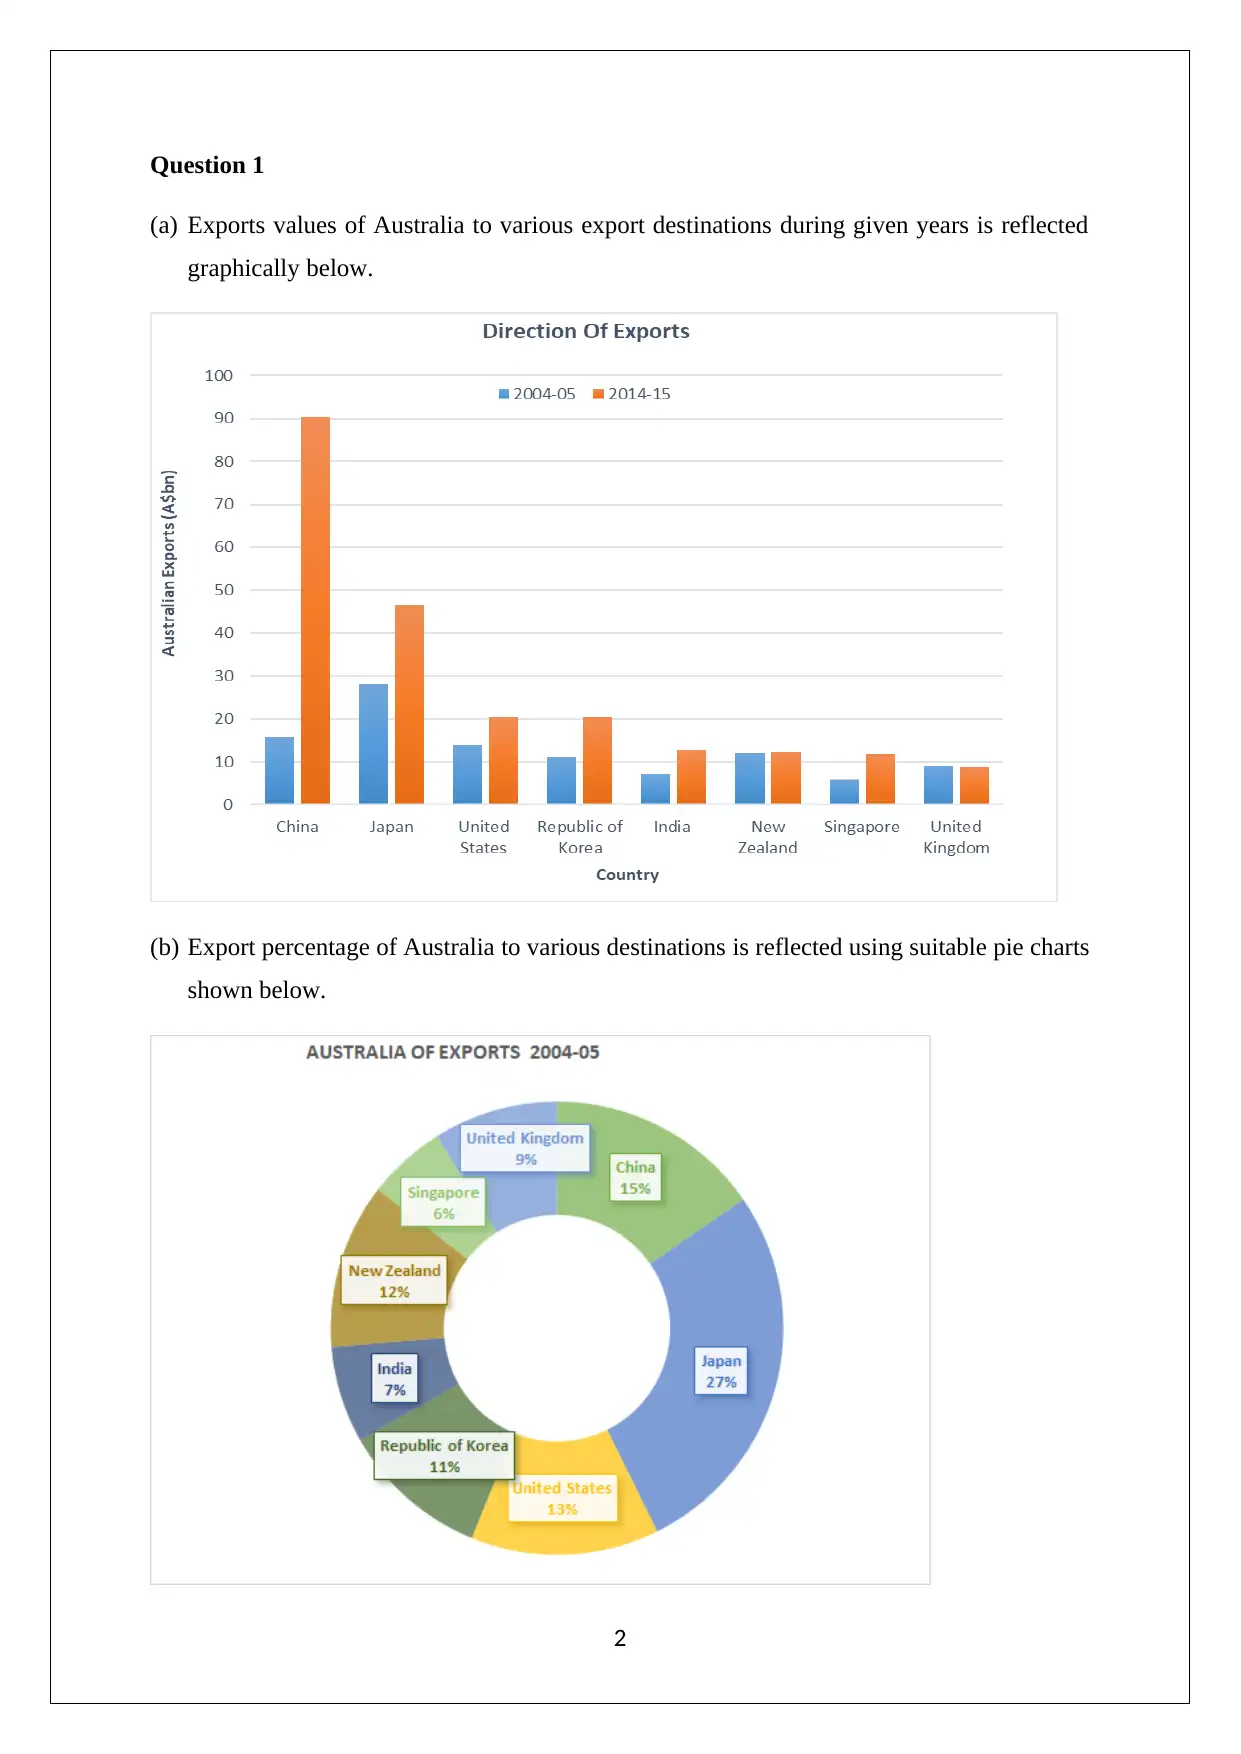
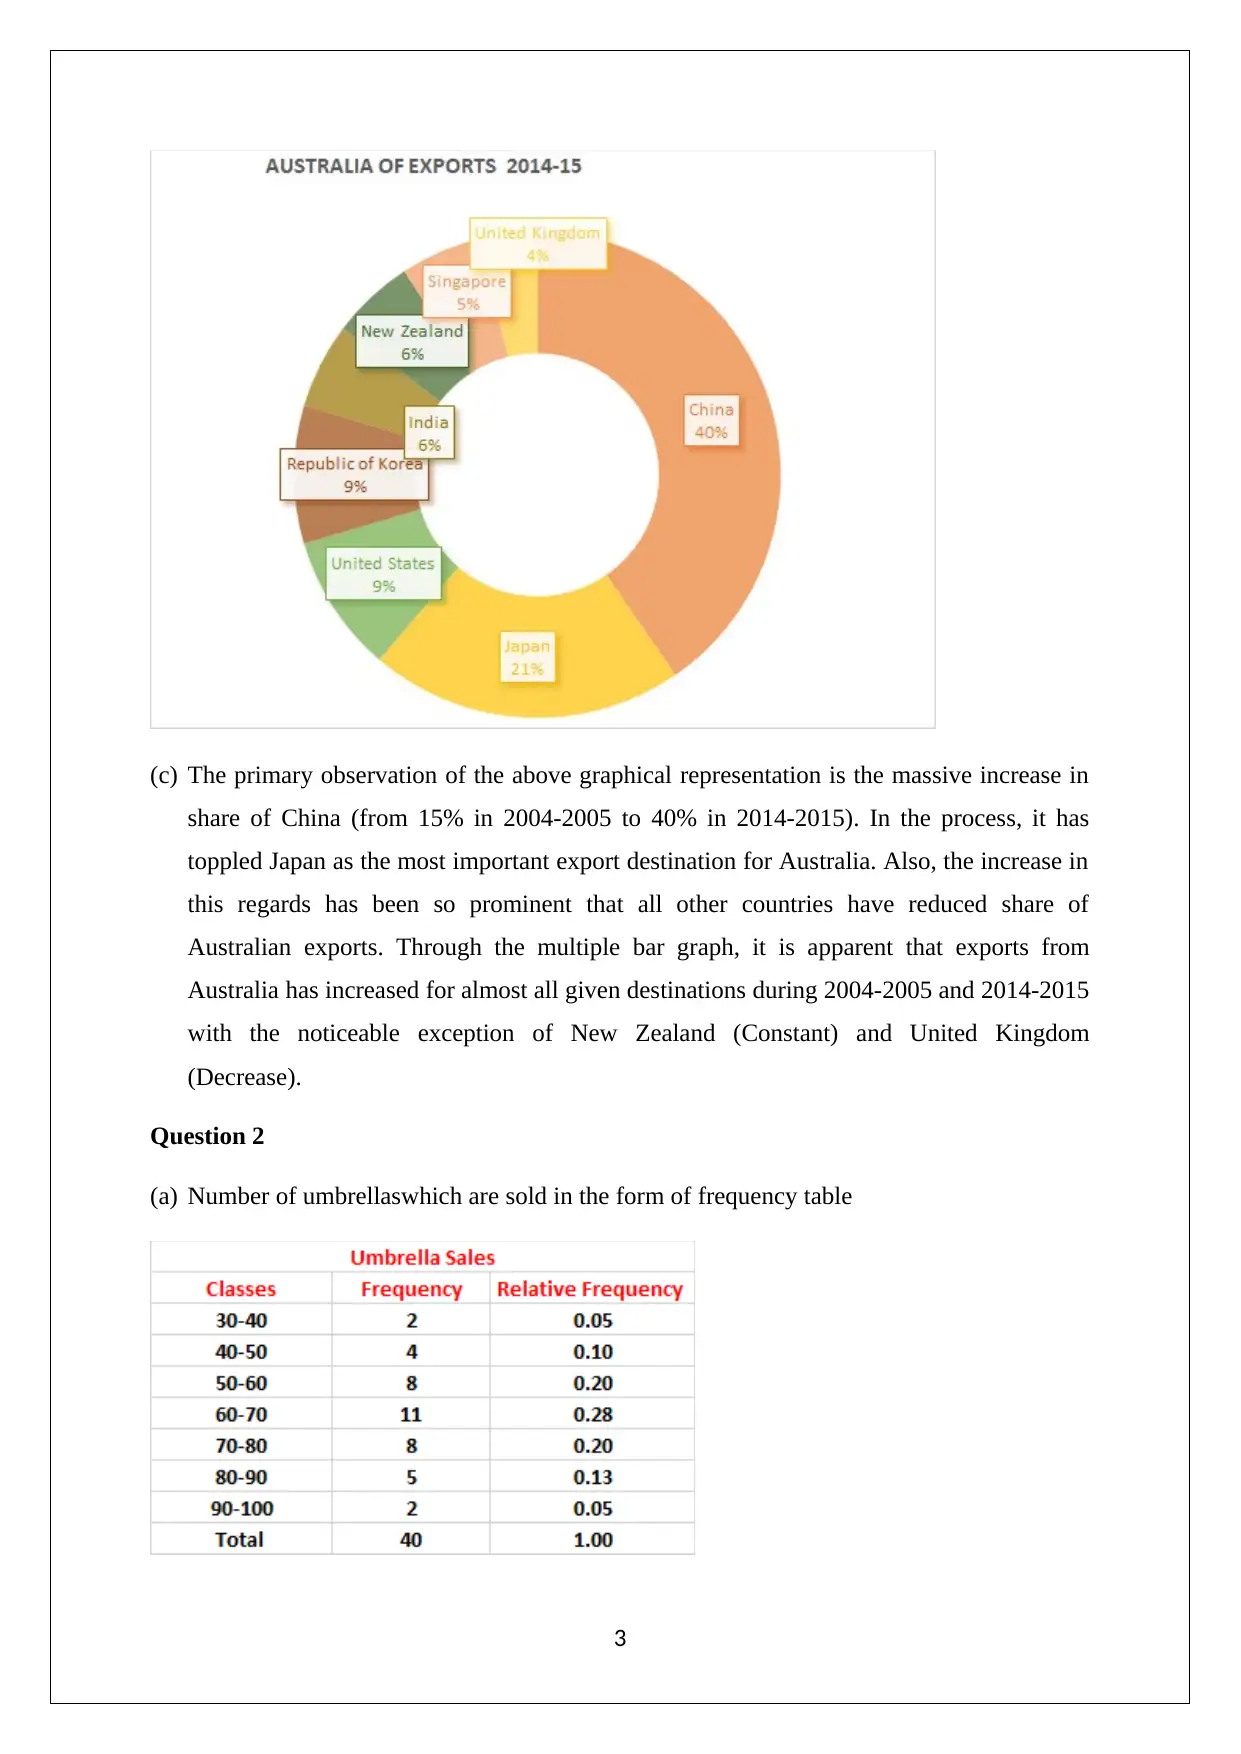
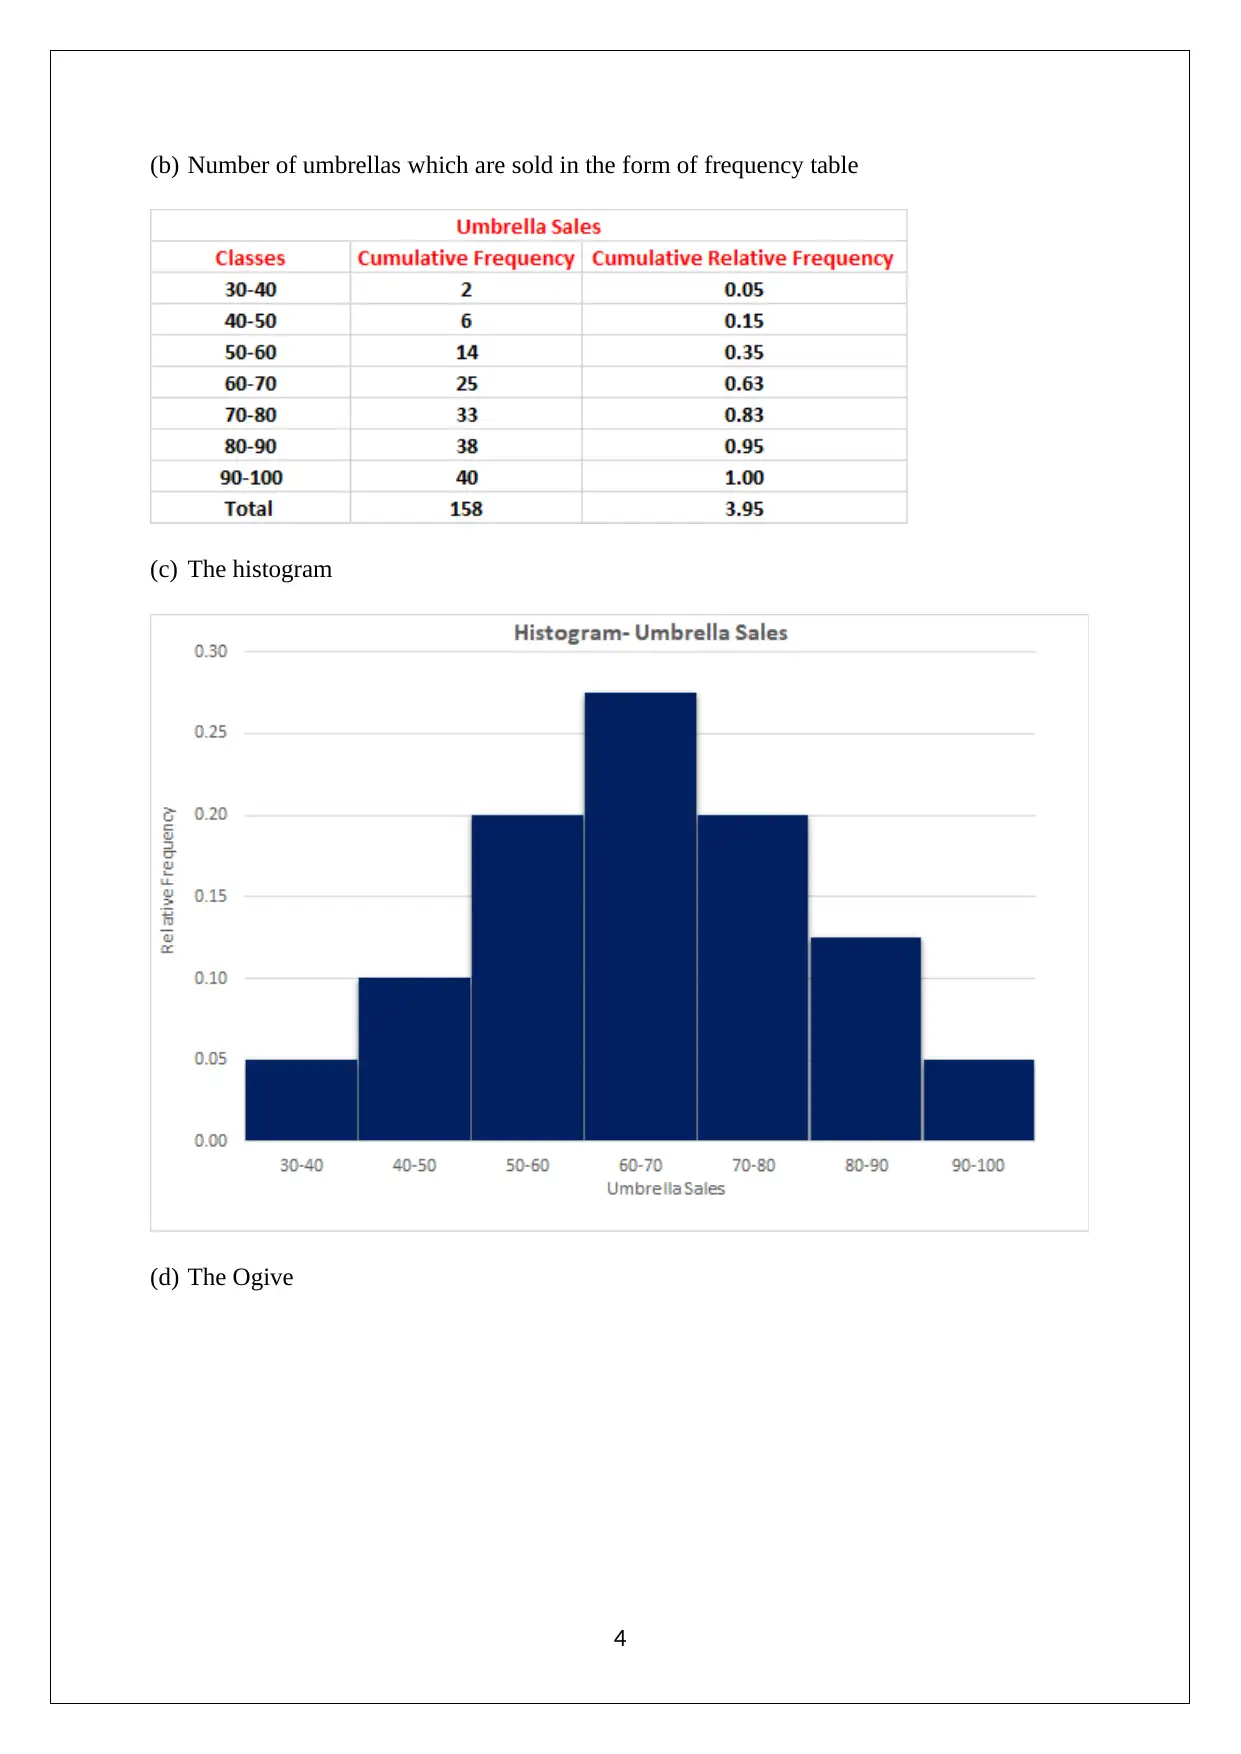
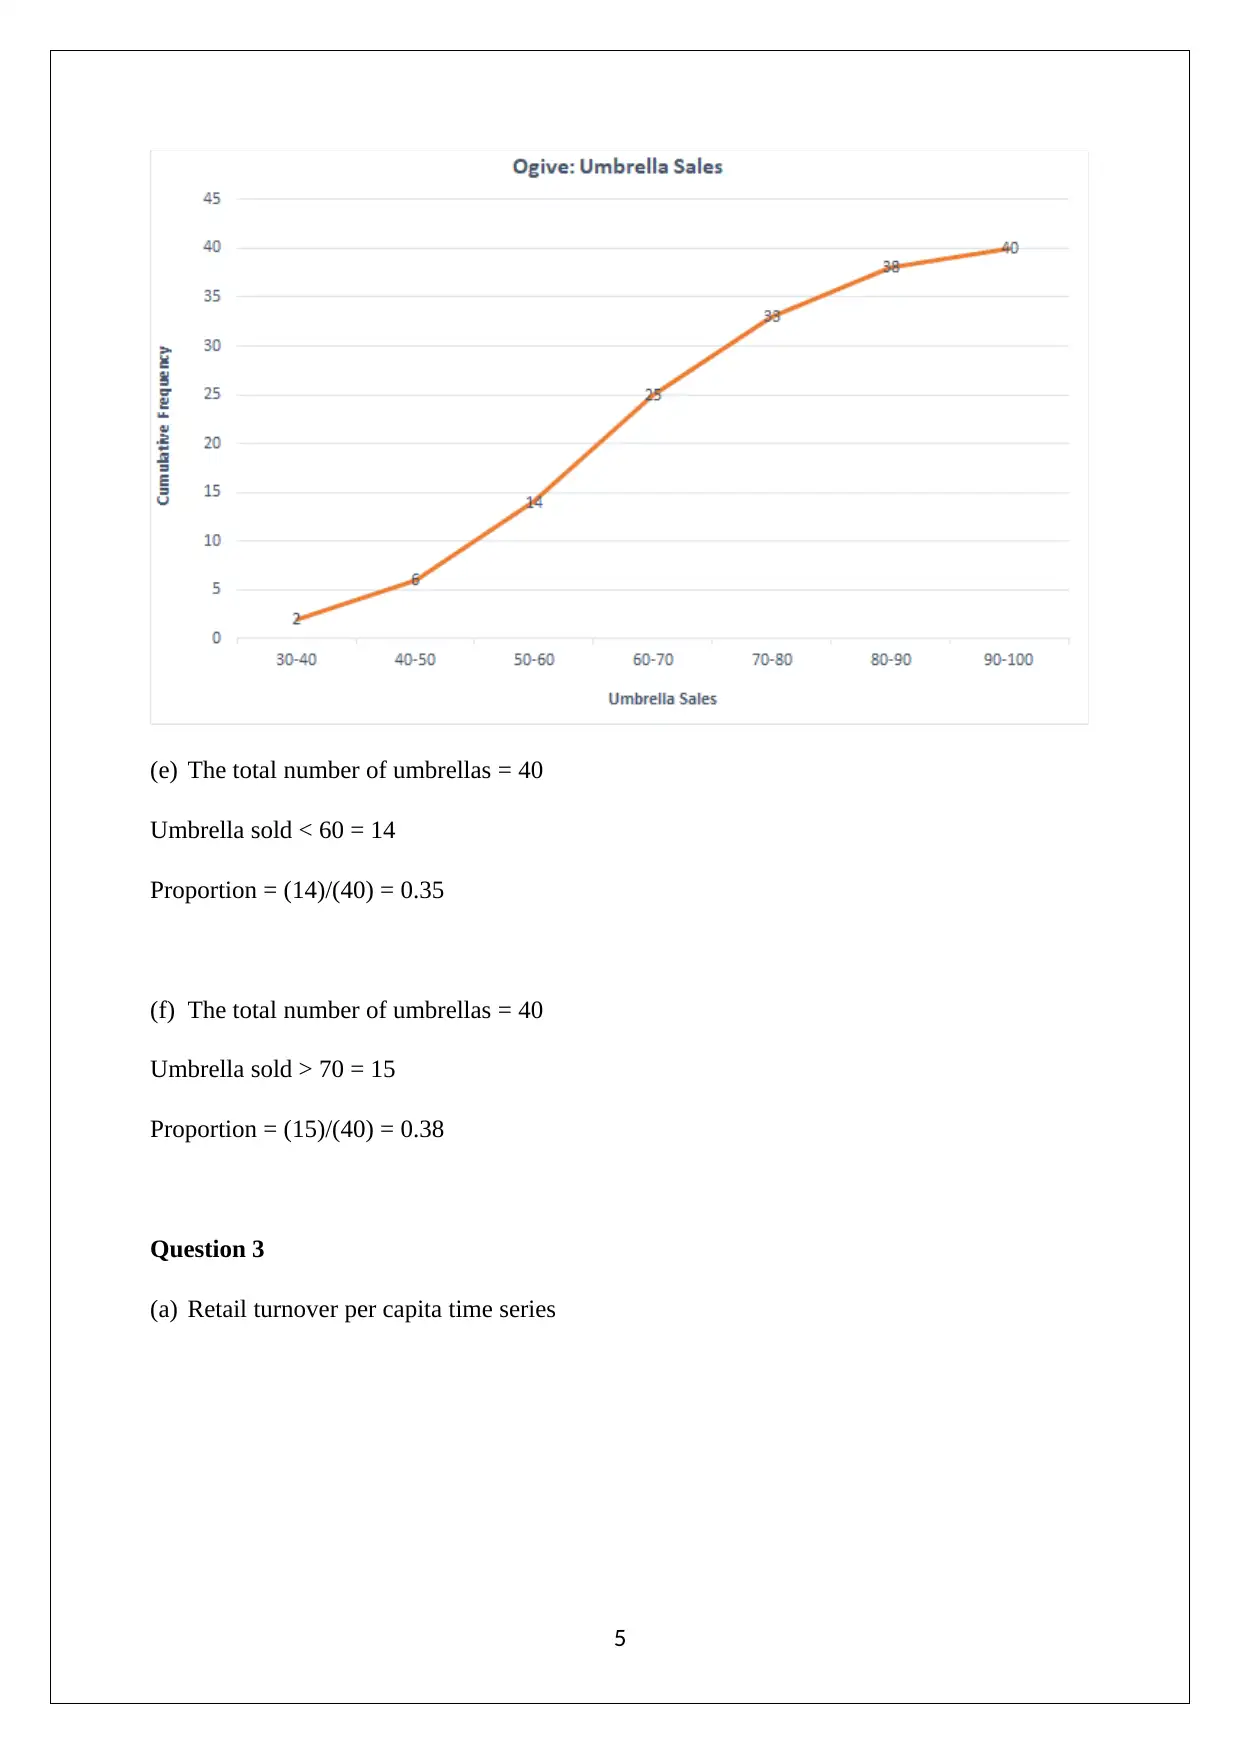
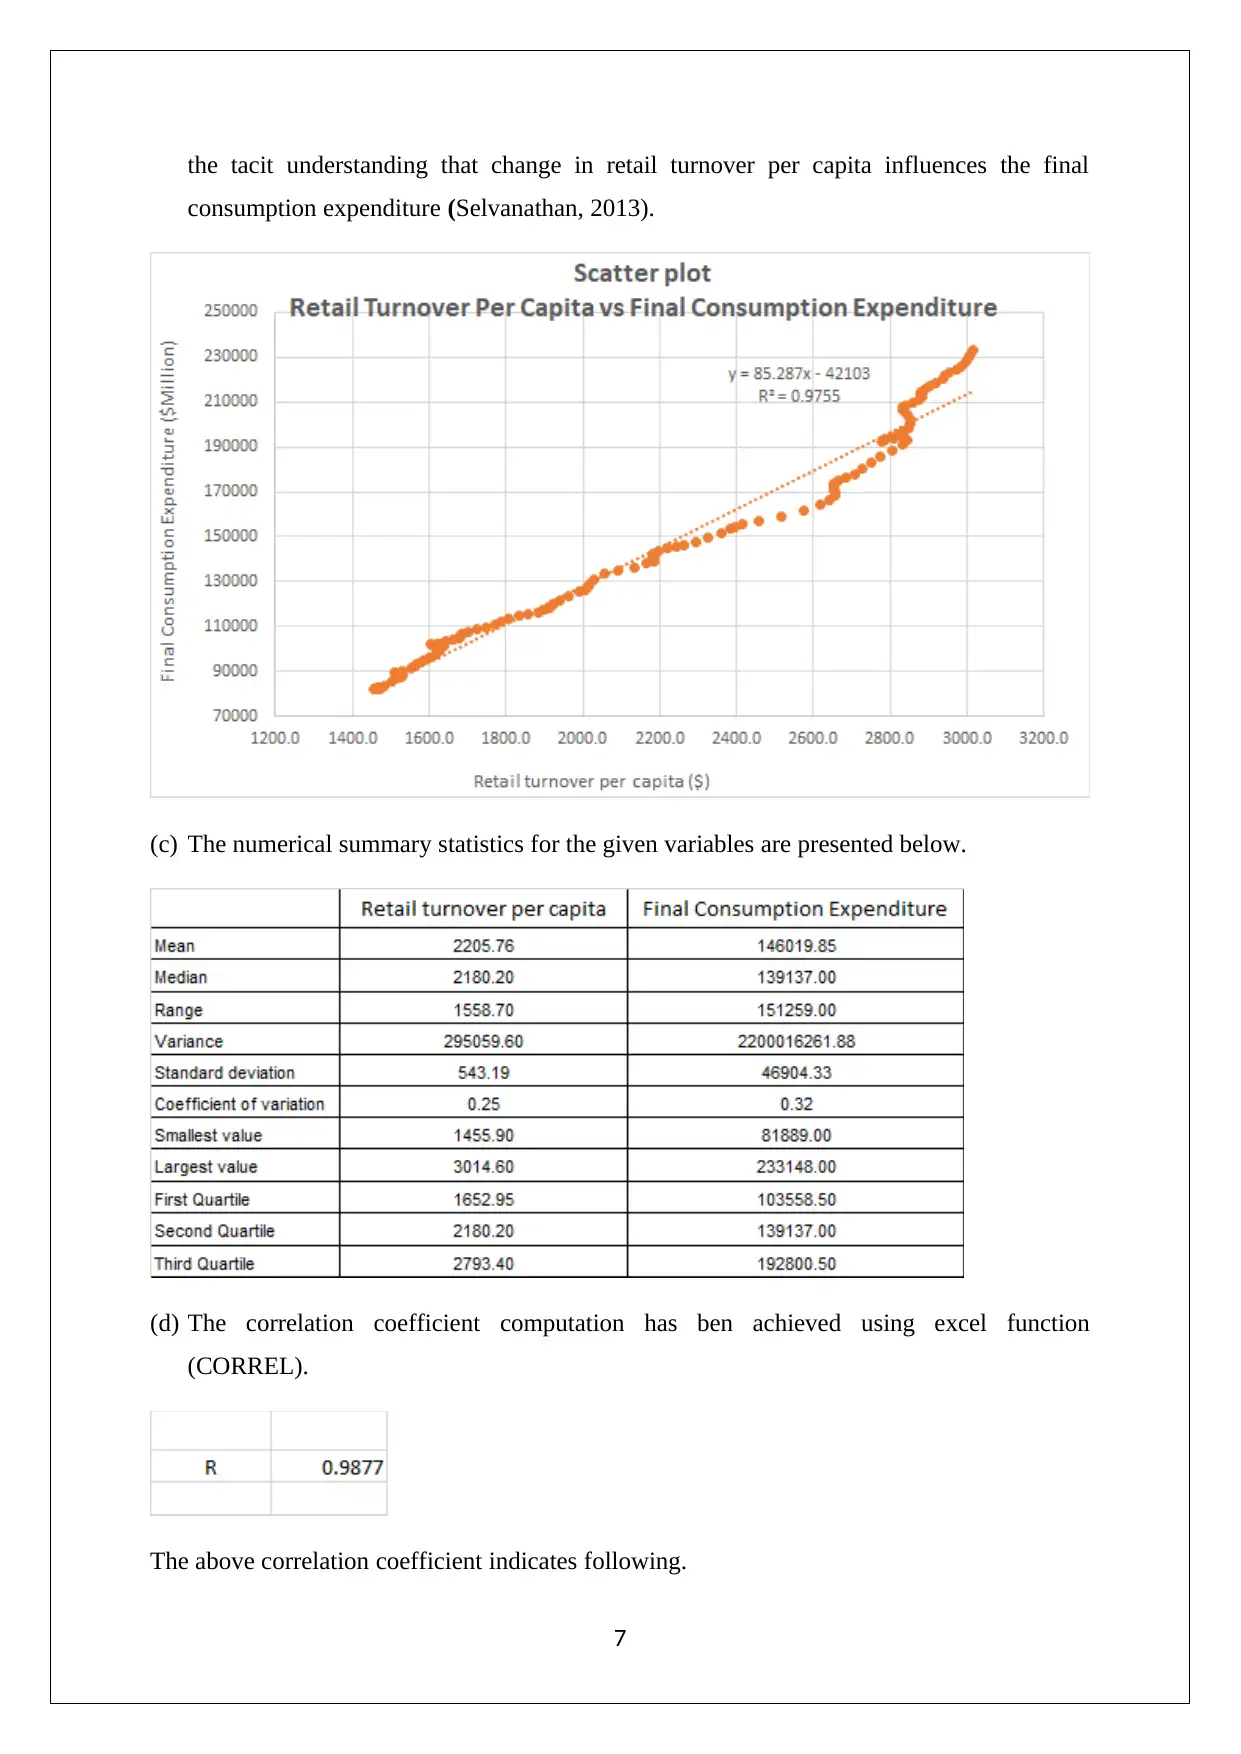
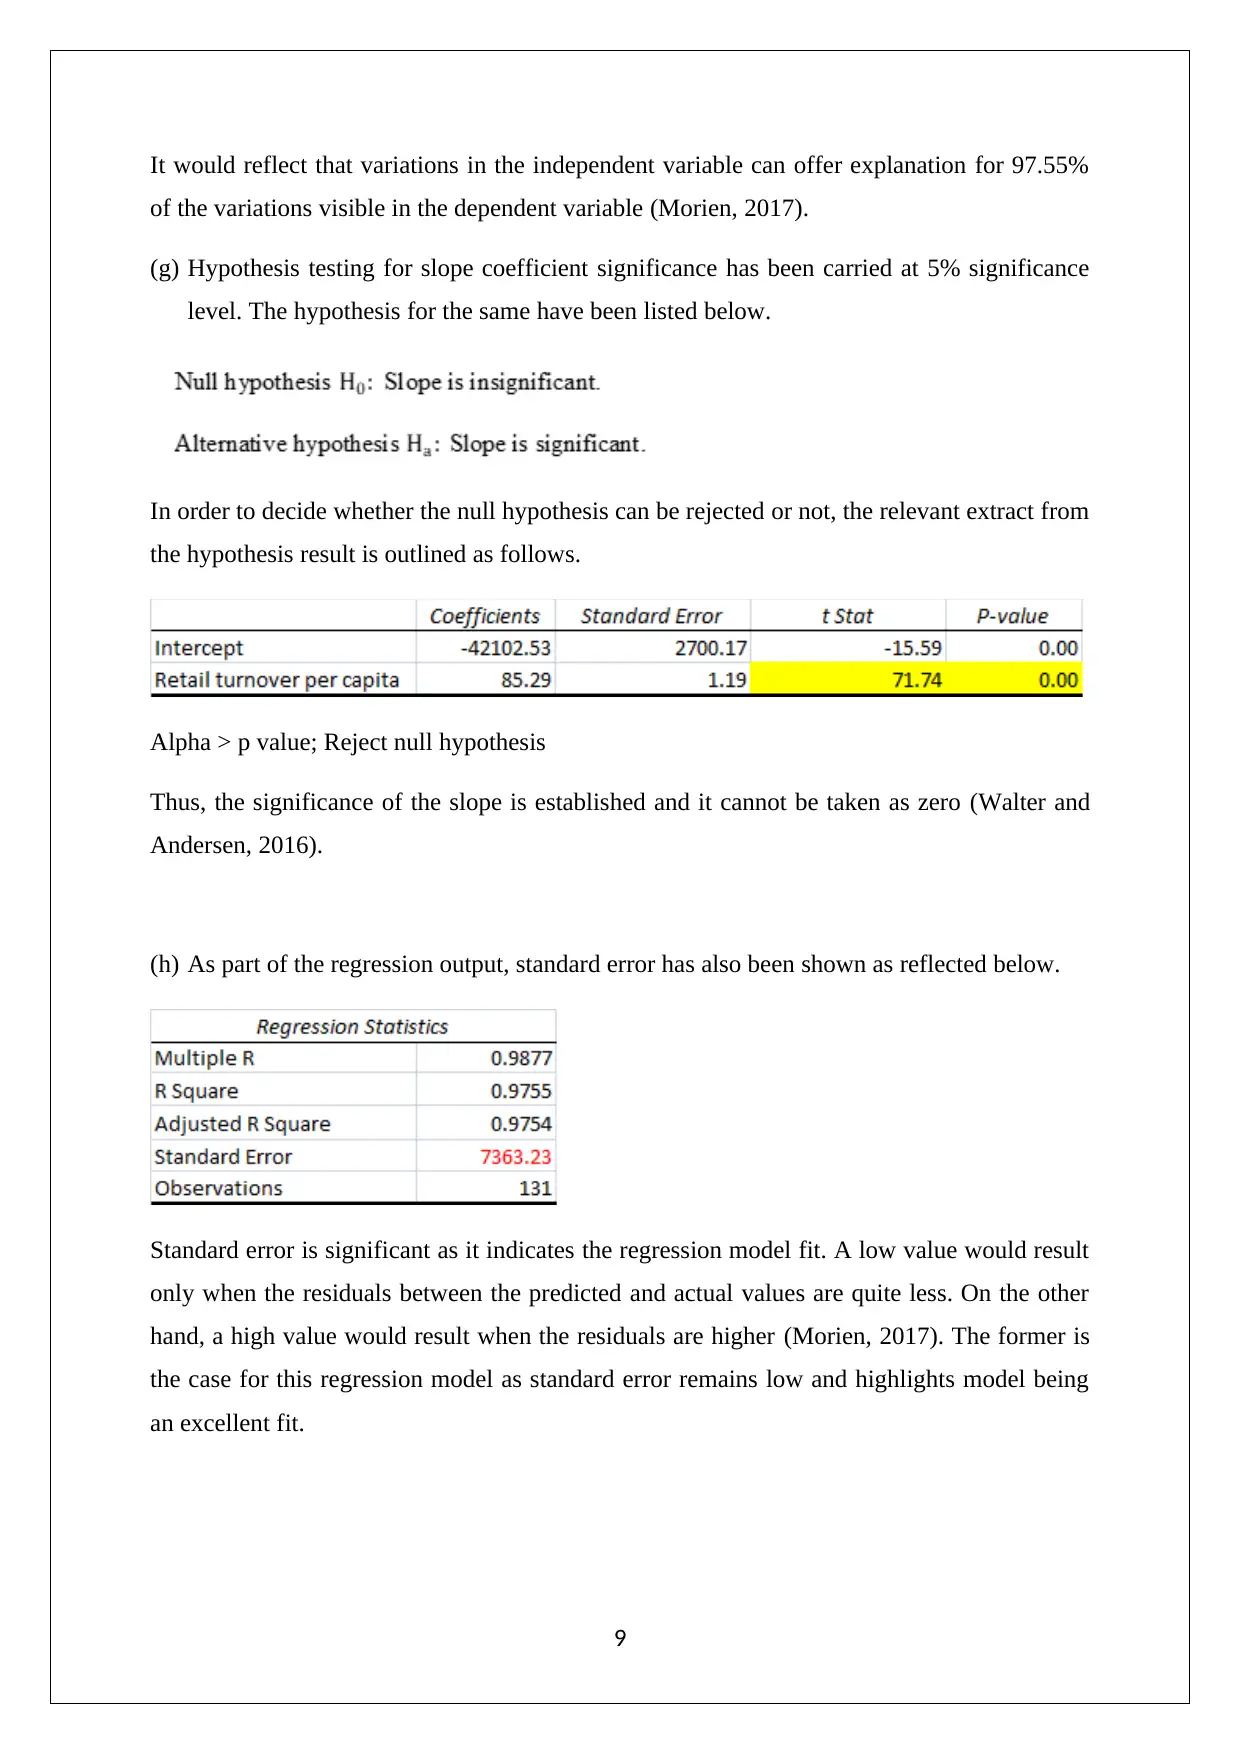
This document presents a comprehensive solution to a statistics assignment for the HI6007 course, focusing on statistical analysis and research methods in a business context. The assignment includes an analysis of Australian export data, utilizing pie charts and multiple bar graphs to illustrate export trends to various destinations, with a particular emphasis on the increasing share of China. It also incorporates a frequency table, histogram, and ogive to analyze umbrella sales data. Furthermore, the assignment delves into a regression analysis, exploring the relationship between retail turnover per capita and final consumption expenditure. The solution provides numerical summary statistics, correlation coefficients, regression output, and hypothesis testing to evaluate the significance of the slope coefficient, demonstrating the application of statistical techniques to real-world business scenarios. The document uses references from academic sources to support its findings.
Document Page
STATISTICS
STUDENT ID:
[Pick the date]
tabler-icon-diamond-filled.svg

Paraphrase This Document

Need a fresh take? Get an instant paraphrase of this document with our AI Paraphraser
Document Page
Question 1
(a) Exports values of Australia to various export destinations during given years is reflected
graphically below.
(b) Export percentage of Australia to various destinations is reflected using suitable pie charts
shown below.
2
Document Page
(c) The primary observation of the above graphical representation is the massive increase in
share of China (from 15% in 2004-2005 to 40% in 2014-2015). In the process, it has
toppled Japan as the most important export destination for Australia. Also, the increase in
this regards has been so prominent that all other countries have reduced share of
Australian exports. Through the multiple bar graph, it is apparent that exports from
Australia has increased for almost all given destinations during 2004-2005 and 2014-2015
with the noticeable exception of New Zealand (Constant) and United Kingdom
(Decrease).
Question 2
(a) Number of umbrellaswhich are sold in the form of frequency table
3
Document Page
(b) Number of umbrellas which are sold in the form of frequency table
(c) The histogram
(d) The Ogive
4
tabler-icon-diamond-filled.svg

Paraphrase This Document

Need a fresh take? Get an instant paraphrase of this document with our AI Paraphraser
Document Page
(e) The total number of umbrellas = 40
Umbrella sold < 60 = 14
Proportion = (14)/(40) = 0.35
(f) The total number of umbrellas = 40
Umbrella sold > 70 = 15
Proportion = (15)/(40) = 0.38
Question 3
(a) Retail turnover per capita time series
5
Document Page
Final consumption expenditure time series
(b) The respective scatter plot has been drawn using the charting option available in excel.
The retail turnover per capita is acting as the independent variable while the final
consumption expenditure is acting as the dependent variable. The relationship is based on
6
Document Page
the tacit understanding that change in retail turnover per capita influences the final
consumption expenditure (Selvanathan, 2013).
(c) The numerical summary statistics for the given variables are presented below.
(d) The correlation coefficient computation has ben achieved using excel function
(CORREL).
The above correlation coefficient indicates following.
7
tabler-icon-diamond-filled.svg

Paraphrase This Document

Need a fresh take? Get an instant paraphrase of this document with our AI Paraphraser
Document Page
A directly proportional relationship between retail turnover and final consumption
expenditure is expected whereby both variables move in the same direction.
This relationship is quite strong in terms of strength as the magnitude of r nears 1.
(e) The regression output
Regression Line
y=a+bx
a=42102.53, b=85.29
Value a highlight the intercept or the final consumption expenditure when zero is assumed by
retail turnover per capita. However, negative expenditure is not possible which implies that
intercept has limited practical usage (Walter and Andersen, 2016)
Value b highlights the slope as it is expected that an alteration by even $ 1 in the retail turn-
over per capita can lead to change in the final consumption expenditure by $85.29 million.
(f) The R2 value is 0.9755 as highlighted in the regression output.
8
Document Page
It would reflect that variations in the independent variable can offer explanation for 97.55%
of the variations visible in the dependent variable (Morien, 2017).
(g) Hypothesis testing for slope coefficient significance has been carried at 5% significance
level. The hypothesis for the same have been listed below.
In order to decide whether the null hypothesis can be rejected or not, the relevant extract from
the hypothesis result is outlined as follows.
Alpha > p value; Reject null hypothesis
Thus, the significance of the slope is established and it cannot be taken as zero (Walter and
Andersen, 2016).
(h) As part of the regression output, standard error has also been shown as reflected below.
Standard error is significant as it indicates the regression model fit. A low value would result
only when the residuals between the predicted and actual values are quite less. On the other
hand, a high value would result when the residuals are higher (Morien, 2017). The former is
the case for this regression model as standard error remains low and highlights model being
an excellent fit.
9
Document Page
References
Morien, D. (2017) Business Statistics. Melbourne: Cengage learning Australia.
Selvanathan, A. (2013) Australian Business Statistics. 3rd ed. Abridged: Thomson.
Walter, M and Andersen, C. (2016) Indigenous Statistics: A Quantitative Research
Methodology. Abingdon-on-Thames: Routledge.
10
chevron_up_icon
1 out of 10
circle_padding
hide_on_mobile
zoom_out_icon
[object Object]