T1 2019 HI6007 Statistics and Research Methods for Business
VerifiedAdded on 2022/10/19
|9
|519
|438
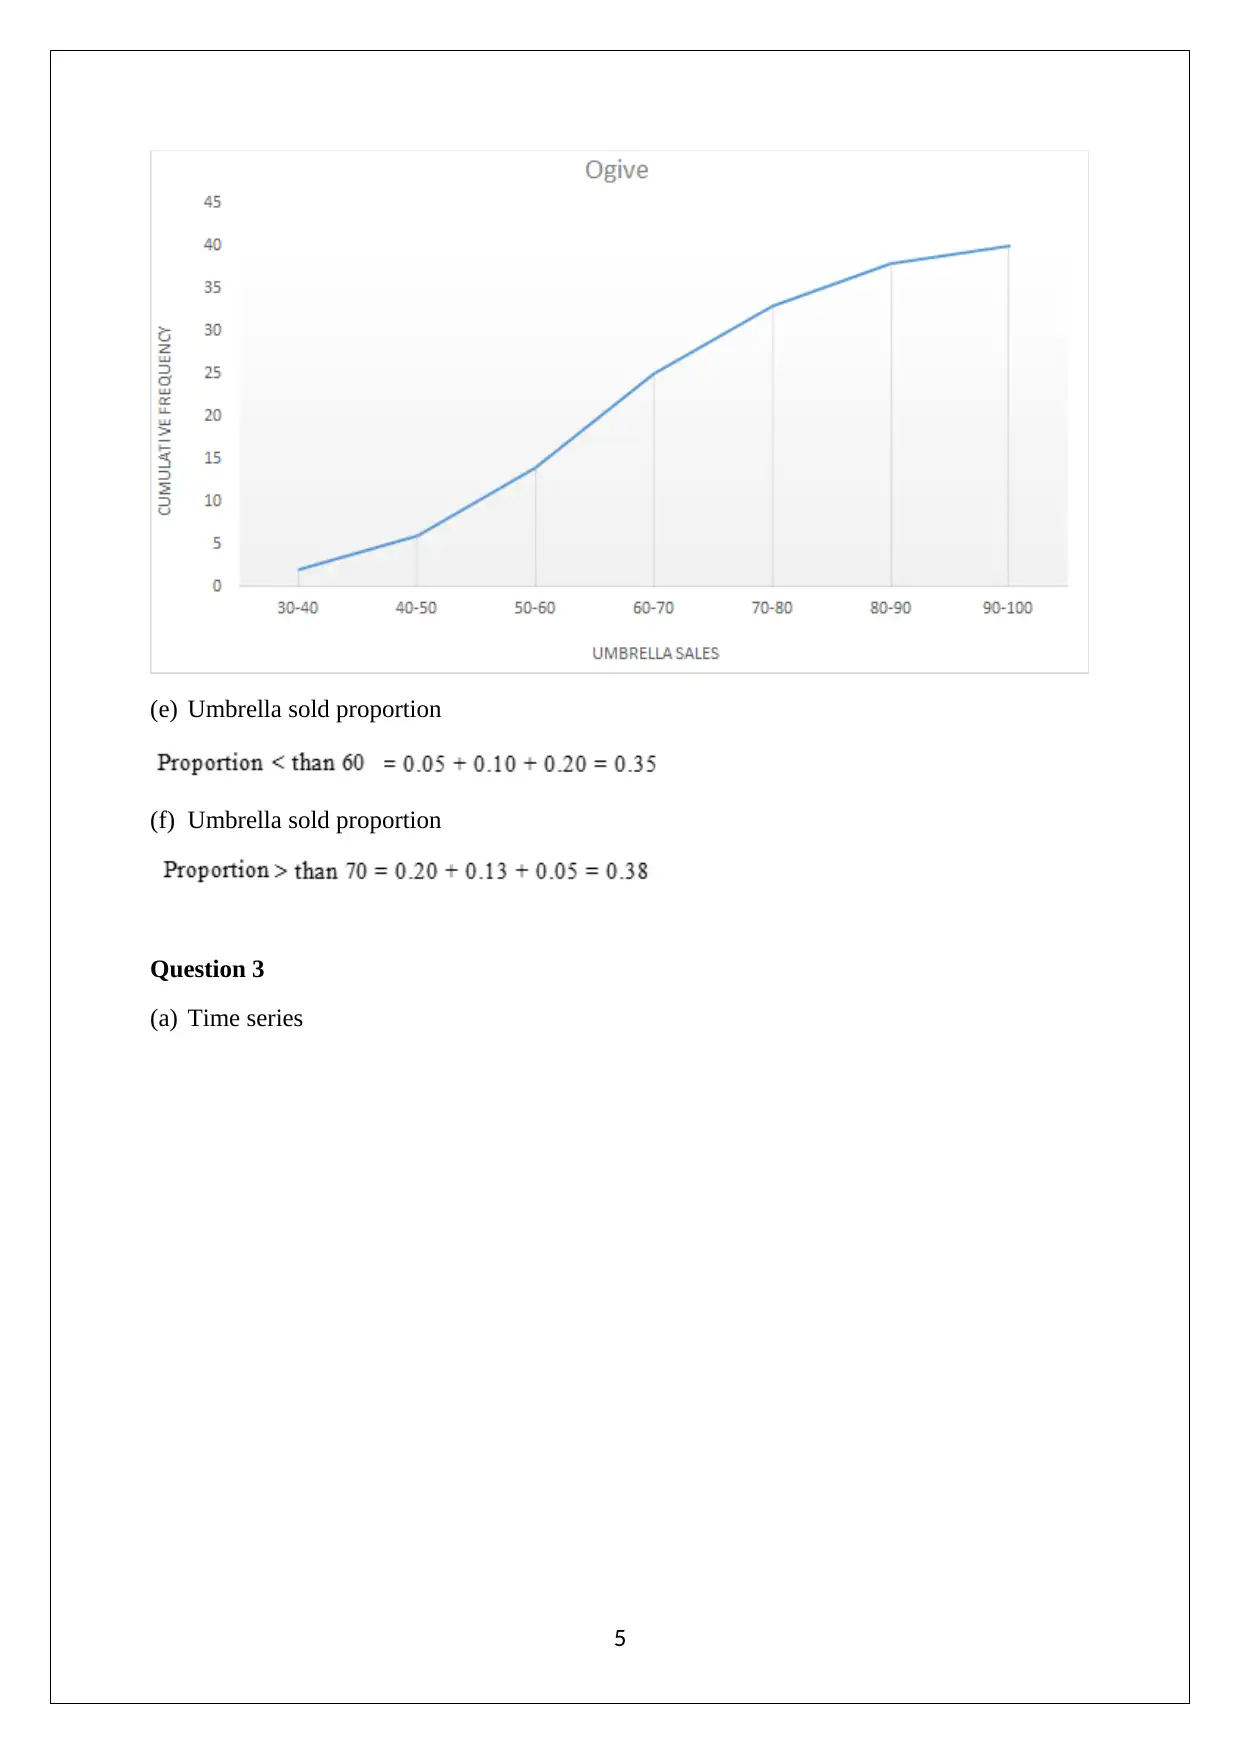
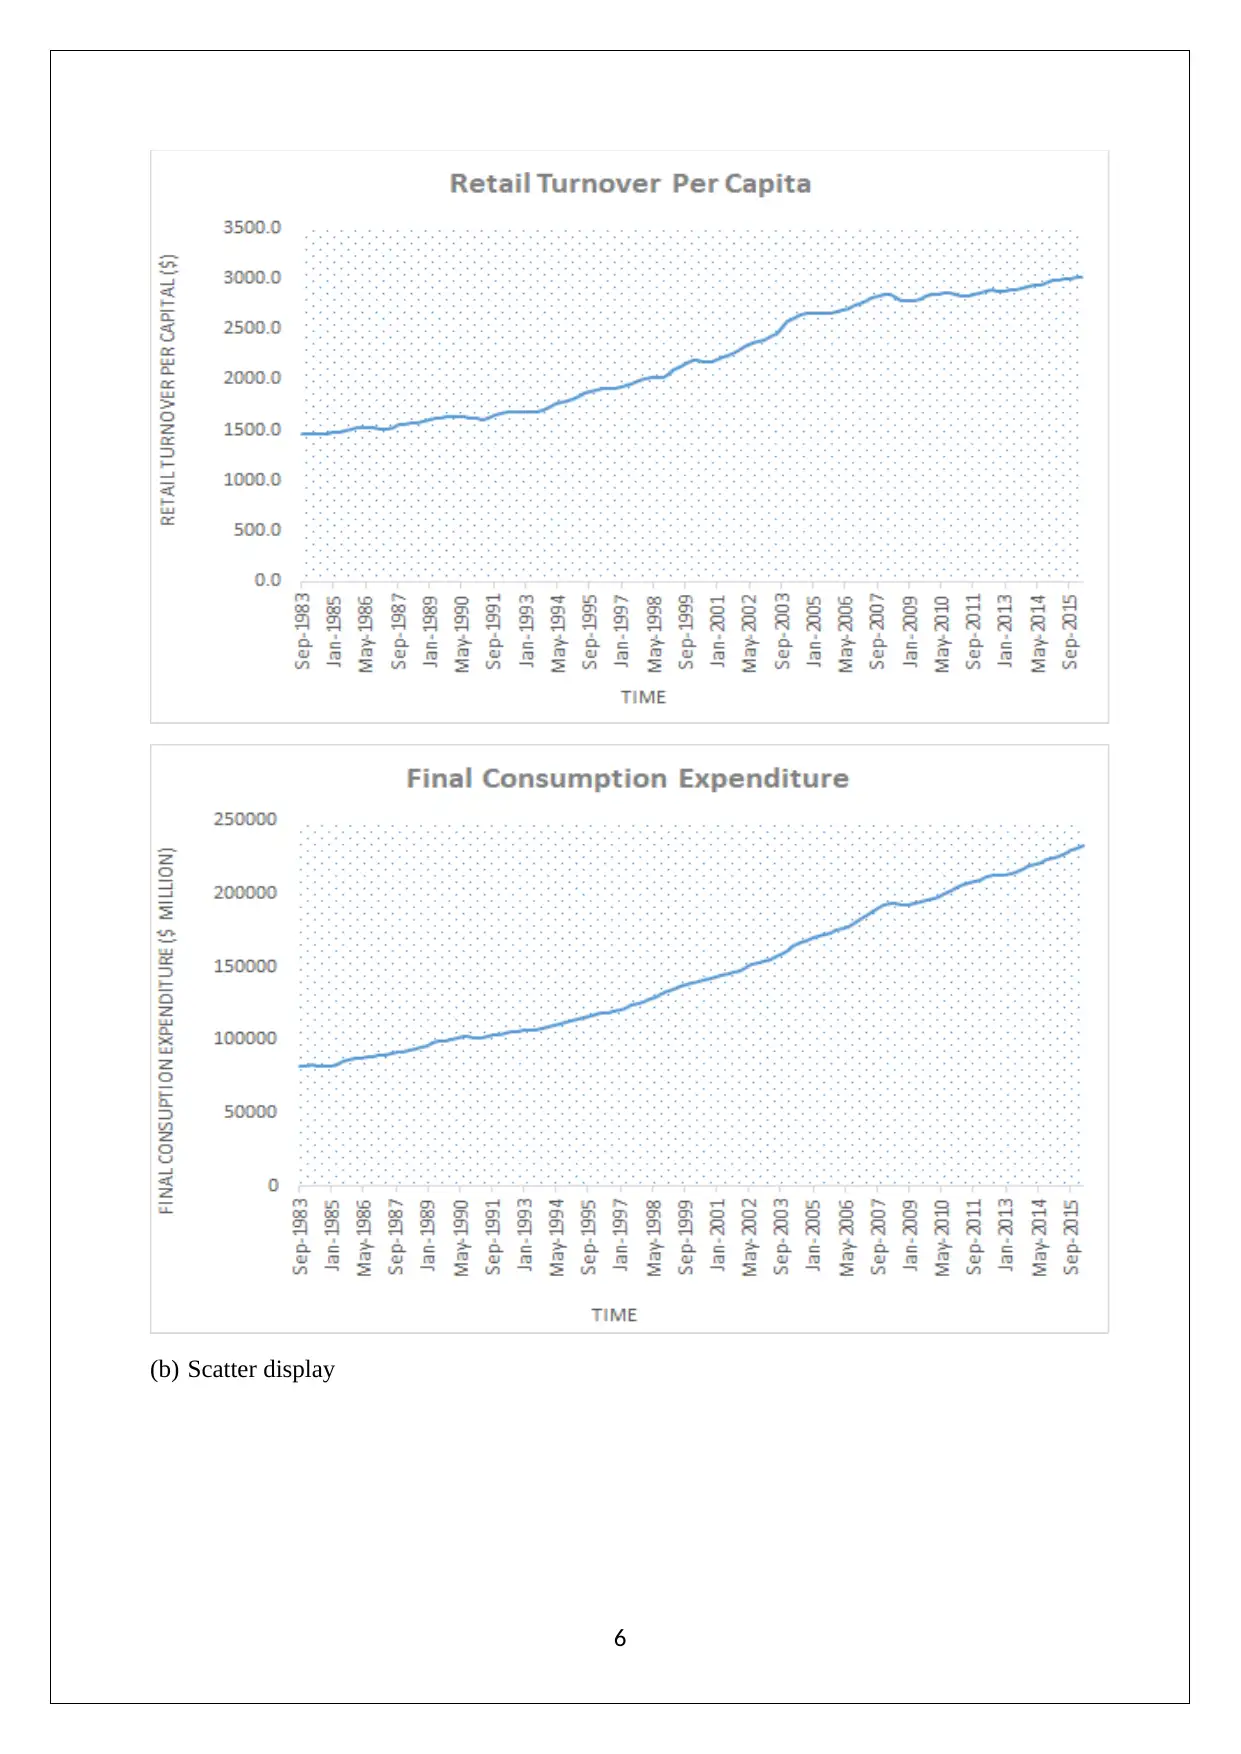
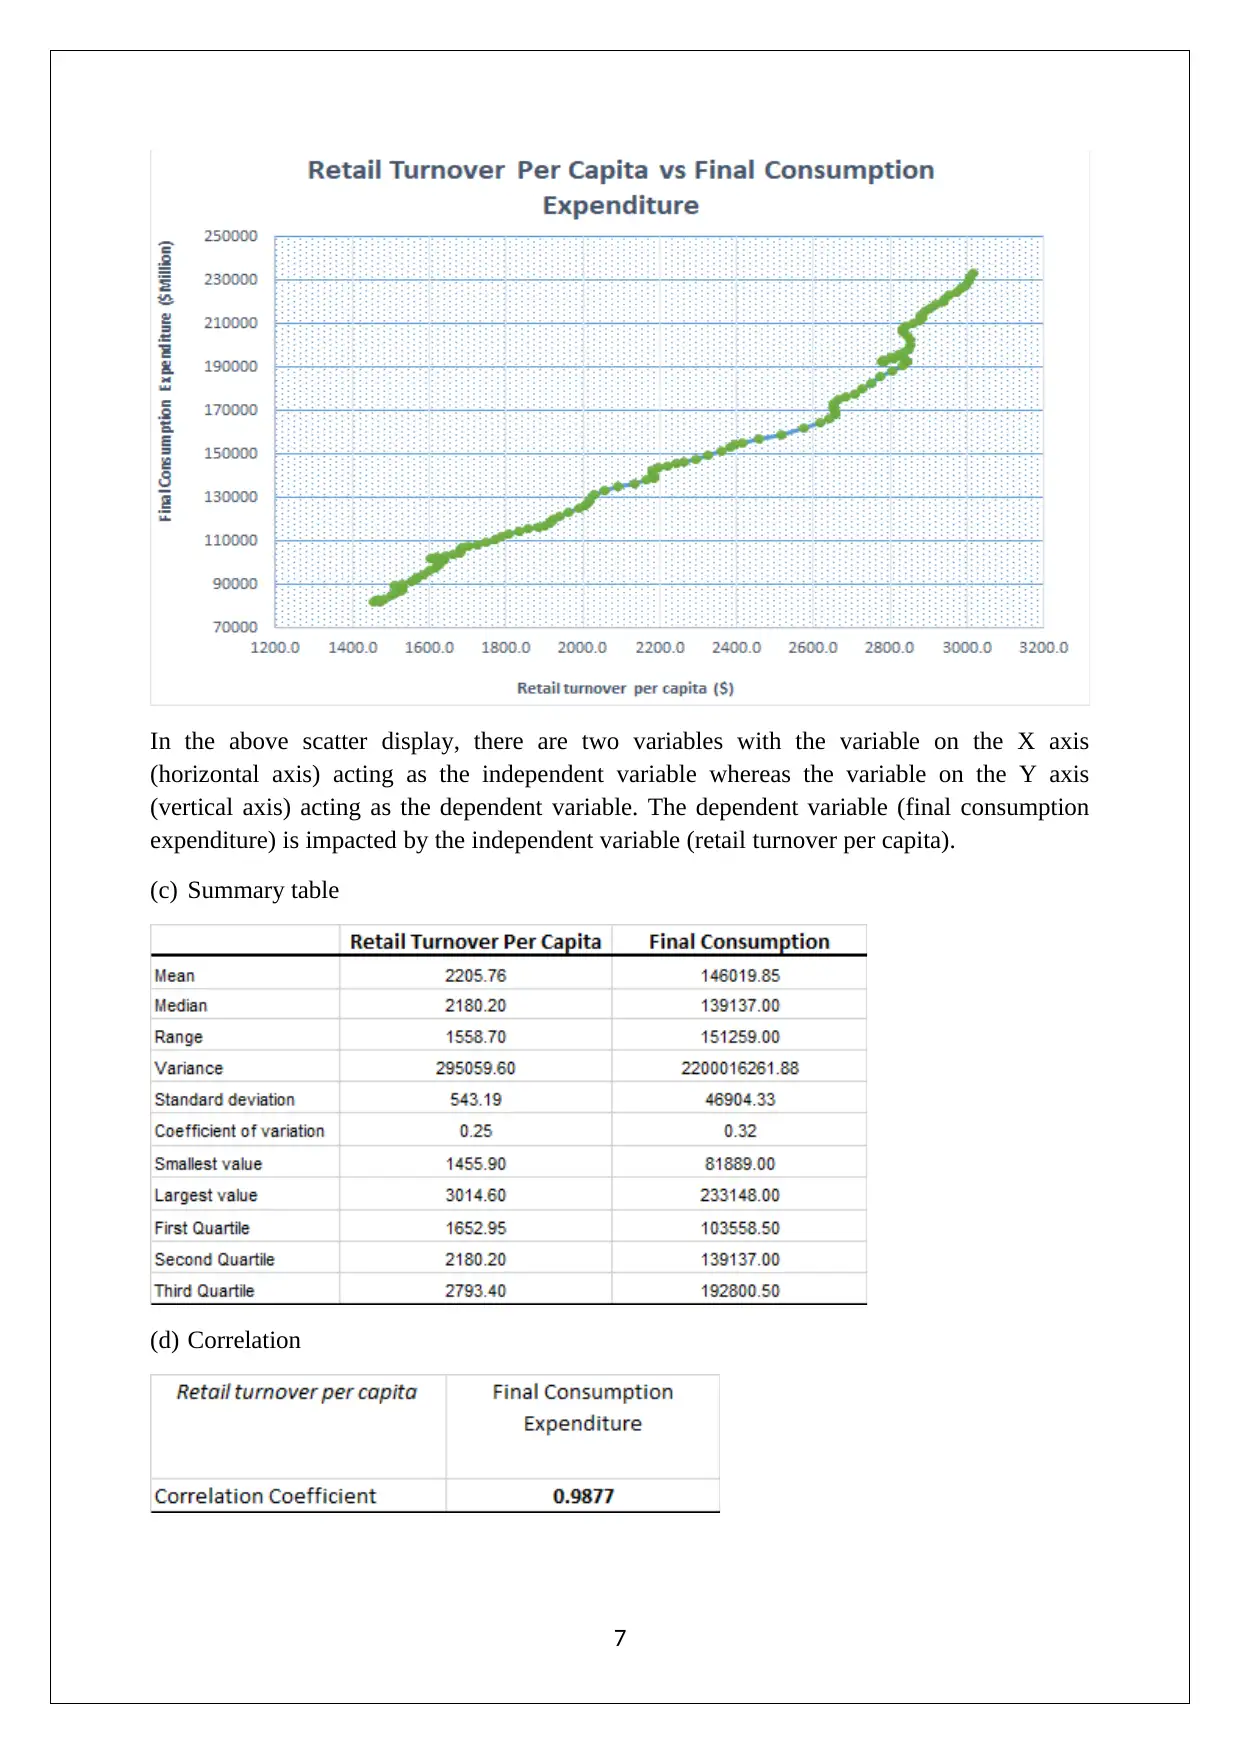
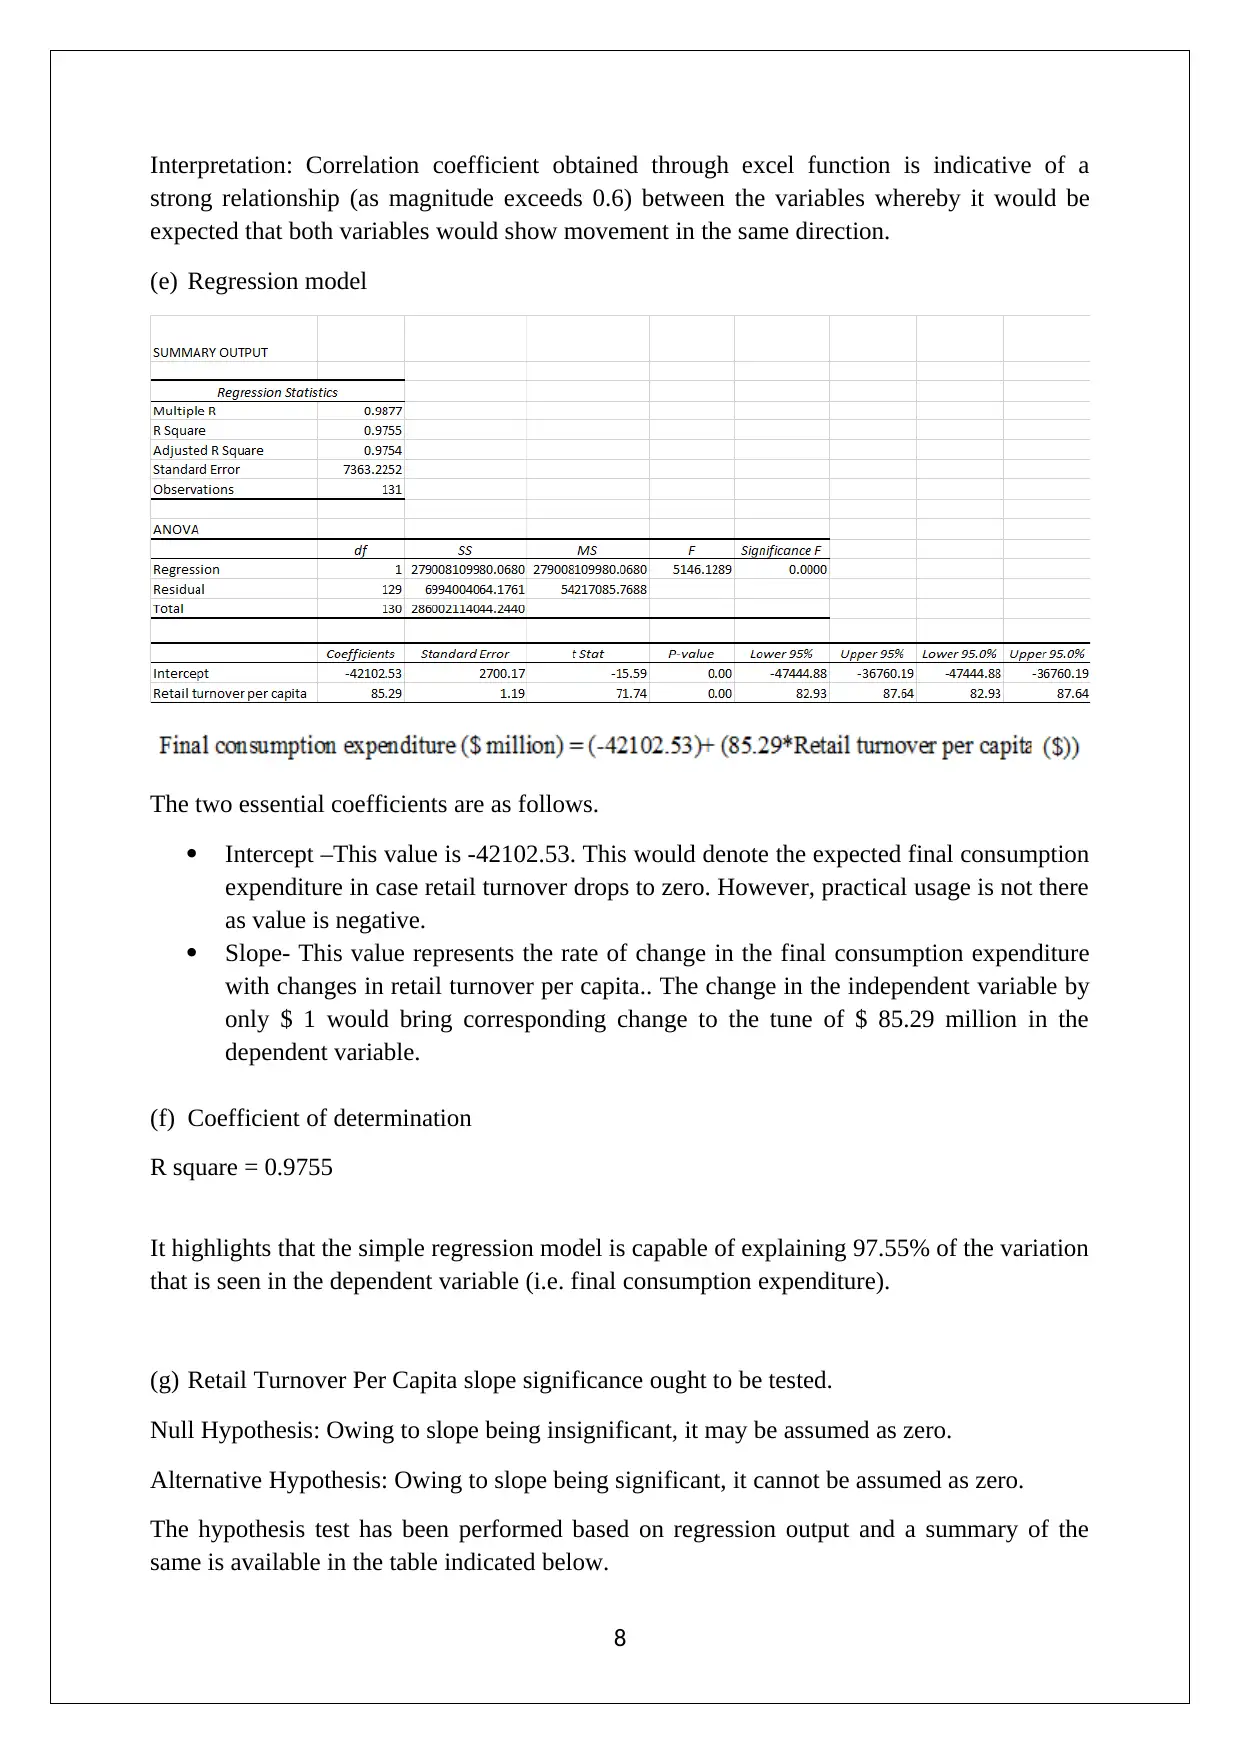
Homework Assignment
AI Summary
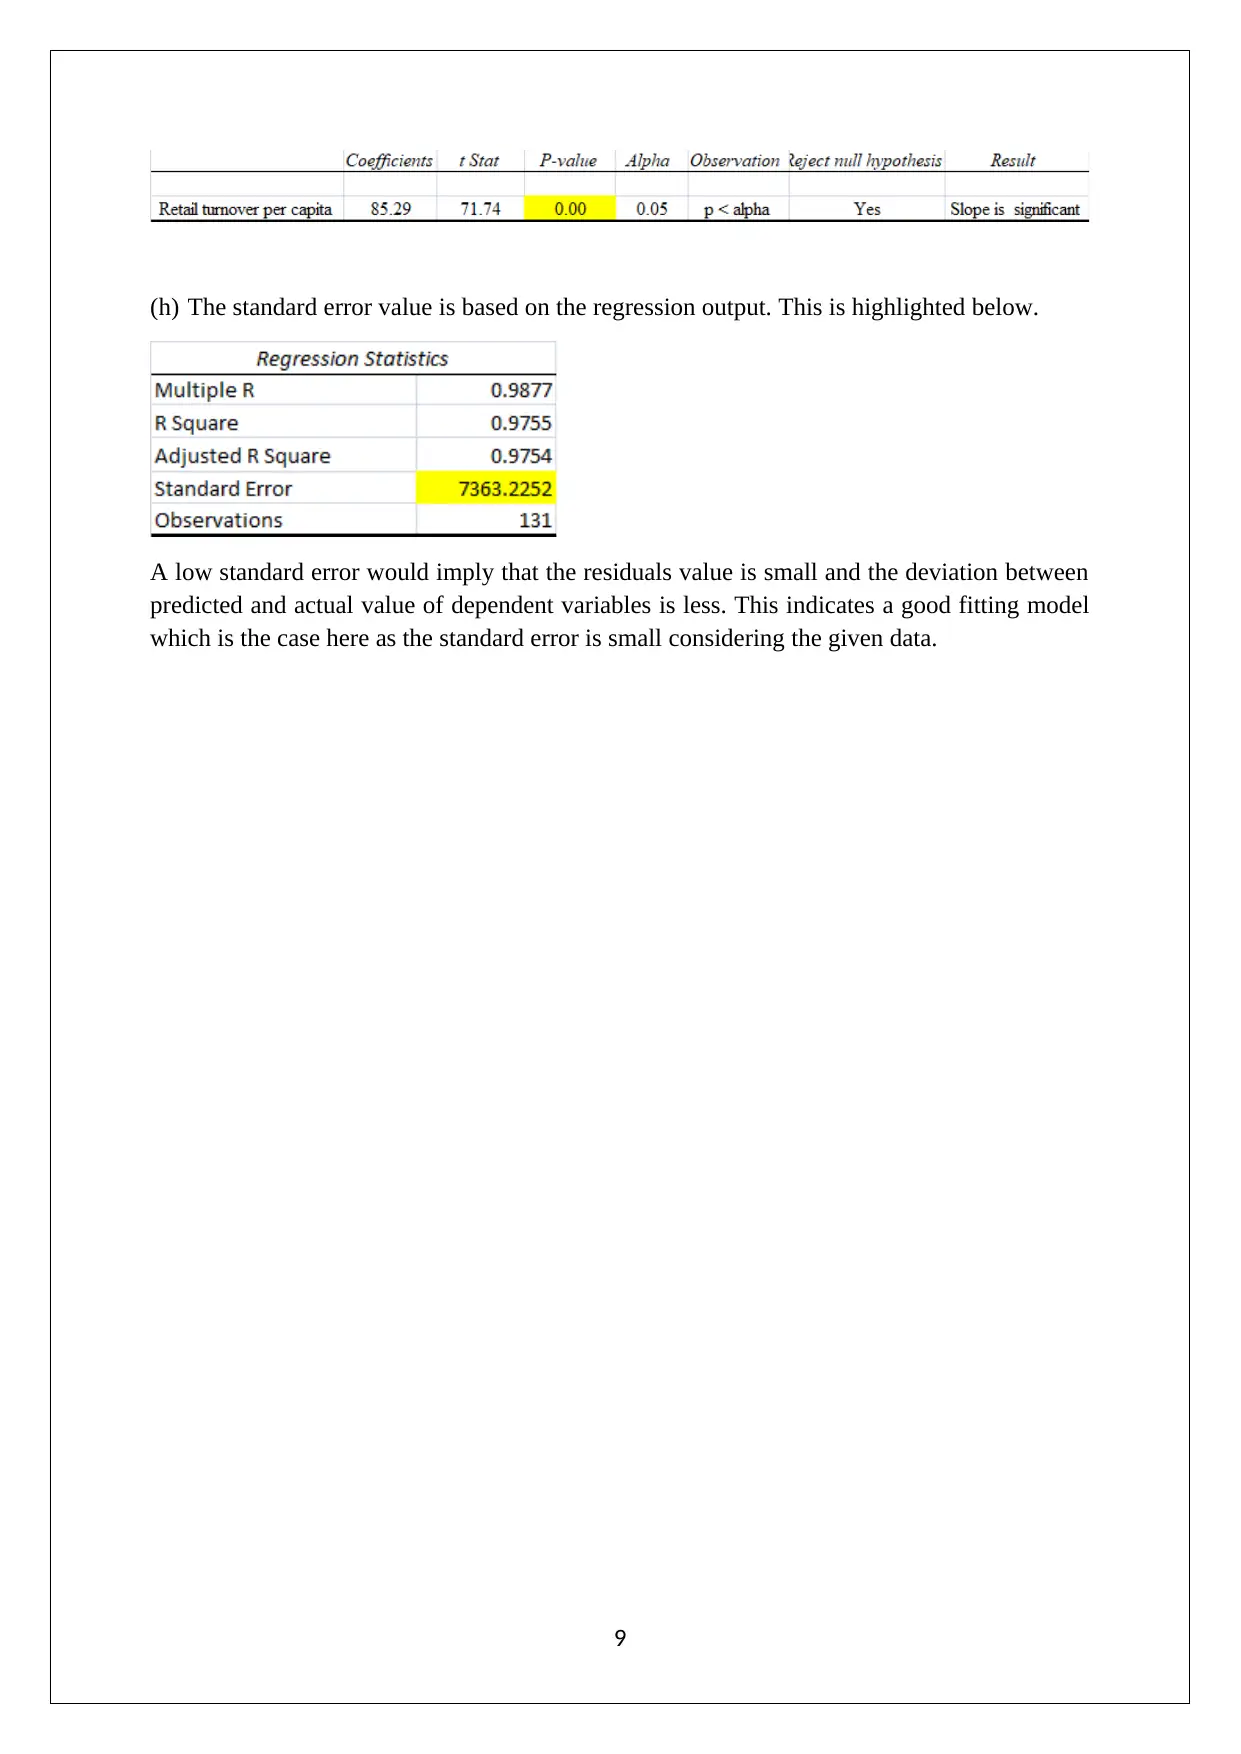
This assignment presents a comprehensive solution to a statistics and research methods assignment (HI6007) from Holmes Institute. The solution addresses multiple questions, including an analysis of Australian export values, focusing on destination trends and changes over a ten-year period, visualized using a column chart. It also involves the analysis of umbrella sales using relative and cumulative frequency distributions, histograms, and ogives. Furthermore, the assignment delves into time series analysis, examining the relationship between retail turnover and final consumption expenditure using scatter plots, correlation coefficients, and regression models. The regression analysis includes interpretation of coefficients, the coefficient of determination, and hypothesis testing for the slope's significance. The assignment demonstrates an understanding of statistical techniques and their application in business decision-making, providing detailed interpretations and analyses of the given data.
1 out of 9
Related Documents


Your All-in-One AI-Powered Toolkit for Academic Success.
+13062052269
info@desklib.com
Available 24*7 on WhatsApp / Email
![[object Object]](/_next/static/media/star-bottom.7253800d.svg)
Copyright © 2020–2026 A2Z Services. All Rights Reserved. Developed and managed by ZUCOL.