Holmes Institute HI6007 Statistics and Research Methods Report

Verified

Added on  2023/03/30

|10
|765
|308
Report
AI Summary
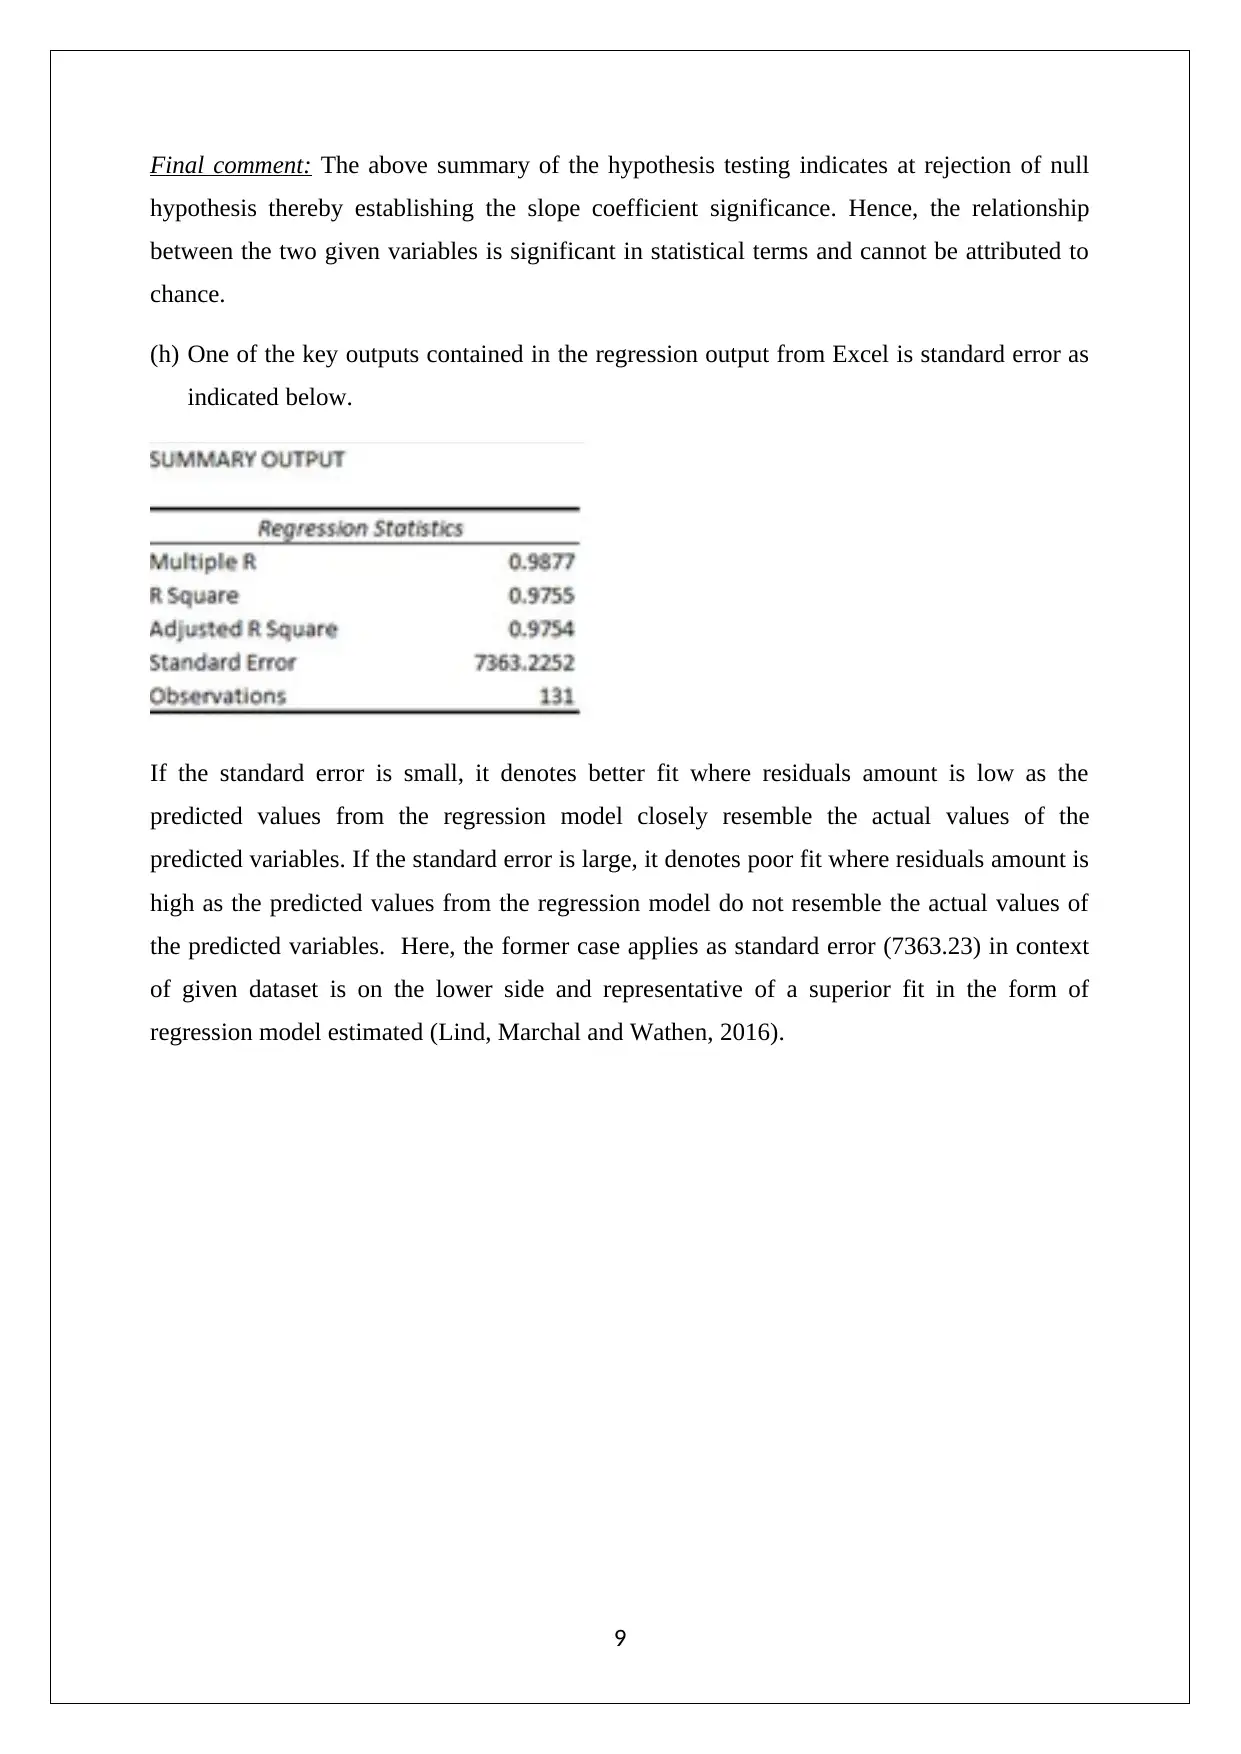
This report presents a comprehensive analysis of statistical concepts and techniques applied to business scenarios. The assignment covers a range of topics, including graphical representations of Australian export destinations, frequency distributions of umbrella sales, and time series plots of retail turnover and final consumption expenditure. The analysis includes the calculation and interpretation of correlation coefficients, regression analysis with hypothesis testing, and the assessment of model fit using the coefficient of determination and standard error. The report also provides a detailed examination of the relationship between retail turnover and final consumption expenditure, with interpretations of slope, intercept, and the significance of the relationship. Data from the provided assignment brief, including the Australian export data and retail turnover data, is used to illustrate the application of these statistical methods. The report concludes with an evaluation of the regression model's fit and the significance of the variables.
tabler-icon-diamond-filled.svg

Contribute Materials

Your contribution can guide someone’s learning journey. Share your documents today.
Document Page
STATISTICS
STUDENT ID:
[Pick the date]
tabler-icon-diamond-filled.svg

Secure Best Marks with AI Grader

Need help grading? Try our AI Grader for instant feedback on your assignments.
Document Page
Question 1
(a) The graphical representation with regards to top eight Australian export destination by
value is captured below.
(b) Graphical representation of percentage of top eight Australian export destinations.
2
Document Page
(c) The three observations from the comparison of the charts shown in part (a) and part (b)
are summarised below.
The growing importance of China as a destination for Australian exports is visible
from both graphs. During the ten year period, it has not only taken the position earlier
occupied by Japan but improved on the overall share from 15% to 40%.
Owing to huge jump in Australian exports towards China, the percentage share of all
other nations has declined as the same has been occupied by China.
In absolute terms the exports from Australia during the given ten year period has
declined only for one country i.e. UK.
Question 2
(a) Umbrella selling frequency distribution
3
Document Page
(b) Umbrella selling frequency distribution
(c) Histogram of umbrella selling frequency
(d) Ogive of umbrella selling cumulative frequency
4
tabler-icon-diamond-filled.svg

Secure Best Marks with AI Grader

Need help grading? Try our AI Grader for instant feedback on your assignments.
Document Page
(e) Proportion of umbrella sell (Less than 60)
(f) Proportion of umbrella sell (more than 70)
Question 3
(a) Retail turnover per capita and final consumption expenditure time series plot
5
Document Page
(b) The scatter plot with independent variables being retail turnover and dependent variable
being final consumption expenditure has been drawn below. The choice of the variables
clearly highlight that as the retail turnover would alter, corresponding changes in final
consumption expenditure would be expected.
(c) The required numerical summary for the given variables is shown below.
6
Document Page
(d) The coefficient of correlation has been determined based on the following function.
Excel function - CORREL ()
The above value needs to be interpreted in the context of following two aspects (Berenson et.
al., 2015).
Sign – A positive sign hints at directly proportional relationship while a negative sign
hints at inversely proportional relationship. In this case, the relationship would be
directly proportional between the two variables.
Magnitude – Correlation coefficient assumes a value between 0 and 1 which the
former being the lowest and latter being the largest possible value. The strength of the
linear association between variables tends to enhance as the correlation coefficient
comes nearer to 1.Cosidering this, the relation between the given variables is bound to
be exceptionally strong.
(e) Regression output (Excel Based)
7
tabler-icon-diamond-filled.svg

Paraphrase This Document

Need a fresh take? Get an instant paraphrase of this document with our AI Paraphraser
Document Page
Slope is 85.29 which indicates that the likely change visible in the final consumption
expenditure if per capita retail turnover would alter by even one dollar would be 85.29
million dollars. The change for both the variables would assume the same direction and hence
either both will decrease or both will increase (Morien, 2017).
Intercept is -42012.53 which indicates the value assumed by final consumption expenditure
when a zero value is assumed for the retail turnover per capita.
(f) Coefficient of determination (R2) = 0.9755 (from regression output of Excel). This
highlights that the current regression model is an excellent fit as 97.55% of the variation
in the dependent variable is accounted for by the model (independent variable) (Medhi,
2016).
(g) Hypothesis Testing
Slope: “Retail turnover per capita is significant or not.”
Null and alternative Hypotheses
8
Document Page
Final comment: The above summary of the hypothesis testing indicates at rejection of null
hypothesis thereby establishing the slope coefficient significance. Hence, the relationship
between the two given variables is significant in statistical terms and cannot be attributed to
chance.
(h) One of the key outputs contained in the regression output from Excel is standard error as
indicated below.
If the standard error is small, it denotes better fit where residuals amount is low as the
predicted values from the regression model closely resemble the actual values of the
predicted variables. If the standard error is large, it denotes poor fit where residuals amount is
high as the predicted values from the regression model do not resemble the actual values of
the predicted variables. Here, the former case applies as standard error (7363.23) in context
of given dataset is on the lower side and representative of a superior fit in the form of
regression model estimated (Lind, Marchal and Wathen, 2016).
9
Document Page
References
Berenson, M., Levine, D., Szabat, K.A. and Krehbiel, T.C. (2015) Basic Business Statistcs:
Concepts and Applications. 3rd ed. Brisbane: Pearson Higher Education AU.
Lind, A.D., Marchal, G.W. and Wathen, A.S. (2016) Statistical Techniques in Business and
Economics. 15th ed. New York : McGraw-Hill/Irwin.
Medhi, J. (2016) Statistical Methods: An Introductory Text. 4th ed. Sydney: New Age
International.
Morien, D. (2017) Business Statistics. 2nd ed. Melbourne: Cengage learning Australia
10
chevron_up_icon
1 out of 10
circle_padding
hide_on_mobile
zoom_out_icon
logo.png

Your All-in-One AI-Powered Toolkit for Academic Success.

Available 24*7 on WhatsApp / Email

[object Object]