HI6007: Statistics for Business Decisions - Tutorial Questions

Verified

Added on  2023/01/11

|7
|901
|63
Homework Assignment
AI Summary
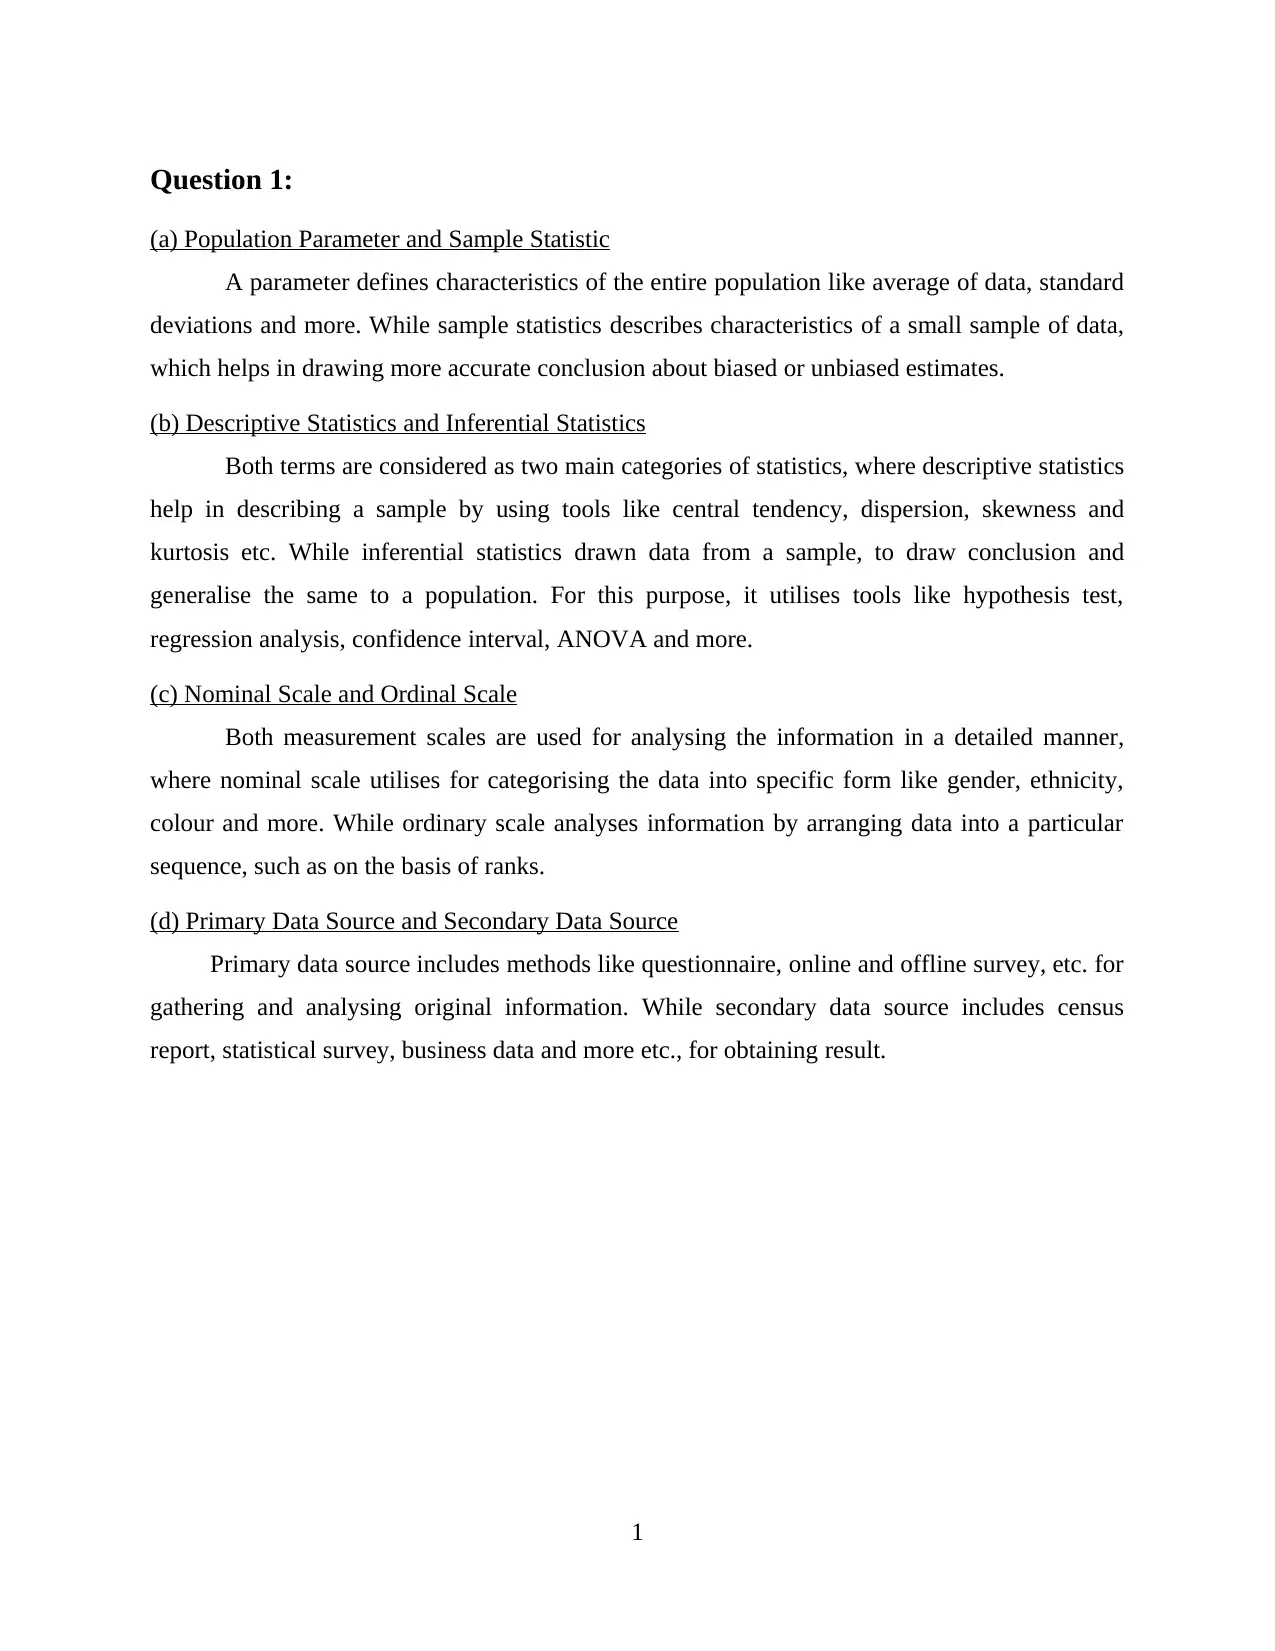
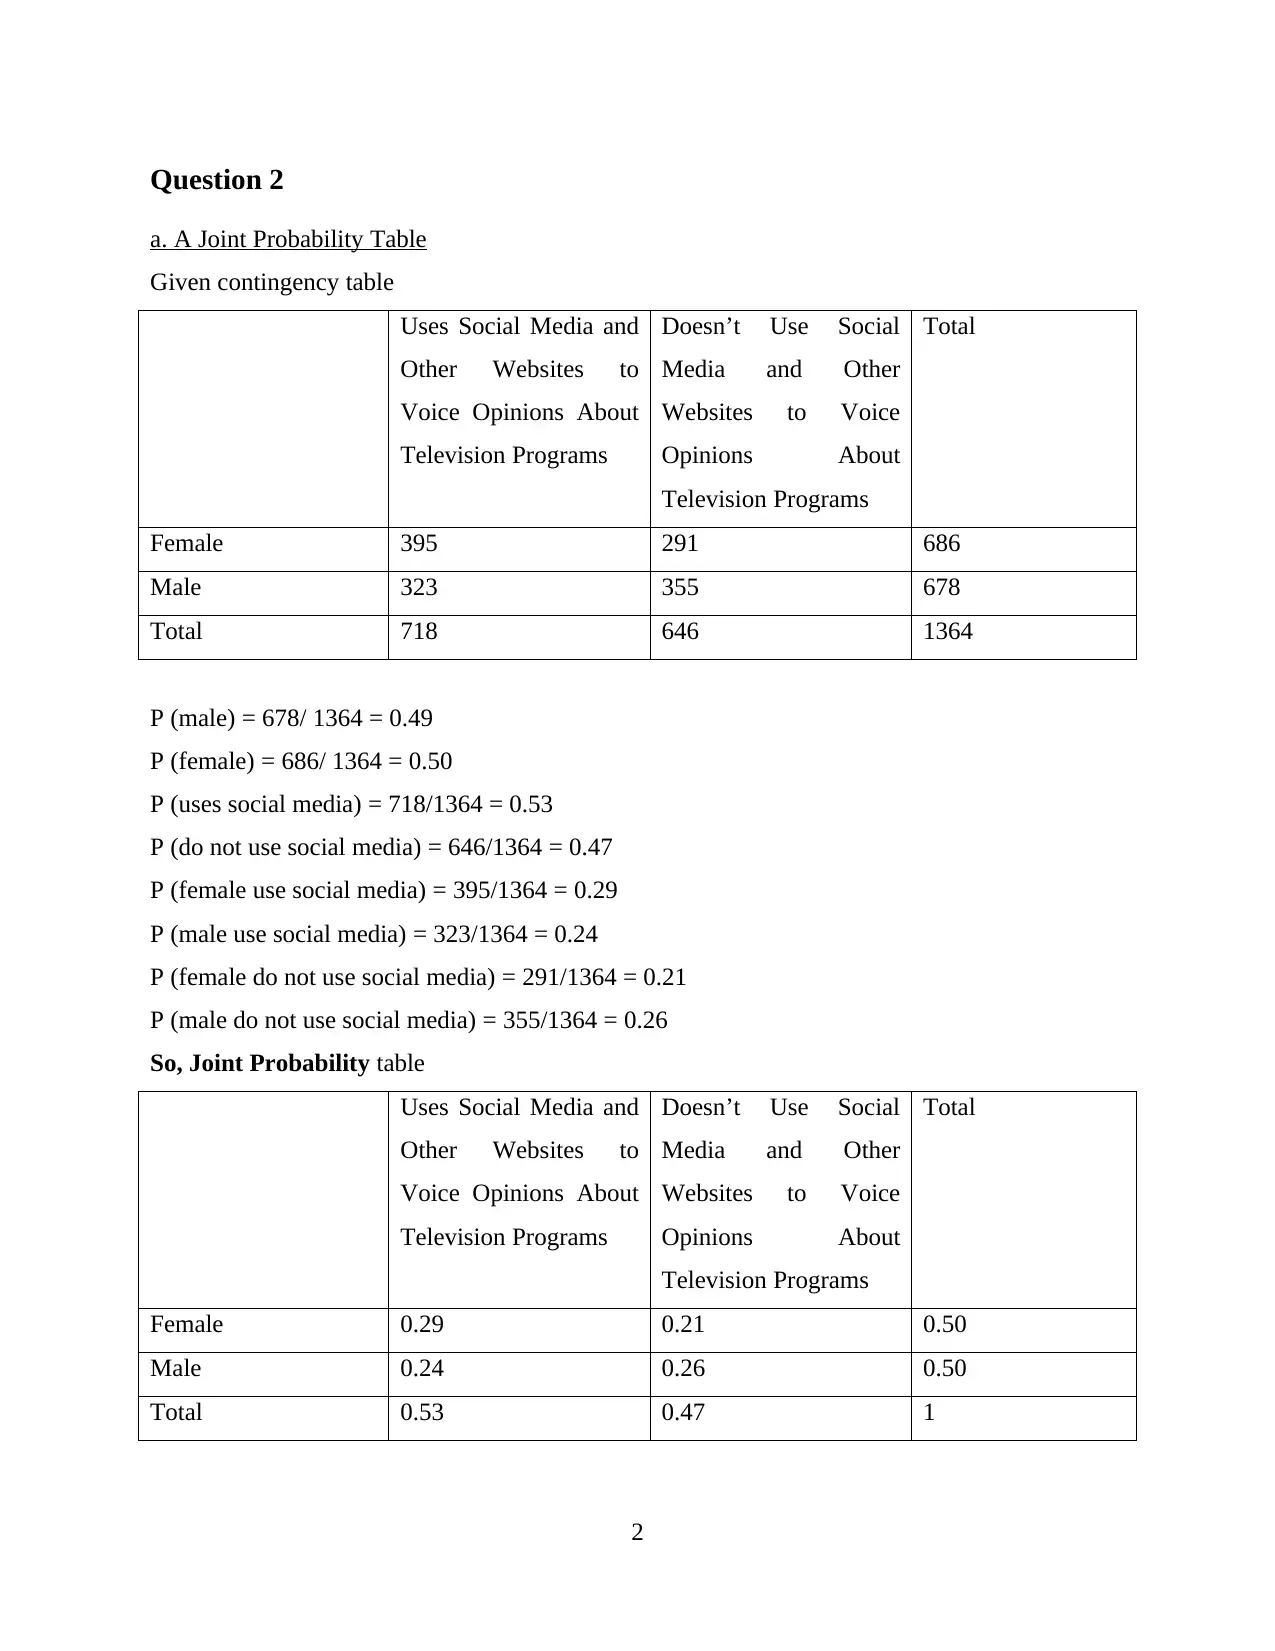
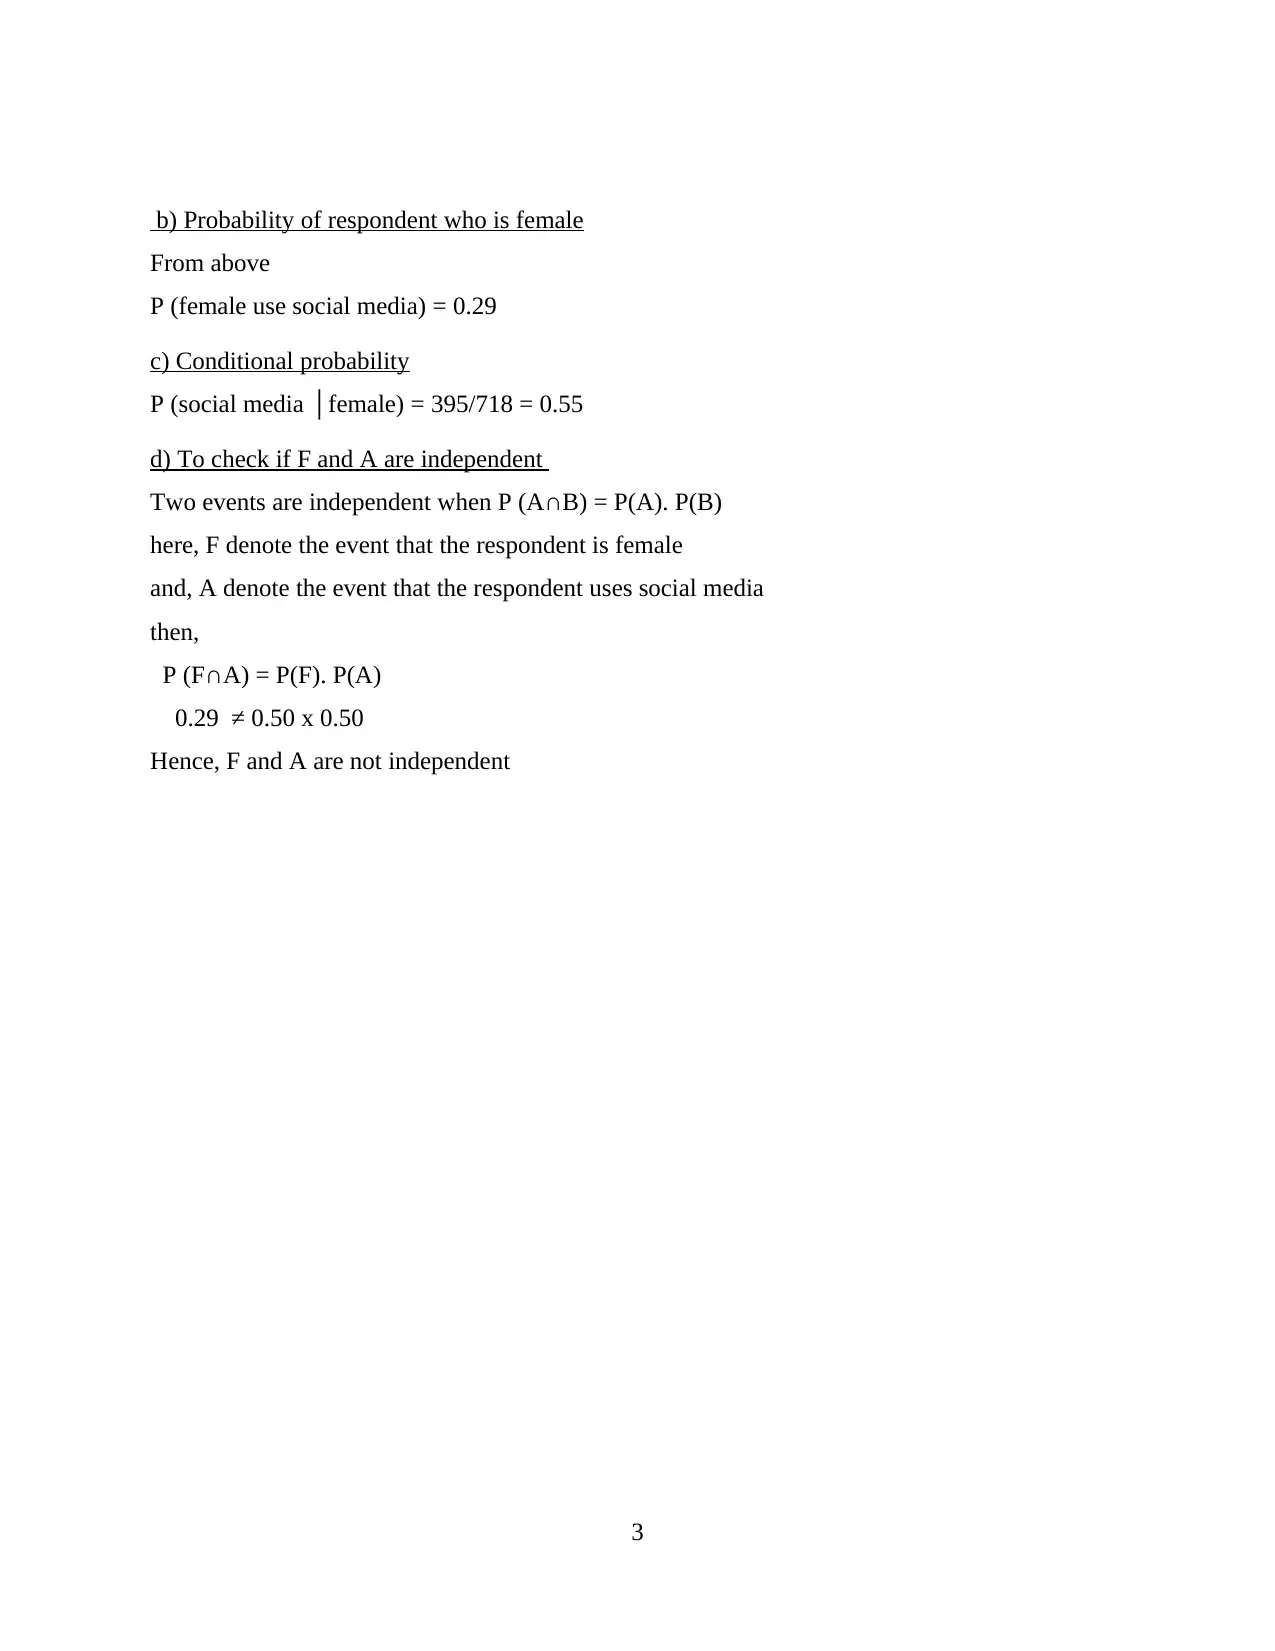
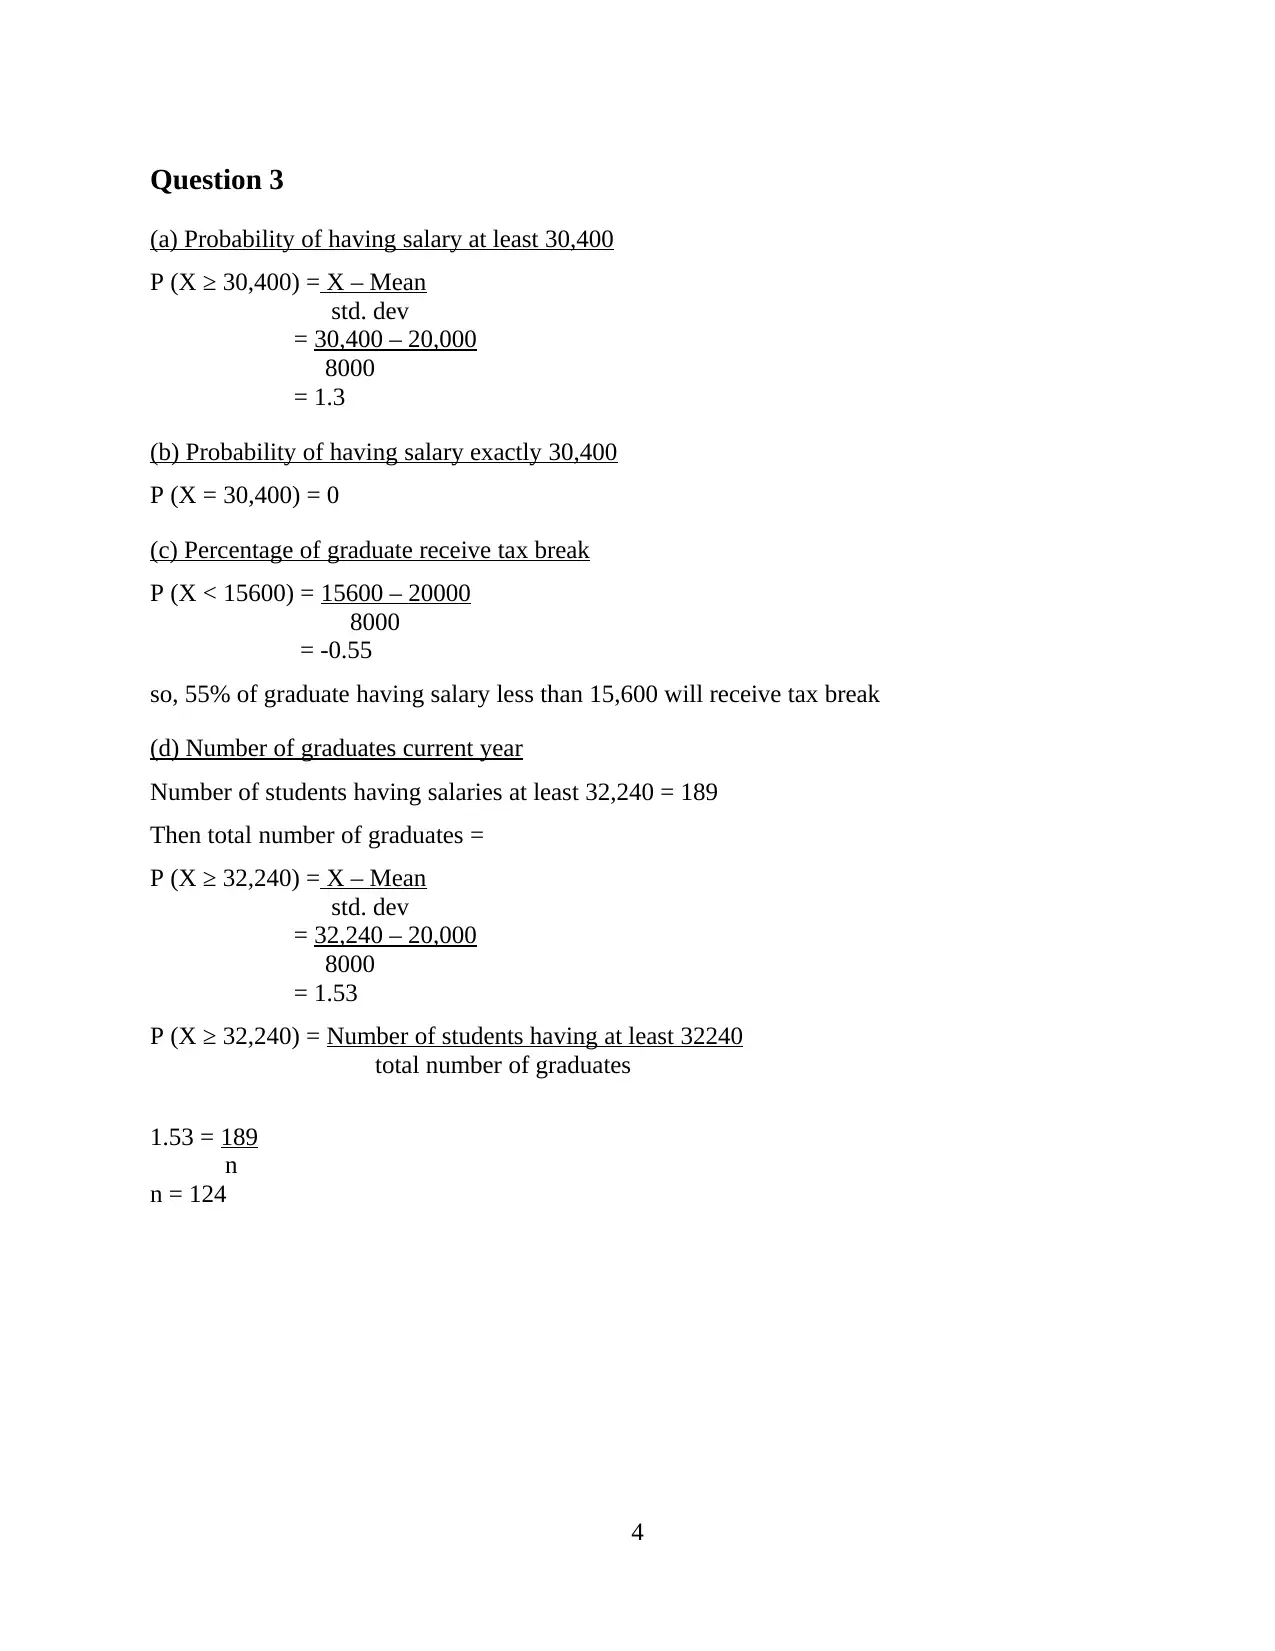
This document presents the solutions to tutorial questions from the HI6007 Statistics for Business Decisions unit. The solutions cover a range of statistical concepts, including population parameters versus sample statistics, descriptive and inferential statistics, measurement scales (nominal and ordinal), primary and secondary data sources, and joint and conditional probability. The document also addresses questions involving the normal distribution, z-scores, and hypothesis testing, providing detailed calculations and interpretations. Furthermore, the assignment explores the application of statistical methods to real-world business scenarios, such as analyzing survey data and interpreting salary distributions. The solutions are presented with clear explanations and formulas, making it a valuable resource for students studying statistics.
Document Page
Assessment Task Tutorial
Questions
tabler-icon-diamond-filled.svg

Paraphrase This Document

Need a fresh take? Get an instant paraphrase of this document with our AI Paraphraser
Document Page
Document Page
Question 1:
(a) Population Parameter and Sample Statistic
A parameter defines characteristics of the entire population like average of data, standard
deviations and more. While sample statistics describes characteristics of a small sample of data,
which helps in drawing more accurate conclusion about biased or unbiased estimates.
(b) Descriptive Statistics and Inferential Statistics
Both terms are considered as two main categories of statistics, where descriptive statistics
help in describing a sample by using tools like central tendency, dispersion, skewness and
kurtosis etc. While inferential statistics drawn data from a sample, to draw conclusion and
generalise the same to a population. For this purpose, it utilises tools like hypothesis test,
regression analysis, confidence interval, ANOVA and more.
(c) Nominal Scale and Ordinal Scale
Both measurement scales are used for analysing the information in a detailed manner,
where nominal scale utilises for categorising the data into specific form like gender, ethnicity,
colour and more. While ordinary scale analyses information by arranging data into a particular
sequence, such as on the basis of ranks.
(d) Primary Data Source and Secondary Data Source
Primary data source includes methods like questionnaire, online and offline survey, etc. for
gathering and analysing original information. While secondary data source includes census
report, statistical survey, business data and more etc., for obtaining result.
1
Document Page
Question 2
a. A Joint Probability Table
Given contingency table
Uses Social Media and
Other Websites to
Voice Opinions About
Television Programs
Doesn’t Use Social
Media and Other
Websites to Voice
Opinions About
Television Programs
Total
Female 395 291 686
Male 323 355 678
Total 718 646 1364
P (male) = 678/ 1364 = 0.49
P (female) = 686/ 1364 = 0.50
P (uses social media) = 718/1364 = 0.53
P (do not use social media) = 646/1364 = 0.47
P (female use social media) = 395/1364 = 0.29
P (male use social media) = 323/1364 = 0.24
P (female do not use social media) = 291/1364 = 0.21
P (male do not use social media) = 355/1364 = 0.26
So, Joint Probability table
Uses Social Media and
Other Websites to
Voice Opinions About
Television Programs
Doesn’t Use Social
Media and Other
Websites to Voice
Opinions About
Television Programs
Total
Female 0.29 0.21 0.50
Male 0.24 0.26 0.50
Total 0.53 0.47 1
2
tabler-icon-diamond-filled.svg

Paraphrase This Document

Need a fresh take? Get an instant paraphrase of this document with our AI Paraphraser
Document Page
b) Probability of respondent who is female
From above
P (female use social media) = 0.29
c) Conditional probability
P (social media │female) = 395/718 = 0.55
d) To check if F and A are independent
Two events are independent when P (A∩B) = P(A). P(B)
here, F denote the event that the respondent is female
and, A denote the event that the respondent uses social media
then,
P (F∩A) = P(F). P(A)
0.29 ≠ 0.50 x 0.50
Hence, F and A are not independent
3
Document Page
Question 3
(a) Probability of having salary at least 30,400
P (X ≥ 30,400) = X – Mean
std. dev
= 30,400 – 20,000
8000
= 1.3
(b) Probability of having salary exactly 30,400
P (X = 30,400) = 0
(c) Percentage of graduate receive tax break
P (X < 15600) = 15600 – 20000
8000
= -0.55
so, 55% of graduate having salary less than 15,600 will receive tax break
(d) Number of graduates current year
Number of students having salaries at least 32,240 = 189
Then total number of graduates =
P (X ≥ 32,240) = X – Mean
std. dev
= 32,240 – 20,000
8000
= 1.53
P (X ≥ 32,240) = Number of students having at least 32240
total number of graduates
1.53 = 189
n
n = 124
4
Document Page
Question 3
SAT Mean Scores
Critical reading 502
Mathematics 515
Writing 494
Standard deviation is 100
(a) z = X – Mean
std. dev/√n
= ± 10
100/ √90
±0.94
P = (-10 < z < 10) = P (-0.94 < z < 0.94)
= 1 – 2P (z < -0.95) using z table
= 1 – 2 x 0.1711 ≈ 0.66
(b) z = X – Mean
std. dev/√n
= ± 10
100/ √90
±0.94
P = (-10 < z < 10) = P (-0.94 < z < 0.94)
= 1 – 2P (z < -0.95) using z table
= 1 – 2 x 0.1711 ≈ 0.66
(c) (a) z = X – Mean
std. dev/√n
= ± 10
100/ √100
±1
P = (-10 < z < 10) = P (-1 < z < 1)
= 1 – 2P (z < -1) using z table
= 1 – 2 x 0.1587 ≈ 0.68
5
chevron_up_icon
1 out of 7
circle_padding
hide_on_mobile
zoom_out_icon
[object Object]