HI6007 Statistics Group Assignment, T3 2019, Holmes Institute
VerifiedAdded on  2022/08/23
|13
|848
|22
Homework Assignment
AI Summary
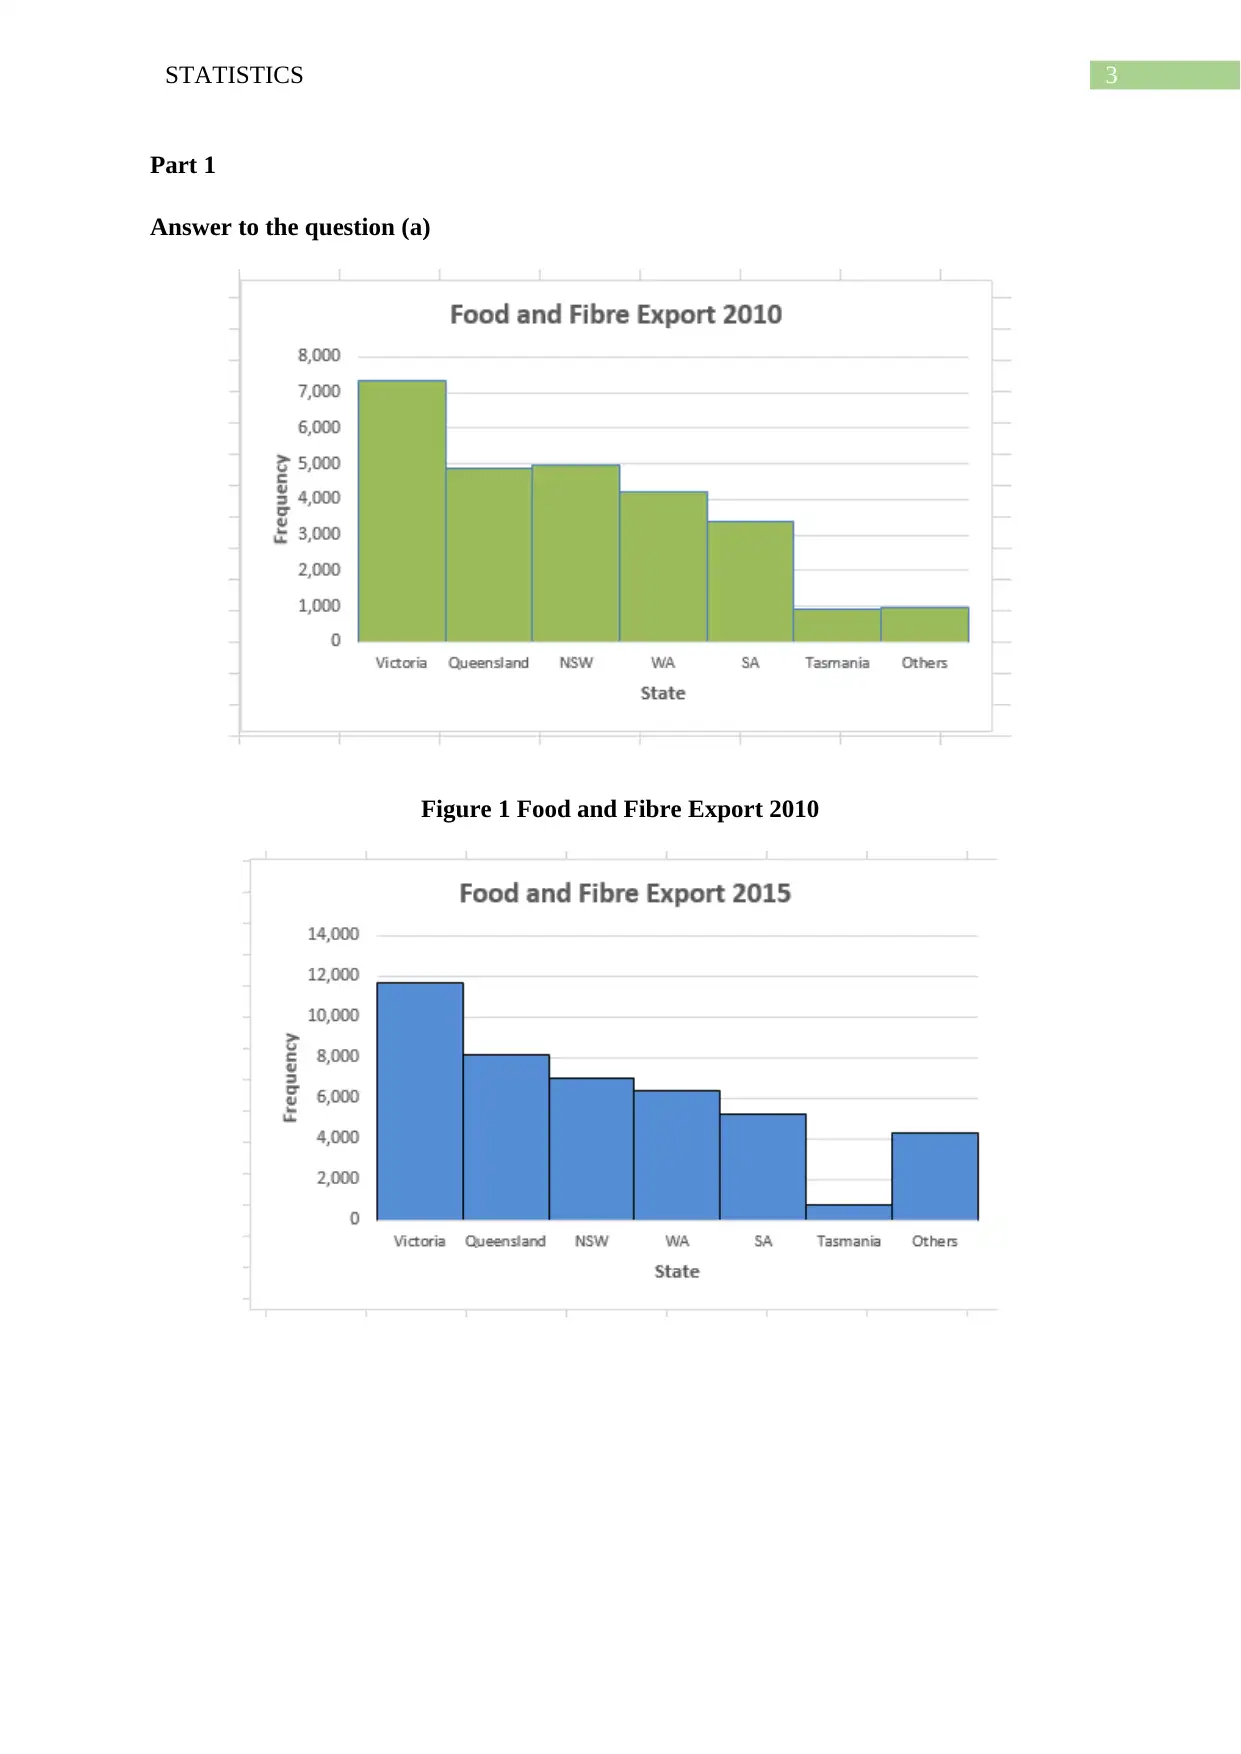
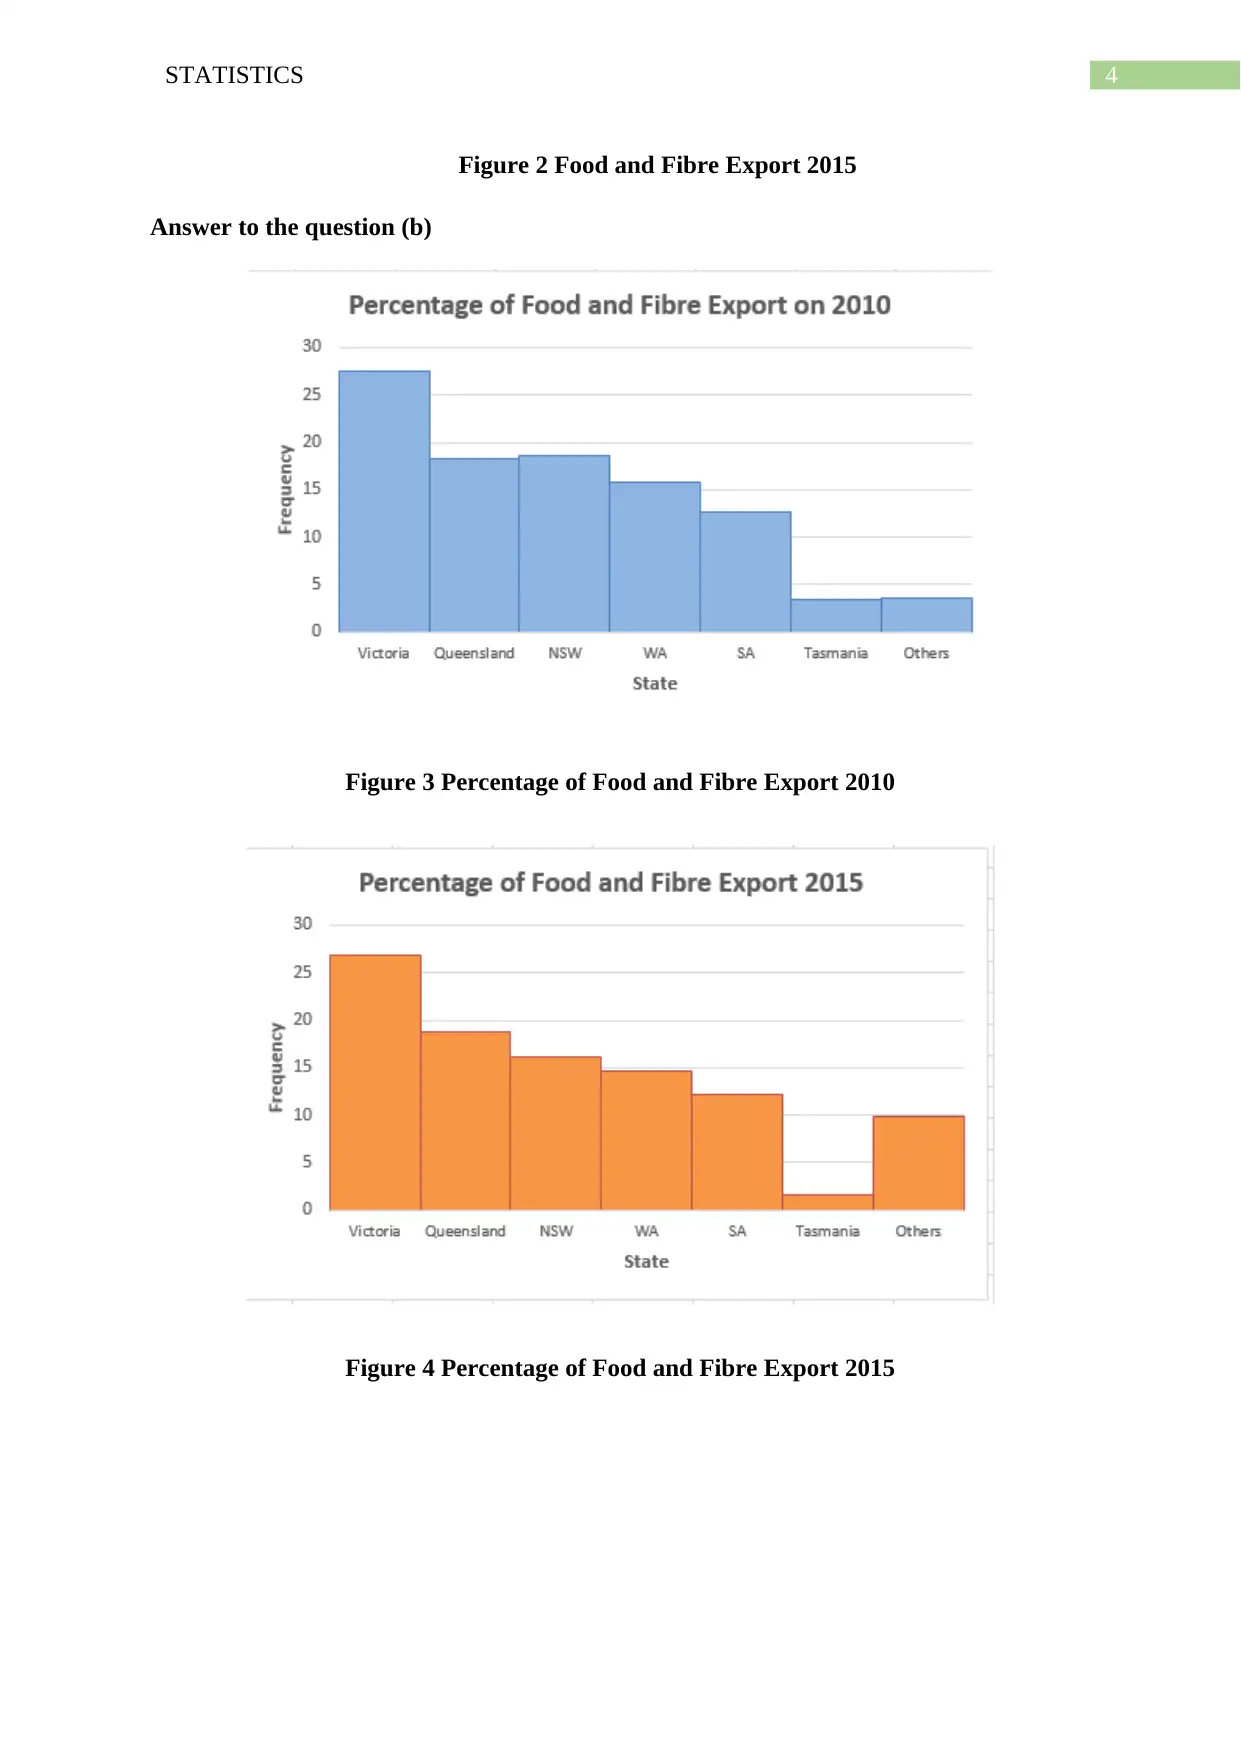
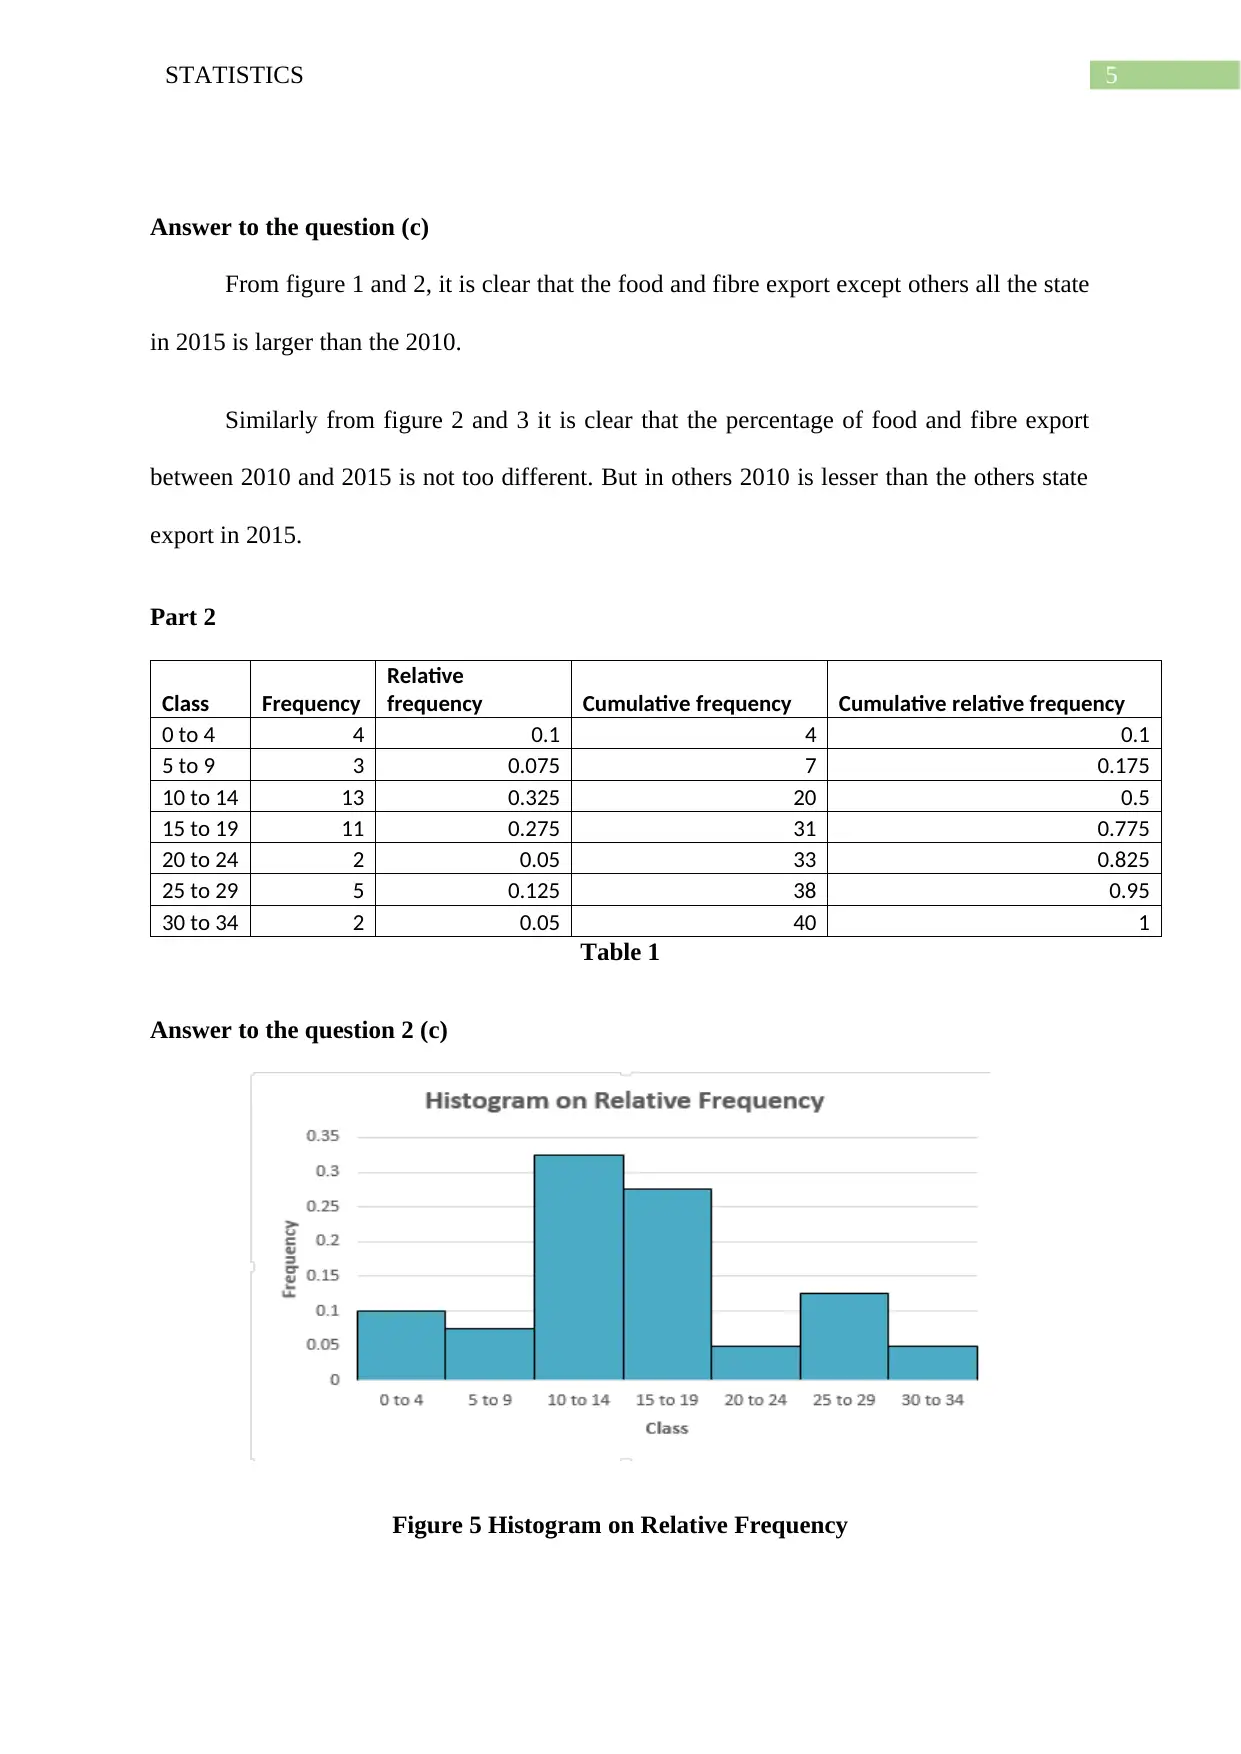
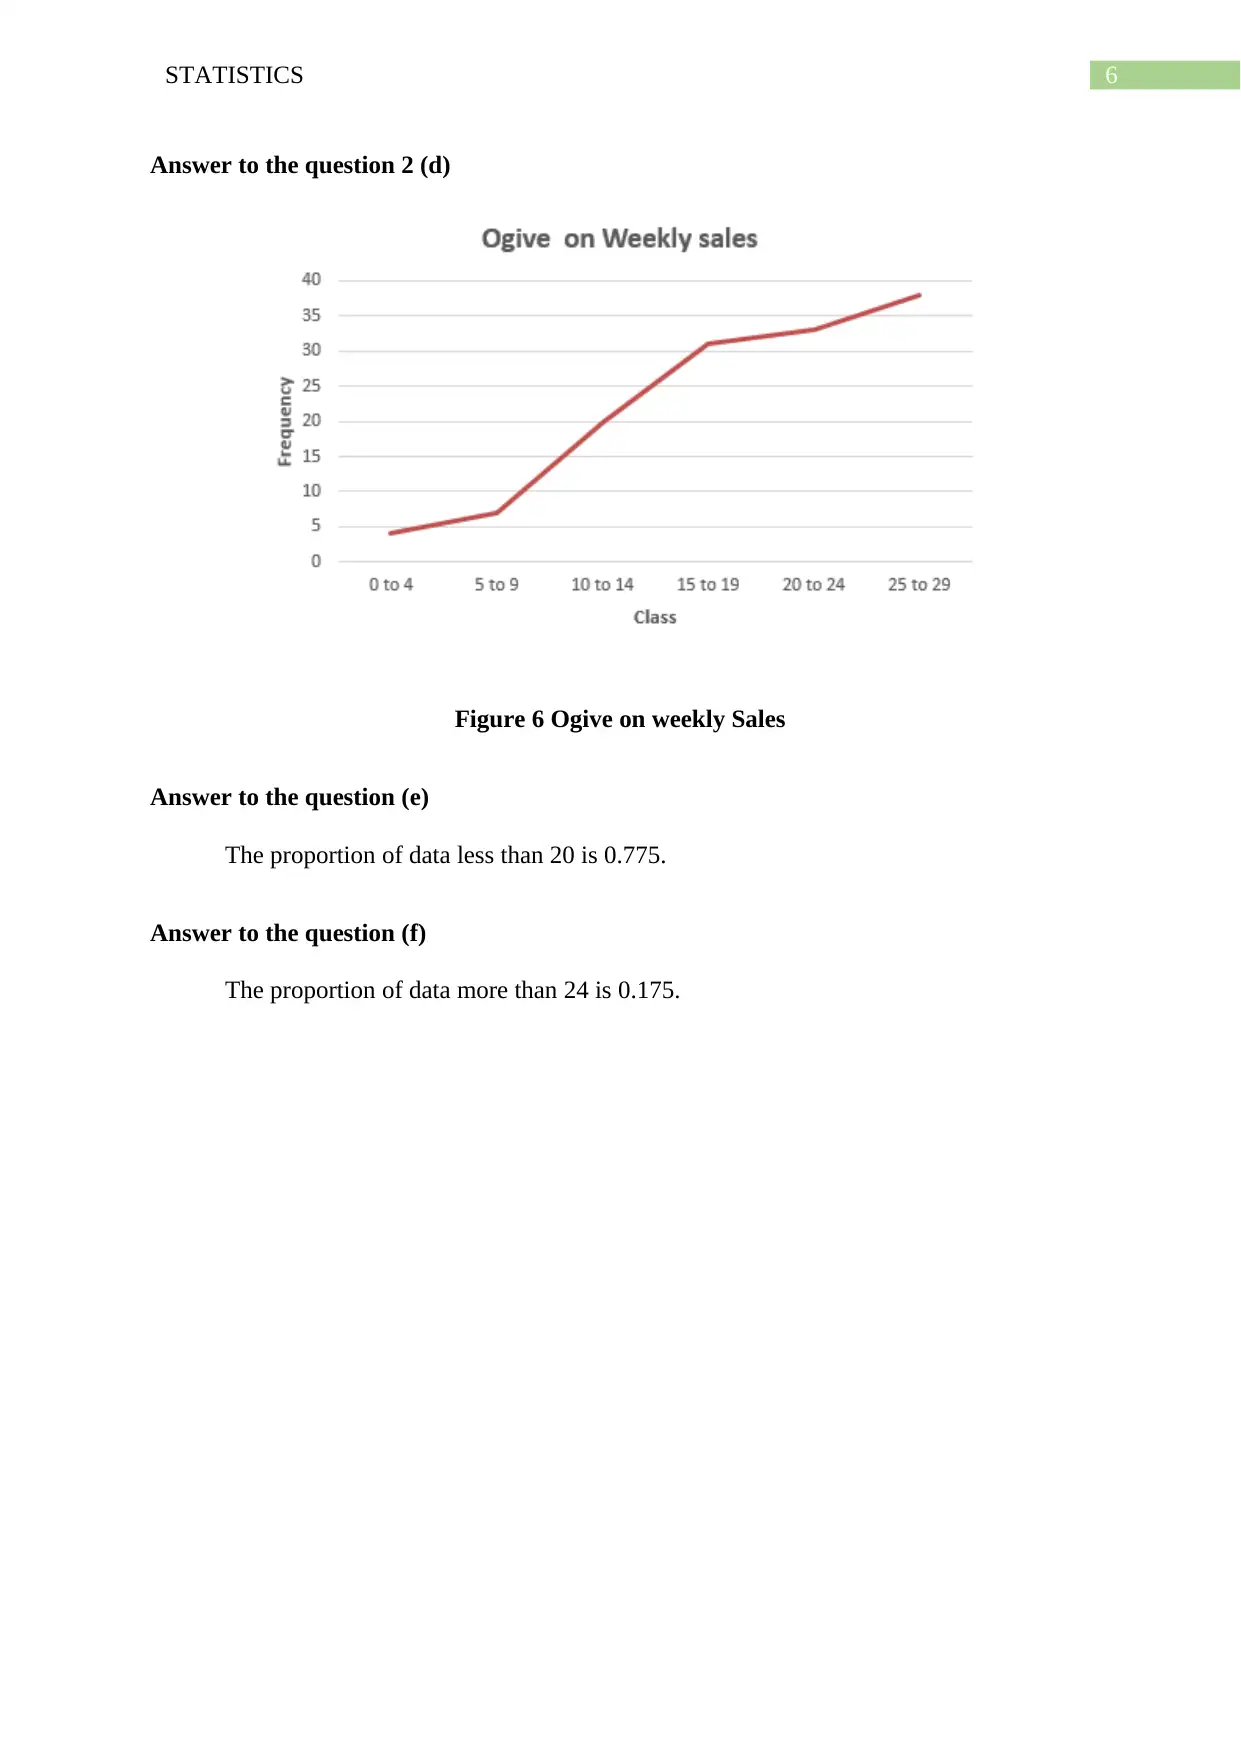
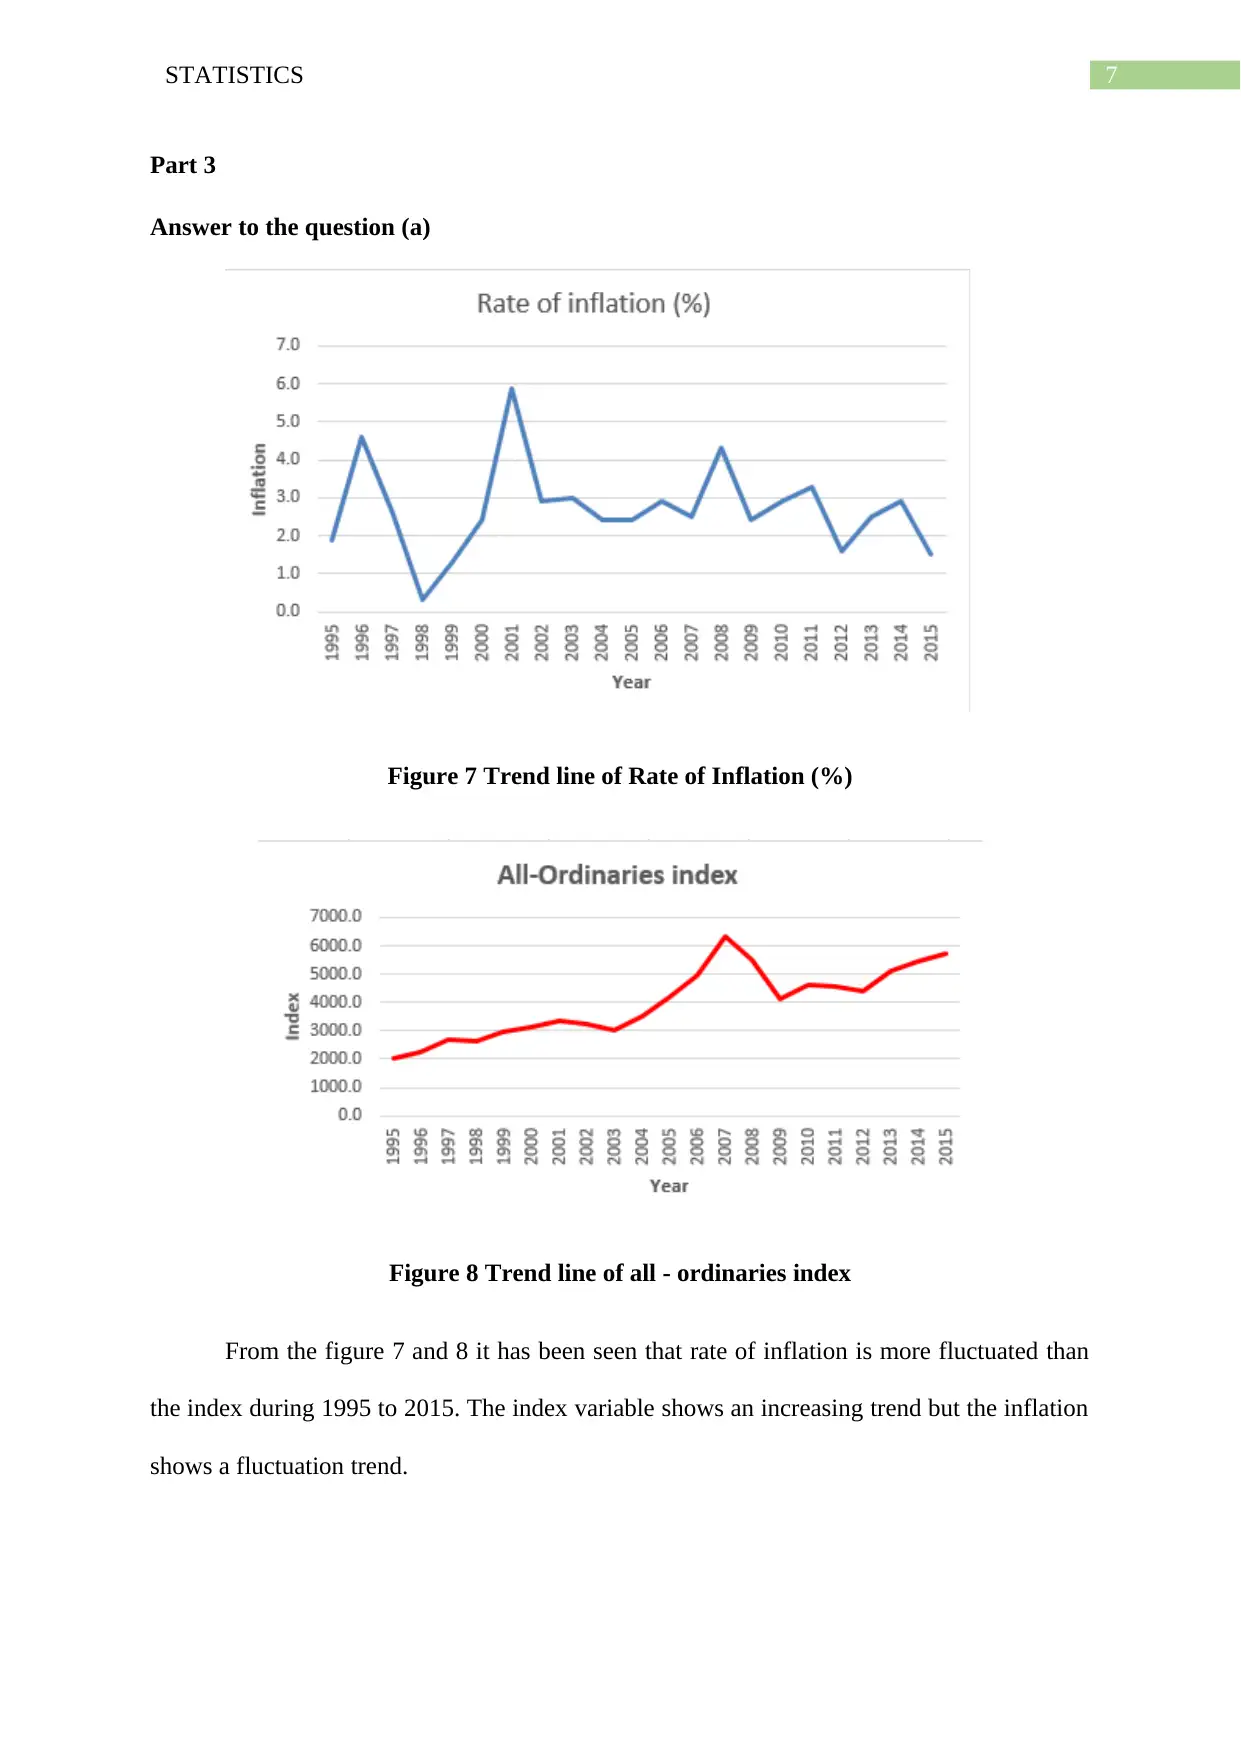
This document presents a comprehensive solution to a statistics assignment, likely for a business-related course. The assignment is divided into three parts, covering a range of statistical concepts and techniques. Part 1 involves interpreting and analyzing data presented in figures, such as food and fibre export data, and drawing comparisons between different years. Part 2 focuses on descriptive statistics, including the creation of frequency tables, histograms, ogives, and calculations of proportions. Part 3 delves into inferential statistics, exploring the relationship between variables such as inflation rate and an index. This section includes the creation of trend lines, scatter plots, and regression analysis, with the calculation of correlation coefficients, regression models, and hypothesis testing. The assignment demonstrates the application of various statistical methods to analyze data and draw meaningful conclusions, supported by tables, figures, and bibliographical references.

Running head: STATISTICS
Statistics
Name of the Student:
Name of the University:
Author note:
Statistics
Name of the Student:
Name of the University:
Author note:
Paraphrase This Document
Need a fresh take? Get an instant paraphrase of this document with our AI Paraphraser

1STATISTICS
Table of Contents
Part 1..........................................................................................................................................2
Answer to the question (a).....................................................................................................2
Figure 1 Food and Fibre Export 2010....................................................................................2
Figure 2 Food and Fibre Export 2015....................................................................................3
Answer to the question (b).....................................................................................................3
Answer to the question (c).....................................................................................................4
Part 2..........................................................................................................................................4
Answer to the question 2 (c)..................................................................................................4
Answer to the question 2 (d)..................................................................................................5
Answer to the question (e).....................................................................................................5
Answer to the question (f)......................................................................................................5
Part 3..........................................................................................................................................6
Answer to the question (a).....................................................................................................6
Answer to the question (b).....................................................................................................7
Answer to the question (c).....................................................................................................8
Table 3 Summary measure of all ordinaries index.................................................................9
Answer to the question (d).....................................................................................................9
Answer to the question (e).....................................................................................................9
Answer to the question (f)......................................................................................................9
Answer to the question (g).....................................................................................................9
Answer to the question (g)...................................................................................................10

2STATISTICS
Bibliography.............................................................................................................................11
⊘ This is a preview!⊘
Do you want full access?
Subscribe today to unlock all pages.

Trusted by 1+ million students worldwide

3STATISTICS
Part 1
Answer to the question (a)
Figure 1 Food and Fibre Export 2010
Part 1
Answer to the question (a)
Figure 1 Food and Fibre Export 2010
Paraphrase This Document
Need a fresh take? Get an instant paraphrase of this document with our AI Paraphraser

4STATISTICS
Figure 2 Food and Fibre Export 2015
Answer to the question (b)
Figure 3 Percentage of Food and Fibre Export 2010
Figure 4 Percentage of Food and Fibre Export 2015
Figure 2 Food and Fibre Export 2015
Answer to the question (b)
Figure 3 Percentage of Food and Fibre Export 2010
Figure 4 Percentage of Food and Fibre Export 2015

5STATISTICS
Answer to the question (c)
From figure 1 and 2, it is clear that the food and fibre export except others all the state
in 2015 is larger than the 2010.
Similarly from figure 2 and 3 it is clear that the percentage of food and fibre export
between 2010 and 2015 is not too different. But in others 2010 is lesser than the others state
export in 2015.
Part 2
Class Frequency
Relative
frequency Cumulative frequency Cumulative relative frequency
0 to 4 4 0.1 4 0.1
5 to 9 3 0.075 7 0.175
10 to 14 13 0.325 20 0.5
15 to 19 11 0.275 31 0.775
20 to 24 2 0.05 33 0.825
25 to 29 5 0.125 38 0.95
30 to 34 2 0.05 40 1
Table 1
Answer to the question 2 (c)
Figure 5 Histogram on Relative Frequency
⊘ This is a preview!⊘
Do you want full access?
Subscribe today to unlock all pages.

Trusted by 1+ million students worldwide

6STATISTICS
Answer to the question 2 (d)
Figure 6 Ogive on weekly Sales
Answer to the question (e)
The proportion of data less than 20 is 0.775.
Answer to the question (f)
The proportion of data more than 24 is 0.175.
Answer to the question 2 (d)
Figure 6 Ogive on weekly Sales
Answer to the question (e)
The proportion of data less than 20 is 0.775.
Answer to the question (f)
The proportion of data more than 24 is 0.175.
Paraphrase This Document
Need a fresh take? Get an instant paraphrase of this document with our AI Paraphraser

7STATISTICS
Part 3
Answer to the question (a)
Figure 7 Trend line of Rate of Inflation (%)
Figure 8 Trend line of all - ordinaries index
From the figure 7 and 8 it has been seen that rate of inflation is more fluctuated than
the index during 1995 to 2015. The index variable shows an increasing trend but the inflation
shows a fluctuation trend.

8STATISTICS
Answer to the question (b)
Figure 9 Scatter plot
There is a positive relation between two variables. But the relationship is not strong.
In this plot The X variable is rate of inflation and the Y variable is index, because the index is
depends upon the rate of inflation.
Answer to the question (b)
Figure 9 Scatter plot
There is a positive relation between two variables. But the relationship is not strong.
In this plot The X variable is rate of inflation and the Y variable is index, because the index is
depends upon the rate of inflation.
⊘ This is a preview!⊘
Do you want full access?
Subscribe today to unlock all pages.

Trusted by 1+ million students worldwide

9STATISTICS
Answer to the question (c)
Table 2 Summary measure of rate of inflation
Answer to the question (c)
Table 2 Summary measure of rate of inflation
Paraphrase This Document
Need a fresh take? Get an instant paraphrase of this document with our AI Paraphraser

10STATISTICS
Table 3 Summary measure of all ordinaries index
Answer to the question (d)
The correlation coefficient between the rate of inflation and the index is 0.039.
Answer to the question (e)
Table 4 coefficient of regression
The regression model is
Y = 40.31 + 3874.286 * X
Answer to the question (f)
Table 5 summary table of Regression
The coefficient of determination is 0.0015.
Answer to the question (g)
Null hypothesis: There is no relationship between the rate of inflation and index.
Alternative hypothesis: There is a relationship between the rate of inflation and index.

11STATISTICS
Table 6 ANOVA table
Test statistic = 0.028
P- Value = 0.87
Alpha= 0.05 (at 5% level)
It has been seen that the P value is larger than the alpha. That is the hypothesis is not
significant. Hence it may be concluded at the significance level 5% that is no relationship
between the rate of inflation and index.
Answer to the question (g)
The standard error of the estimate is 696.832
It is good to fit the regression model.
⊘ This is a preview!⊘
Do you want full access?
Subscribe today to unlock all pages.

Trusted by 1+ million students worldwide
1 out of 13
Related Documents

Your All-in-One AI-Powered Toolkit for Academic Success.
 +13062052269
info@desklib.com
Available 24*7 on WhatsApp / Email
Unlock your academic potential
Copyright © 2020–2025 A2Z Services. All Rights Reserved. Developed and managed by ZUCOL.