Statistics and Research Methods in Business Decision Making - HI6007

Verified

Added on  2022/08/19

|12
|1009
|159
Homework Assignment
AI Summary
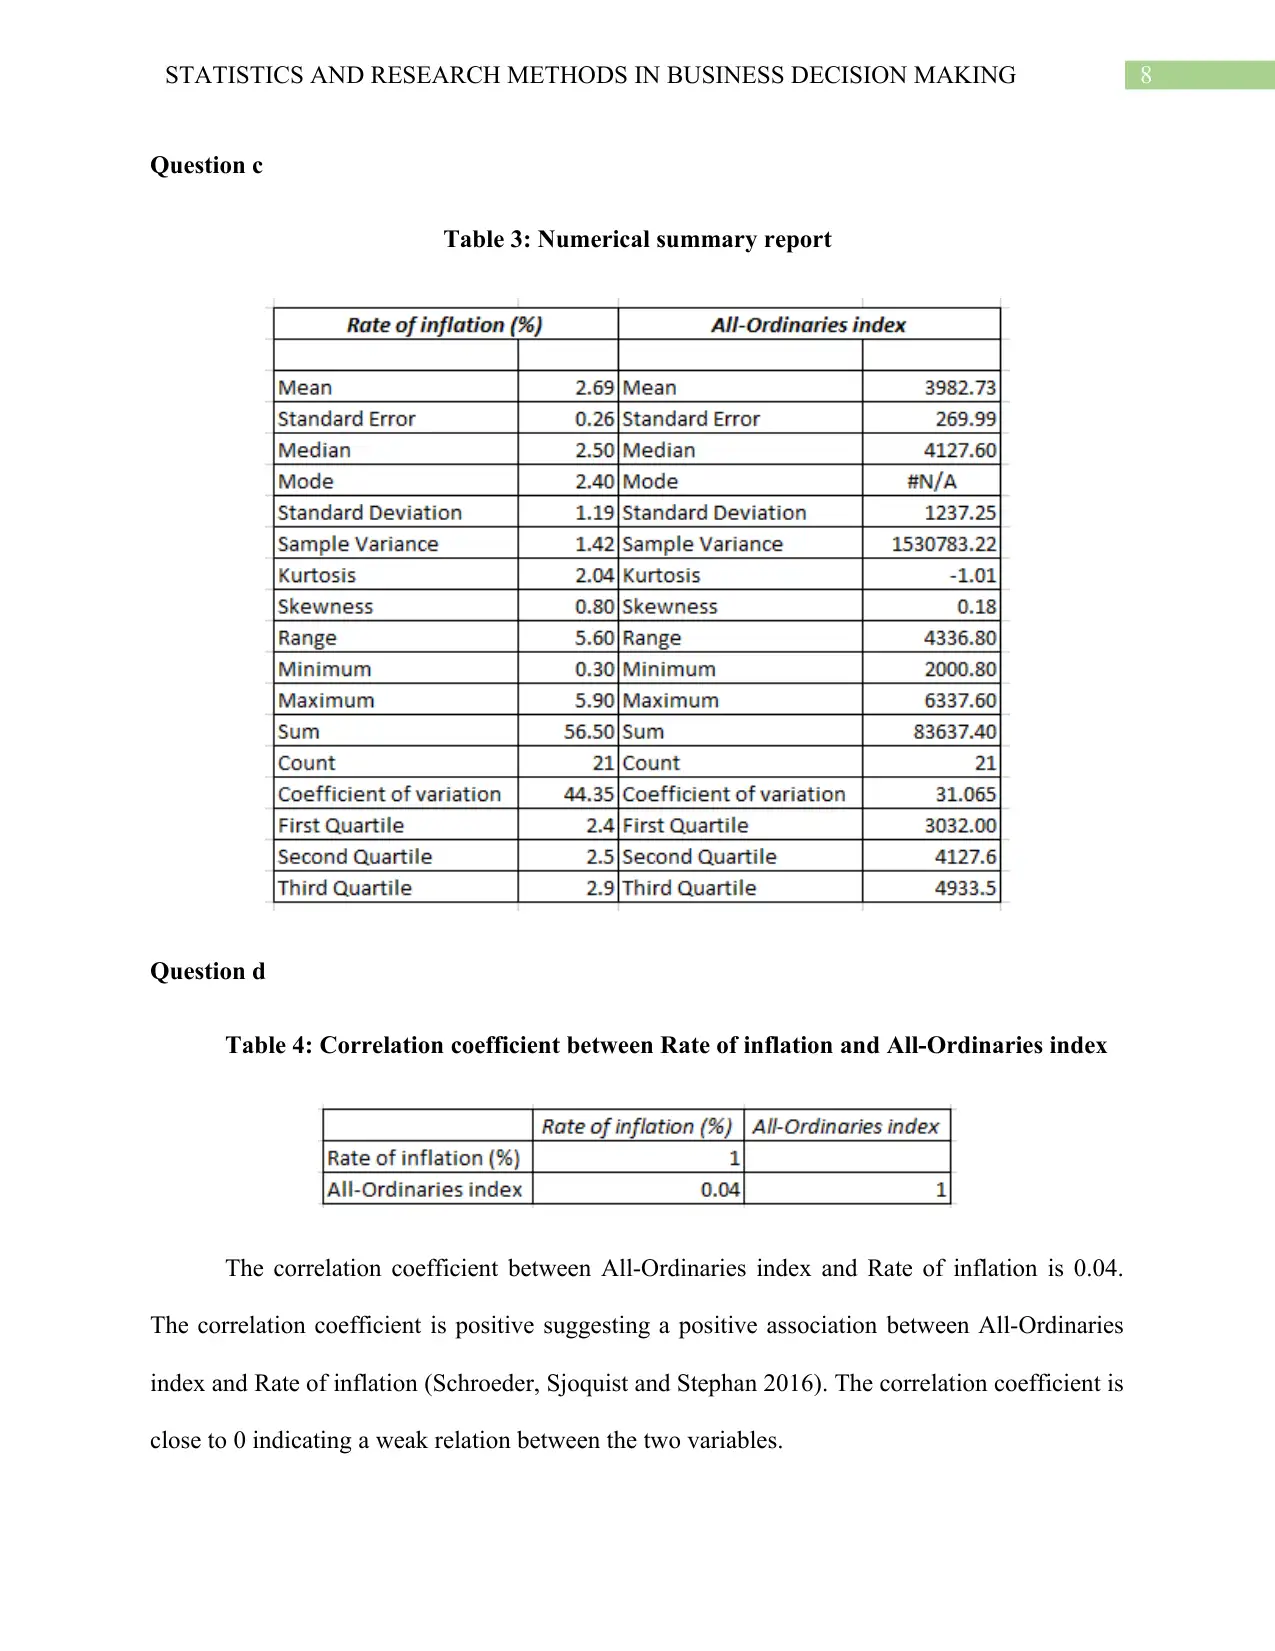
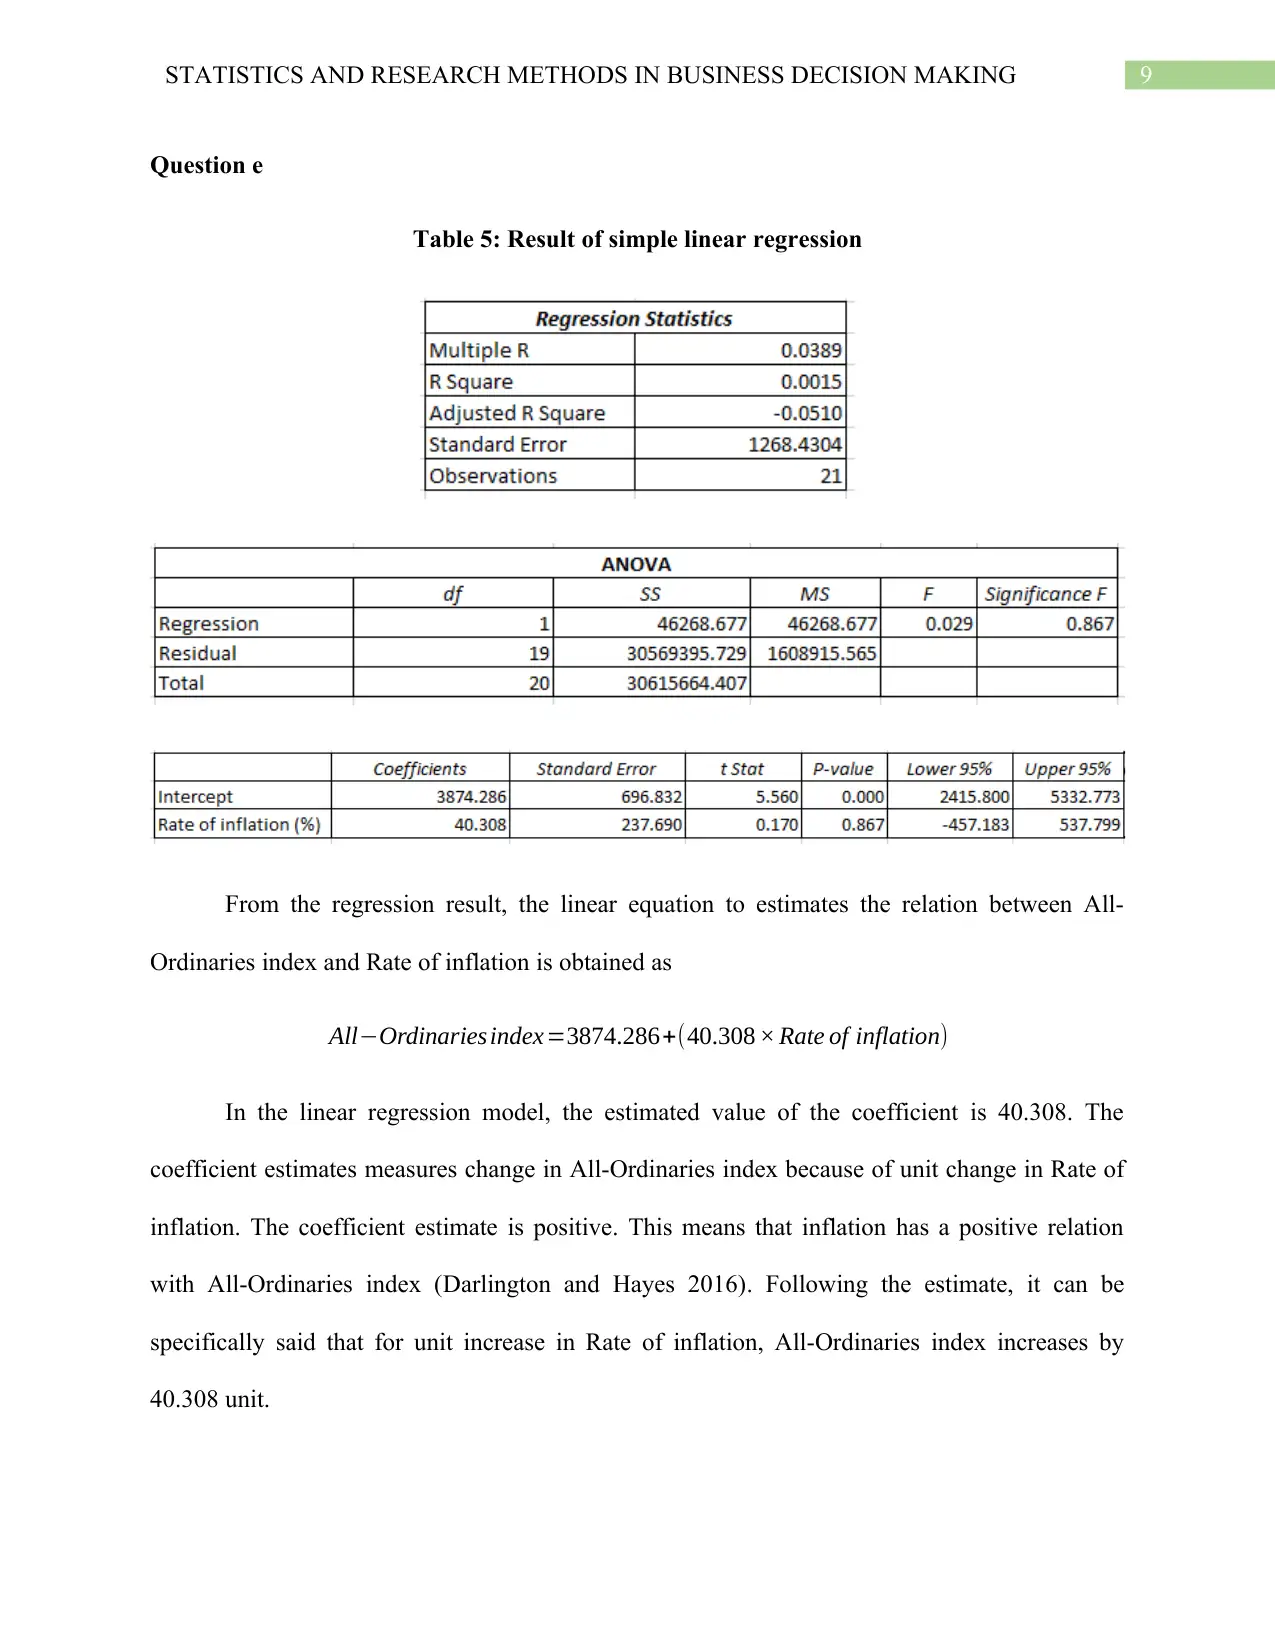
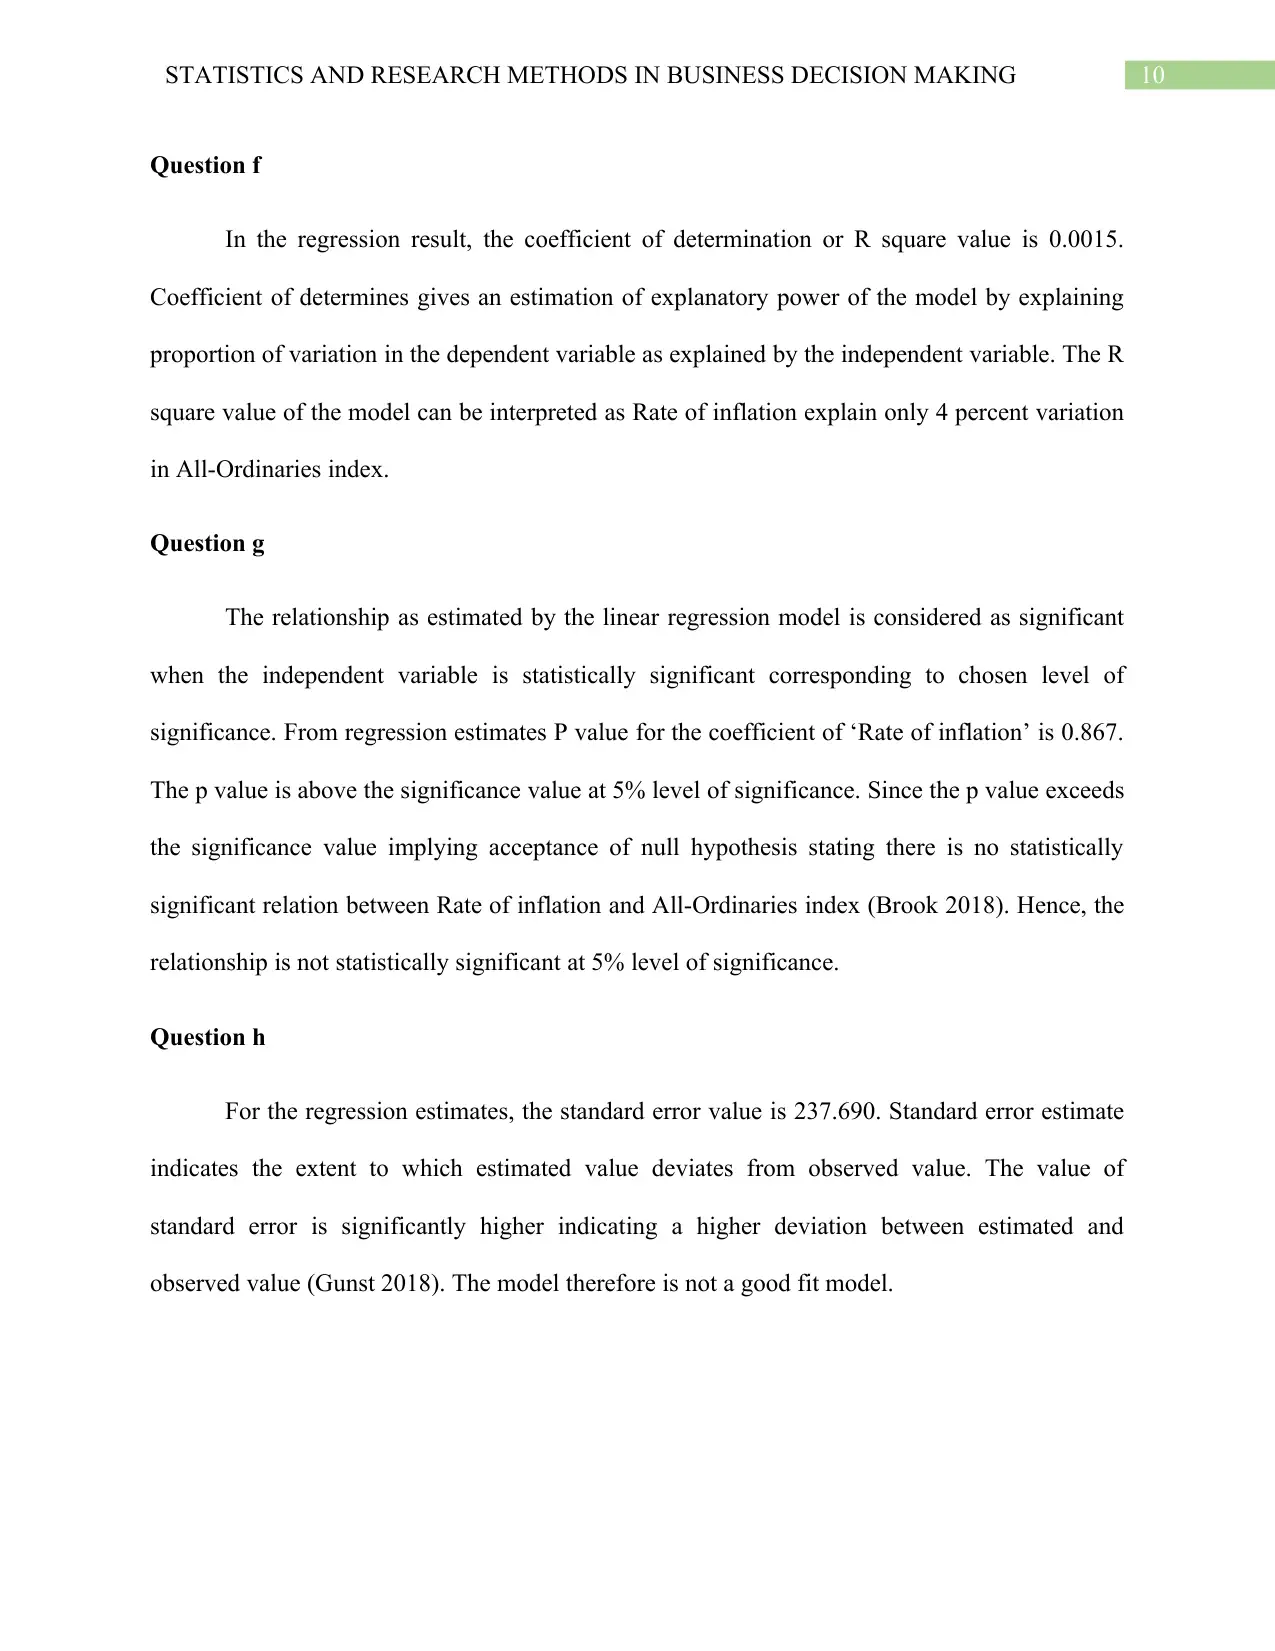
This assignment, prepared for the HI6007 course at Holmes Institute, focuses on the application of statistical methods and research techniques in business decision-making. The solution includes an analysis of food and fiber export data, frequency distributions, and histograms. It also presents a time series analysis of the All-Ordinaries index and inflation rates, exploring their relationship through scatter plots, correlation coefficients, and linear regression models. The assignment examines the statistical significance of the relationship and the explanatory power of the model, concluding with an assessment of the model's fit based on standard error. The student demonstrates an understanding of statistical concepts and their practical application in a business context.
tabler-icon-diamond-filled.svg

Contribute Materials

Your contribution can guide someone’s learning journey. Share your documents today.
Document Page
Running head: STATISTICS AND RESEARCH METHODS IN BUSINESS DECISION
MAKING
Statistics and Research Methods in Business Decision Making
Name of the Student
Name of the University
Course ID
tabler-icon-diamond-filled.svg

Secure Best Marks with AI Grader

Need help grading? Try our AI Grader for instant feedback on your assignments.
Document Page
1STATISTICS AND RESEARCH METHODS IN BUSINESS DECISION MAKING
Table of Contents
Question 1........................................................................................................................................2
Question a....................................................................................................................................2
Question b....................................................................................................................................2
Question c....................................................................................................................................3
Question 2........................................................................................................................................3
Question a....................................................................................................................................3
Question b....................................................................................................................................4
Question c....................................................................................................................................4
Question d....................................................................................................................................5
Question e....................................................................................................................................5
Question f.....................................................................................................................................6
Question 3........................................................................................................................................6
Question a....................................................................................................................................6
Question b....................................................................................................................................7
Question c....................................................................................................................................8
Question d....................................................................................................................................8
Question e....................................................................................................................................9
Question f...................................................................................................................................10
Question g..................................................................................................................................10
Question h..................................................................................................................................10
References......................................................................................................................................11
Document Page
2STATISTICS AND RESEARCH METHODS IN BUSINESS DECISION MAKING
Question 1
Question a
Figure 1: Value of food and fibre export in 2010 and 2015
Question b
Figure 2: Percentage value of food and fibre export in 2010 and 2015
Document Page
3STATISTICS AND RESEARCH METHODS IN BUSINESS DECISION MAKING
Question c
Figure 1 which compares the amount of export of food and fibres by state between 2010
and 2015 shows that there is an increase in volume of export by almost all states except
Tasmania in 2015. In both the year, Victoria constituted highest volume of export. The
percentage share of exports between the two years is presented in figure 2. Percentage share in
export in 2015 has decreased for Victoria, NSW, WA, SA and Tasmania. The percentage share
in export has increased only for Queensland. This suggests increase in export share by states
other than Victoria, Queensland NSW, WA, SA and Tasmania.
Question 2
Question a
Table 1: Frequency distribution and Relative frequency distribution
tabler-icon-diamond-filled.svg

Secure Best Marks with AI Grader

Need help grading? Try our AI Grader for instant feedback on your assignments.
Document Page
4STATISTICS AND RESEARCH METHODS IN BUSINESS DECISION MAKING
Question b
Table 2: Cumulative frequency distribution and Cumulative relative frequency
distribution
Question c
Figure 3: Relative frequency histogram
Document Page
5STATISTICS AND RESEARCH METHODS IN BUSINESS DECISION MAKING
Question d
Figure 4: Ogive for the data
Question e
Proportion of data less than 20 is
Number of observation less than20
Total number of observation
¿ 31
40
¿ 0.78
Document Page
6STATISTICS AND RESEARCH METHODS IN BUSINESS DECISION MAKING
Question f
Proportion of data more than 24
Number of observation more than 24
Total number of observation
¿ 7
40
¿ 0.18
Question 3
Question a
Figure 5: Graphical description of All-Ordinaries index and Rate of inflation
tabler-icon-diamond-filled.svg

Paraphrase This Document

Need a fresh take? Get an instant paraphrase of this document with our AI Paraphraser
Document Page
7STATISTICS AND RESEARCH METHODS IN BUSINESS DECISION MAKING
From the time series graph showing trend movement of All-Ordinaries index and Rate of
inflation indicates that there is a continuous increase in All-Ordinaries index overtime. The series
of inflation constitutes a fluctuating trend which more or less decreases overtime.
Question b
Figure 6: Graphical relation between Rate of inflation and All-Ordinaries index
All-Ordinaries index is used as a hedge against higher inflation. All-Ordinaries index
therefore tends to vary with inflation rate. Since All-Ordinaries index depends on Rate of
inflation, in the above scatter plot, All-Ordinaries index is selected as dependent variable and
hence, measured on Y axis. Rate of inflation is the independent variable and hence measured on
X axis (Gunst 2018). The scatter diagram shown a weak positive relation between All-ordinaries
index and Rate of inflation. That is All-Ordinaries index increases with increase in Rate of
inflation.
Document Page
8STATISTICS AND RESEARCH METHODS IN BUSINESS DECISION MAKING
Question c
Table 3: Numerical summary report
Question d
Table 4: Correlation coefficient between Rate of inflation and All-Ordinaries index
The correlation coefficient between All-Ordinaries index and Rate of inflation is 0.04.
The correlation coefficient is positive suggesting a positive association between All-Ordinaries
index and Rate of inflation (Schroeder, Sjoquist and Stephan 2016). The correlation coefficient is
close to 0 indicating a weak relation between the two variables.
Document Page
9STATISTICS AND RESEARCH METHODS IN BUSINESS DECISION MAKING
Question e
Table 5: Result of simple linear regression
From the regression result, the linear equation to estimates the relation between All-
Ordinaries index and Rate of inflation is obtained as
AllOrdinaries index=3874.286+(40.308 × Rate of inflation)
In the linear regression model, the estimated value of the coefficient is 40.308. The
coefficient estimates measures change in All-Ordinaries index because of unit change in Rate of
inflation. The coefficient estimate is positive. This means that inflation has a positive relation
with All-Ordinaries index (Darlington and Hayes 2016). Following the estimate, it can be
specifically said that for unit increase in Rate of inflation, All-Ordinaries index increases by
40.308 unit.
tabler-icon-diamond-filled.svg

Secure Best Marks with AI Grader

Need help grading? Try our AI Grader for instant feedback on your assignments.
Document Page
10STATISTICS AND RESEARCH METHODS IN BUSINESS DECISION MAKING
Question f
In the regression result, the coefficient of determination or R square value is 0.0015.
Coefficient of determines gives an estimation of explanatory power of the model by explaining
proportion of variation in the dependent variable as explained by the independent variable. The R
square value of the model can be interpreted as Rate of inflation explain only 4 percent variation
in All-Ordinaries index.
Question g
The relationship as estimated by the linear regression model is considered as significant
when the independent variable is statistically significant corresponding to chosen level of
significance. From regression estimates P value for the coefficient of ‘Rate of inflation’ is 0.867.
The p value is above the significance value at 5% level of significance. Since the p value exceeds
the significance value implying acceptance of null hypothesis stating there is no statistically
significant relation between Rate of inflation and All-Ordinaries index (Brook 2018). Hence, the
relationship is not statistically significant at 5% level of significance.
Question h
For the regression estimates, the standard error value is 237.690. Standard error estimate
indicates the extent to which estimated value deviates from observed value. The value of
standard error is significantly higher indicating a higher deviation between estimated and
observed value (Gunst 2018). The model therefore is not a good fit model.
Document Page
11STATISTICS AND RESEARCH METHODS IN BUSINESS DECISION MAKING
References
Brook, R.J., 2018. Applied regression analysis and experimental design. Routledge.
Darlington, R.B. and Hayes, A.F., 2016. Regression analysis and linear models: Concepts,
applications, and implementation. Guilford Publications.
Gunst, R.F., 2018. Regression analysis and its application: a data-oriented approach.
Routledge.
Schroeder, L.D., Sjoquist, D.L. and Stephan, P.E., 2016. Understanding regression analysis: An
introductory guide (Vol. 57). Sage Publications
chevron_up_icon
1 out of 12
circle_padding
hide_on_mobile
zoom_out_icon
logo.png

Your All-in-One AI-Powered Toolkit for Academic Success.

Available 24*7 on WhatsApp / Email

[object Object]