HI6007 Statistics for Business Decisions Online Assessment
VerifiedAdded on 2022/12/16
|19
|1808
|1
Homework Assignment
AI Summary
This document provides a detailed solution to the HI6007 Statistics for Business Decisions Online Supplementary Assessment from Trimester 3, 2020. The assessment covers a range of statistical concepts, including probability calculations related to client behavior, normal distribution and probability calculations, hypothesis testing for comparing population means, ANOVA for assessing differences between assembly methods, time series analysis with linear trend equations and weighted moving averages for sales forecasting, and multiple regression analysis to predict credit card charges based on consumer characteristics. The solution includes step-by-step calculations, explanations of statistical tests, and interpretations of results, providing a comprehensive guide to the topics covered in the assessment. The document also includes completed tables and formulas to support the answers provided.
Student Number: (enter on the line below)
Student Name: (enter on the line below)
HI6007
Statistics for Business Decisions
Online Supplementary Assessment
Trimester 3, 2020
Assessment Weight: 50 total marks
Instructions:
All questions must be answered by using the answer boxes provided in this paper.
Formula Sheet is included with this paper
Completed answers must be submitted to Blackboard by the published due date
and time. Submission instructions are at the bottom of this paper.
Purpose:
This assessment consists of six (6) questions and is designed to assess your level of
knowledge of the key topics covered in this unit
HI6007 Online Supp T3 2020
Paraphrase This Document
Need a fresh take? Get an instant paraphrase of this document with our AI Paraphraser

HI6007 Online Supp T3 2020
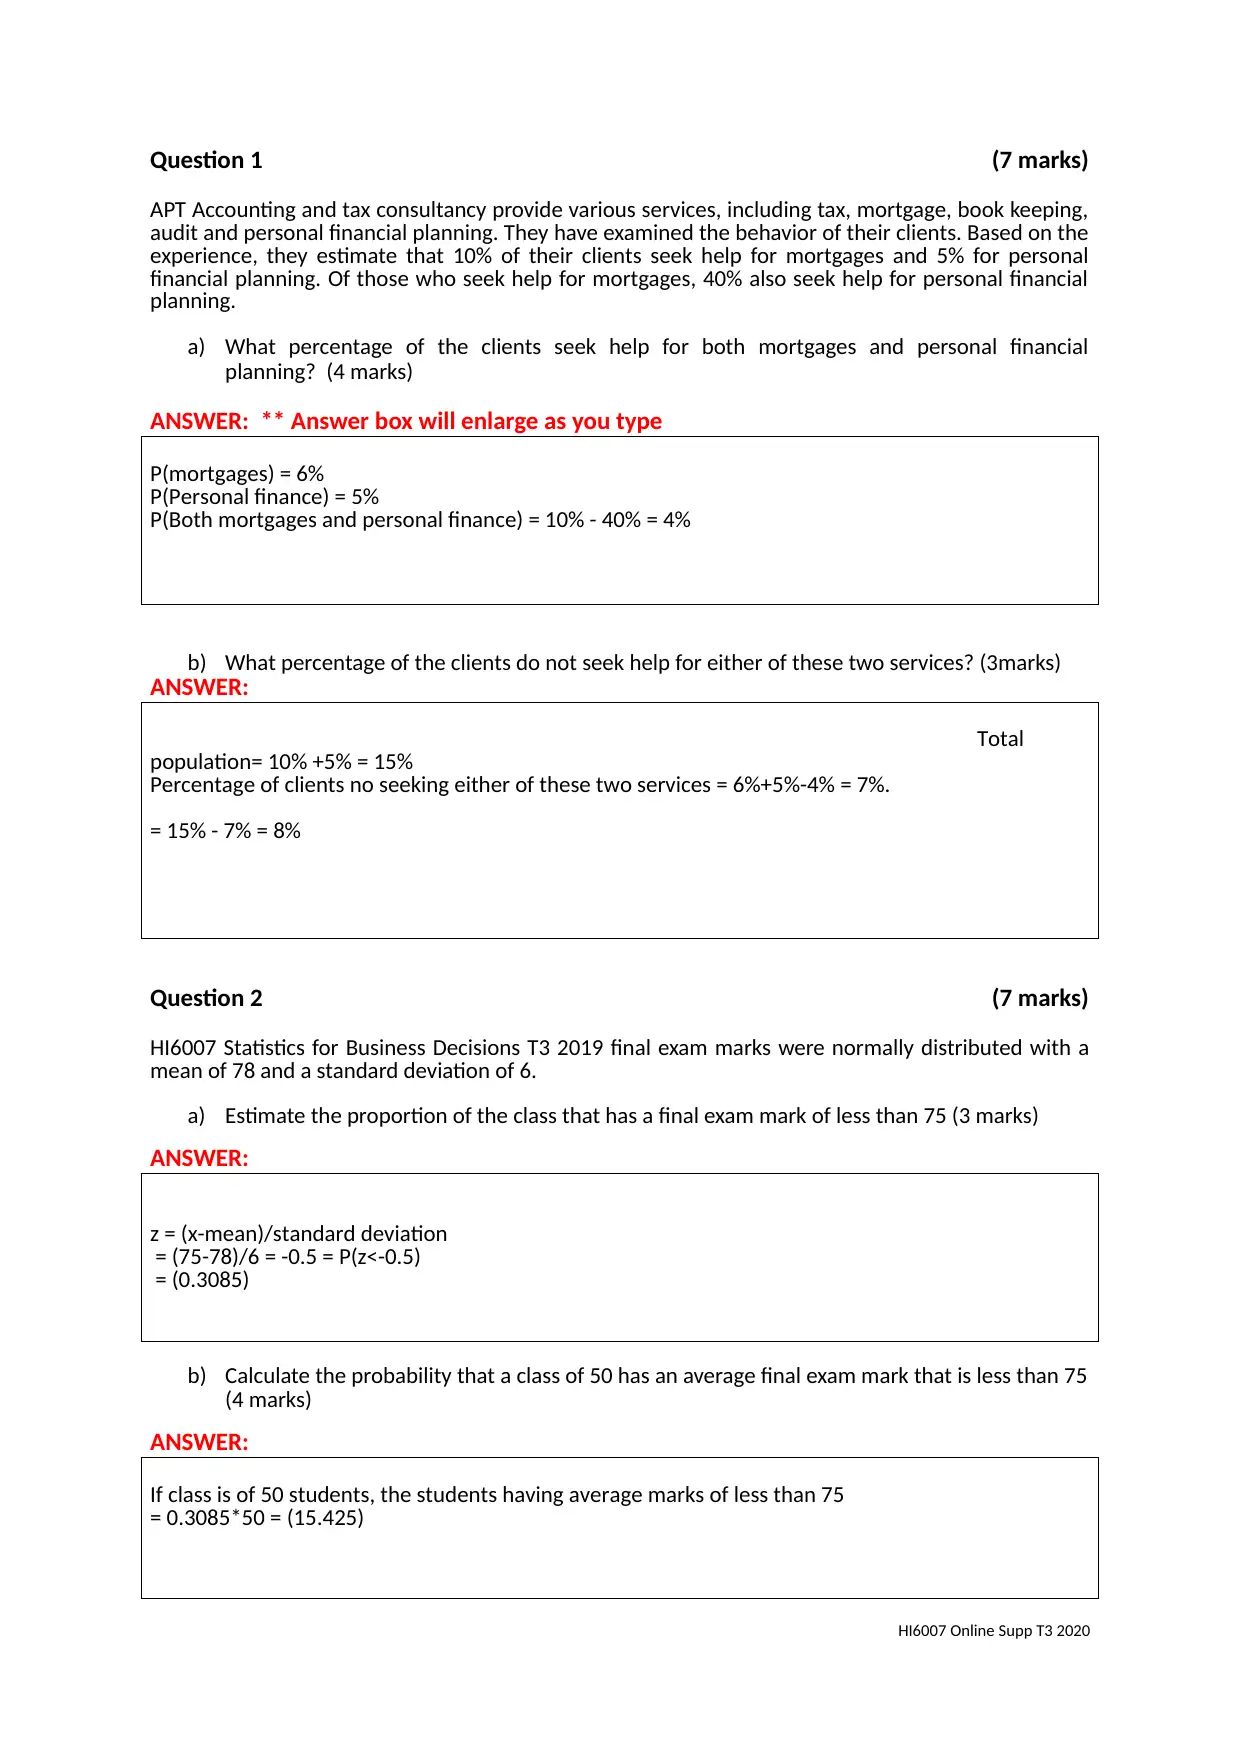
Question 1 (7 marks)
APT Accounting and tax consultancy provide various services, including tax, mortgage, book keeping,
audit and personal financial planning. They have examined the behavior of their clients. Based on the
experience, they estimate that 10% of their clients seek help for mortgages and 5% for personal
financial planning. Of those who seek help for mortgages, 40% also seek help for personal financial
planning.
a) What percentage of the clients seek help for both mortgages and personal financial
planning? (4 marks)
ANSWER: ** Answer box will enlarge as you type
P(mortgages) = 6%
P(Personal finance) = 5%
P(Both mortgages and personal finance) = 10% - 40% = 4%
b) What percentage of the clients do not seek help for either of these two services? (3marks)
ANSWER:
Total
population= 10% +5% = 15%
Percentage of clients no seeking either of these two services = 6%+5%-4% = 7%.
= 15% - 7% = 8%
Question 2 (7 marks)
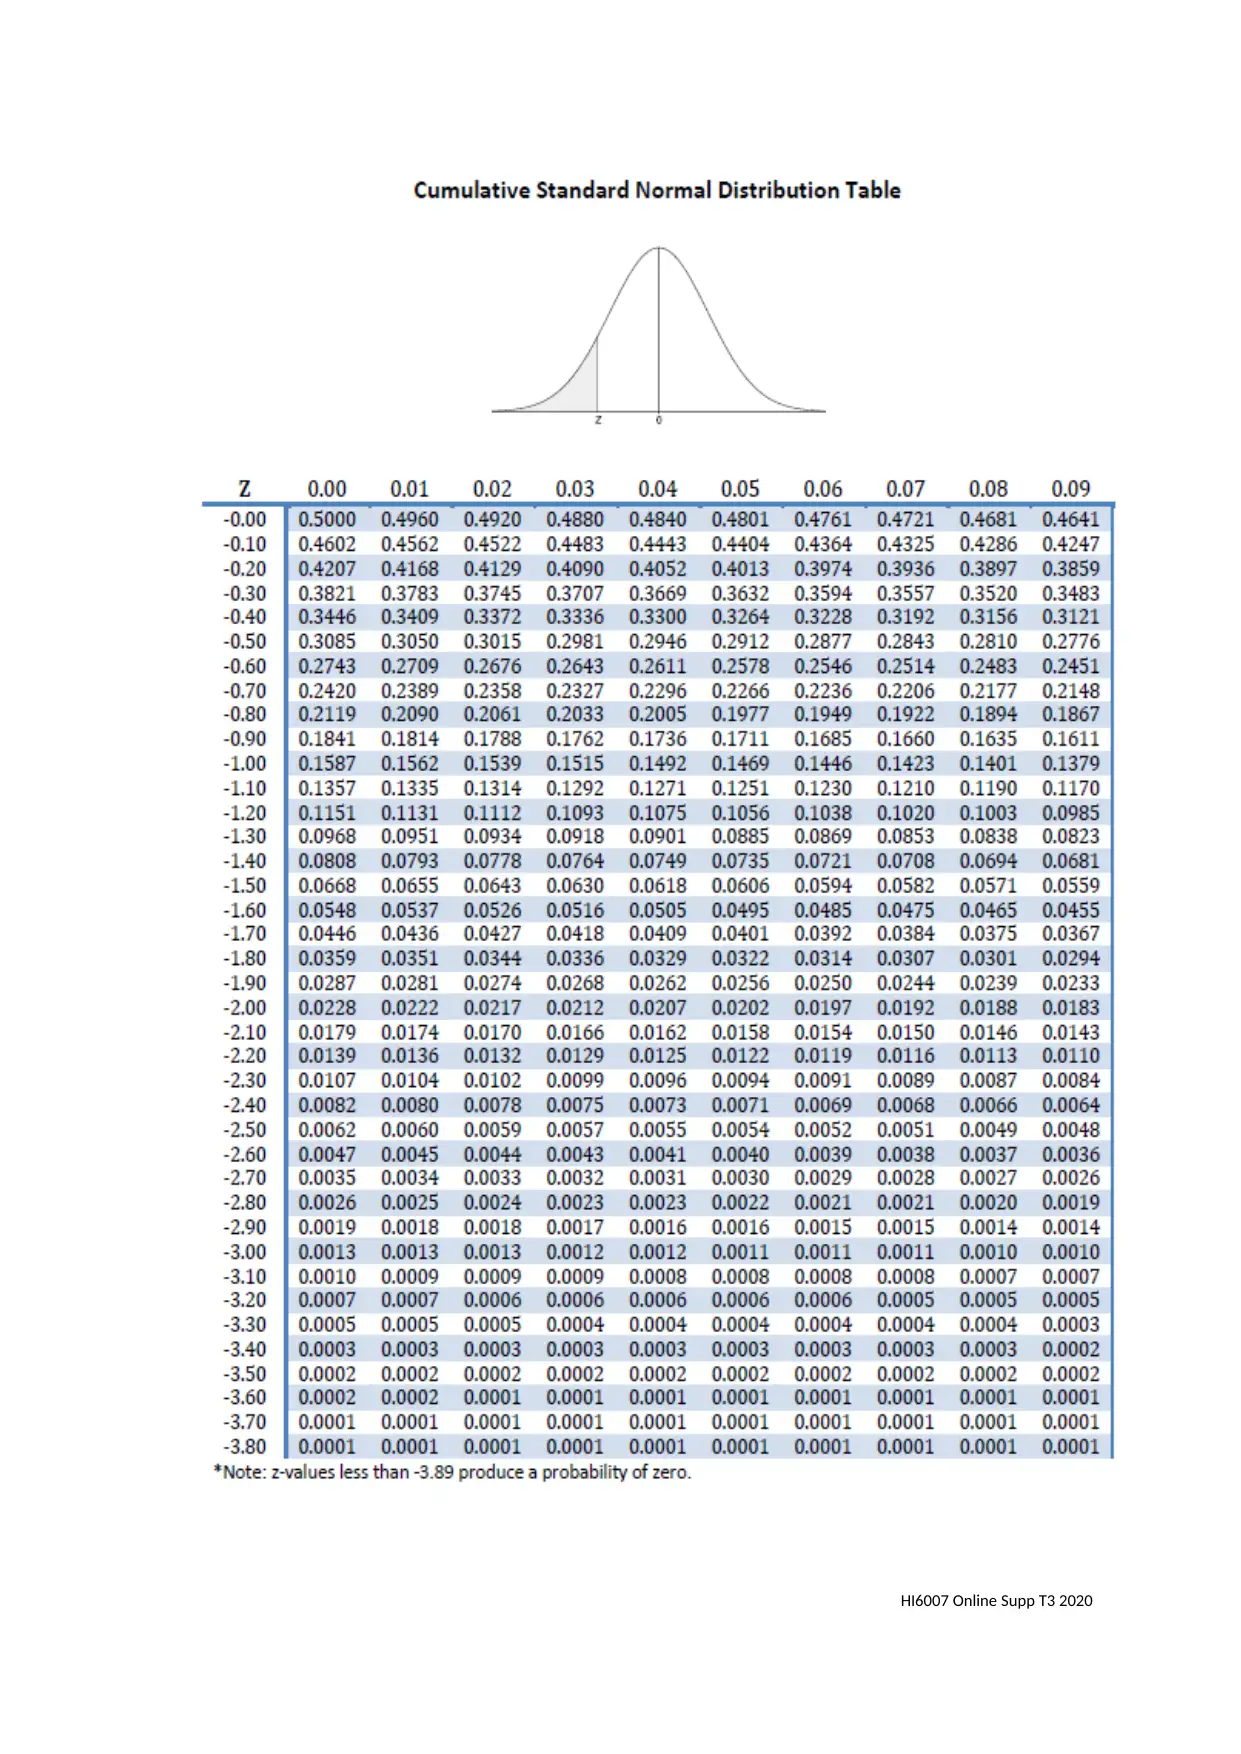
HI6007 Statistics for Business Decisions T3 2019 final exam marks were normally distributed with a
mean of 78 and a standard deviation of 6.
a) Estimate the proportion of the class that has a final exam mark of less than 75 (3 marks)
ANSWER:
z = (x-mean)/standard deviation
= (75-78)/6 = -0.5 = P(z<-0.5)
= (0.3085)
b) Calculate the probability that a class of 50 has an average final exam mark that is less than 75
(4 marks)
ANSWER:
If class is of 50 students, the students having average marks of less than 75
= 0.3085*50 = (15.425)
HI6007 Online Supp T3 2020
APT Accounting and tax consultancy provide various services, including tax, mortgage, book keeping,
audit and personal financial planning. They have examined the behavior of their clients. Based on the
experience, they estimate that 10% of their clients seek help for mortgages and 5% for personal
financial planning. Of those who seek help for mortgages, 40% also seek help for personal financial
planning.
a) What percentage of the clients seek help for both mortgages and personal financial
planning? (4 marks)
ANSWER: ** Answer box will enlarge as you type
P(mortgages) = 6%
P(Personal finance) = 5%
P(Both mortgages and personal finance) = 10% - 40% = 4%
b) What percentage of the clients do not seek help for either of these two services? (3marks)
ANSWER:
Total
population= 10% +5% = 15%
Percentage of clients no seeking either of these two services = 6%+5%-4% = 7%.
= 15% - 7% = 8%
Question 2 (7 marks)
HI6007 Statistics for Business Decisions T3 2019 final exam marks were normally distributed with a
mean of 78 and a standard deviation of 6.
a) Estimate the proportion of the class that has a final exam mark of less than 75 (3 marks)
ANSWER:
z = (x-mean)/standard deviation
= (75-78)/6 = -0.5 = P(z<-0.5)
= (0.3085)
b) Calculate the probability that a class of 50 has an average final exam mark that is less than 75
(4 marks)
ANSWER:
If class is of 50 students, the students having average marks of less than 75
= 0.3085*50 = (15.425)
HI6007 Online Supp T3 2020
⊘ This is a preview!⊘
Do you want full access?
Subscribe today to unlock all pages.
Trusted by 1+ million students worldwide
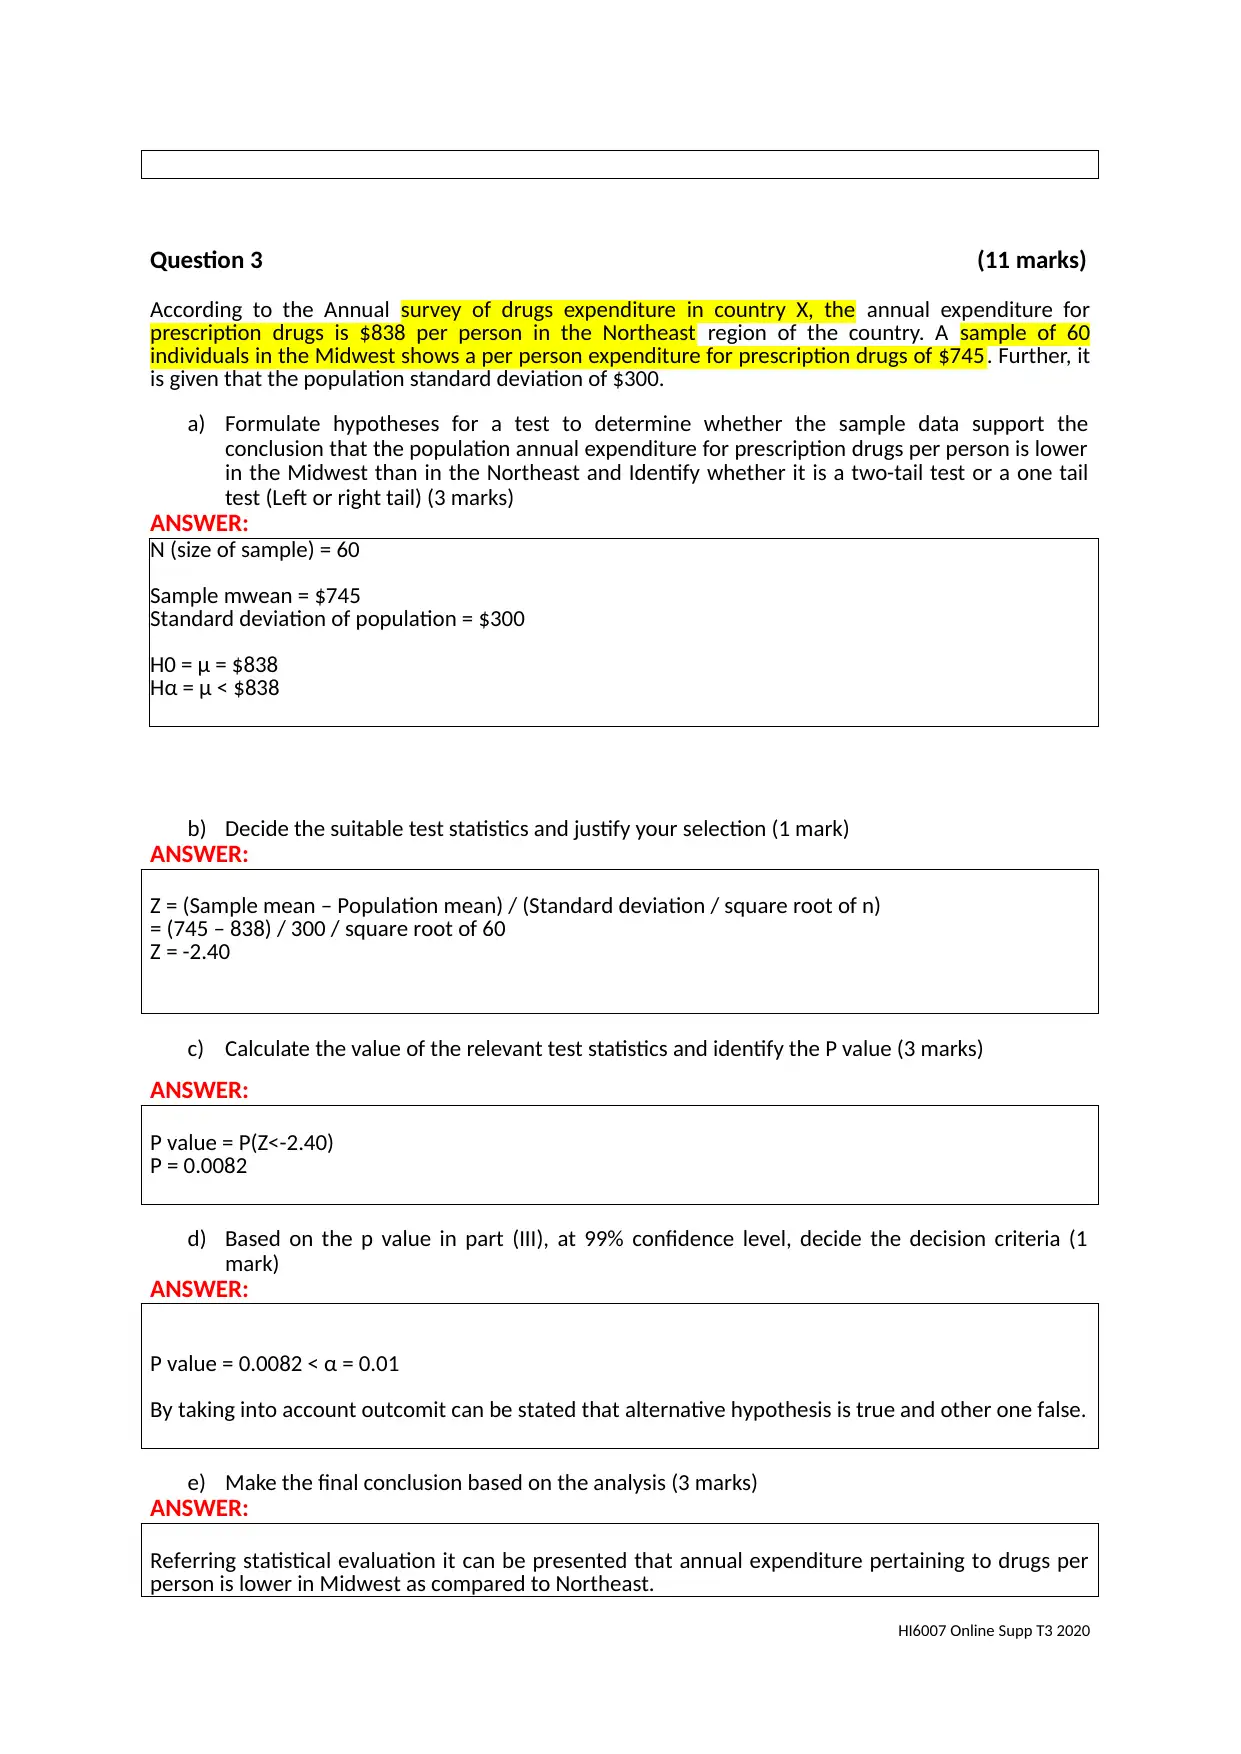
Question 3 (11 marks)
According to the Annual survey of drugs expenditure in country X, the annual expenditure for
prescription drugs is $838 per person in the Northeast region of the country. A sample of 60
individuals in the Midwest shows a per person expenditure for prescription drugs of $745. Further, it
is given that the population standard deviation of $300.
a) Formulate hypotheses for a test to determine whether the sample data support the
conclusion that the population annual expenditure for prescription drugs per person is lower
in the Midwest than in the Northeast and Identify whether it is a two-tail test or a one tail
test (Left or right tail) (3 marks)
ANSWER:
N (size of sample) = 60
Sample mwean = $745
Standard deviation of population = $300
H0 = μ = $838
Hα = μ < $838
b) Decide the suitable test statistics and justify your selection (1 mark)
ANSWER:
Z = (Sample mean – Population mean) / (Standard deviation / square root of n)
= (745 – 838) / 300 / square root of 60
Z = -2.40
c) Calculate the value of the relevant test statistics and identify the P value (3 marks)
ANSWER:
P value = P(Z<-2.40)
P = 0.0082
d) Based on the p value in part (III), at 99% confidence level, decide the decision criteria (1
mark)
ANSWER:
P value = 0.0082 < α = 0.01
By taking into account outcomit can be stated that alternative hypothesis is true and other one false.
e) Make the final conclusion based on the analysis (3 marks)
ANSWER:
Referring statistical evaluation it can be presented that annual expenditure pertaining to drugs per
person is lower in Midwest as compared to Northeast.
HI6007 Online Supp T3 2020
Paraphrase This Document
Need a fresh take? Get an instant paraphrase of this document with our AI Paraphraser
Question 4 (11 marks)
The following is an extract of Single factor ANOVO test statistics to assess whether the three
assembly methods are equal in a factory setting.
Source
of Variation
Sum
of Squares
Degrees
of Freedom
Mean
Square F p-value
Treatments 4560 A C D .0006
Error 6240 B 231.11
Total 10800 29
a) Completing the excel output values from A to D, state the null and alternative hypothesis for
single factor ANOVA and the decision rule you would apply at the 5% significance level.
(6 marks)
ANSWER:
k-1
A. 29-27= 2
B. 6240/231.11 = 27
C. 4560 / 2 = 2280
D. 2280 / 231.11 = 9.86
b) Calculate the test statistic and explain how you will make a decision based on that (5 marks)
ANSWER:
By doing statistical evaluation it has assessed that alternative hypothesis is accepted. According to p
value p<0.05 it can be entailed that there is a significant difference takes place in the three assembly
methods within factory settings.
Question 5 (7 marks)
The following information has been collected on the sales of greeting cards for the past 6 weeks.
Week Sales ($)
1 85
2 90
3 95
4 110
5 105
6 115
a) Develop a linear trend equation that can be used to forecast sales of greeting cards, and
forecast the sales for week 7 (4 marks)
ANSWER:
HI6007 Online Supp T3 2020
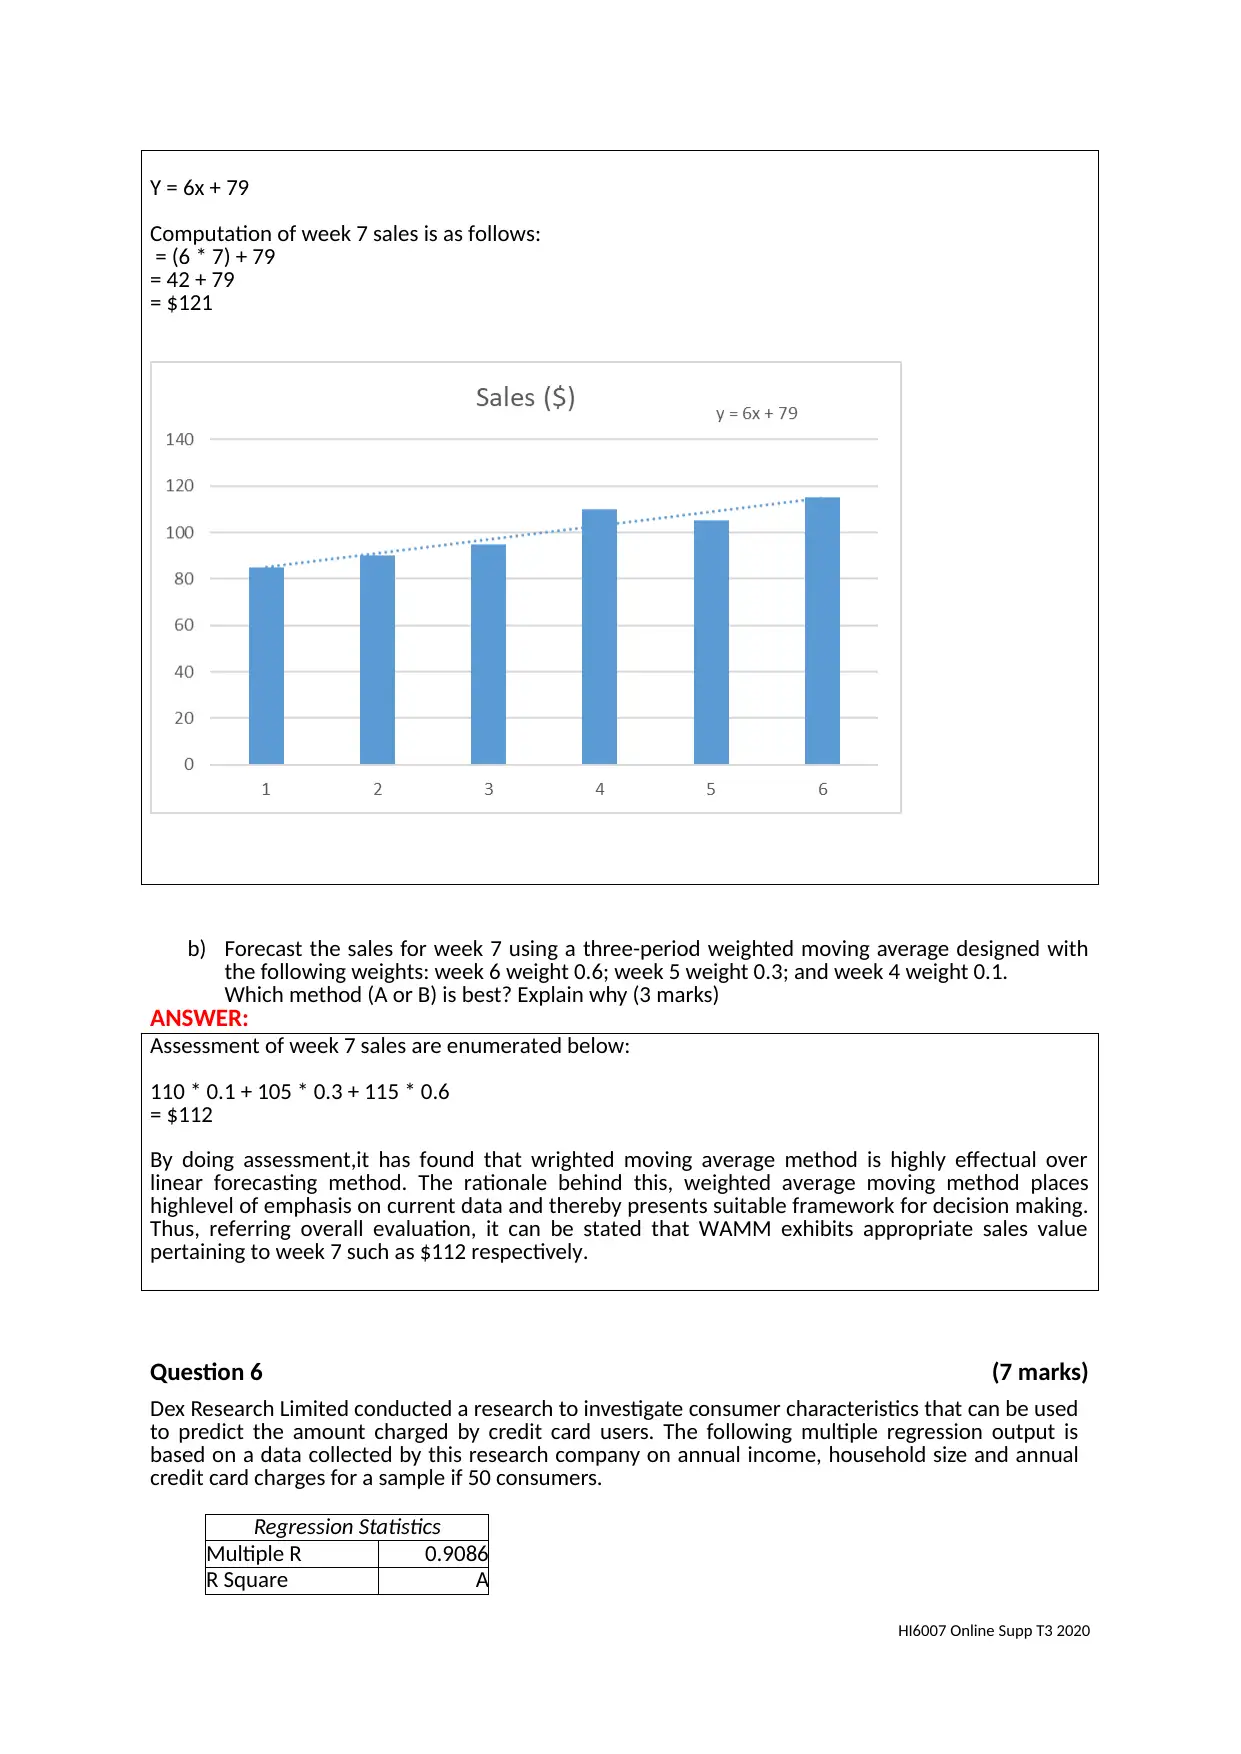
Y = 6x + 79
Computation of week 7 sales is as follows:
= (6 * 7) + 79
= 42 + 79
= $121
b) Forecast the sales for week 7 using a three-period weighted moving average designed with
the following weights: week 6 weight 0.6; week 5 weight 0.3; and week 4 weight 0.1.
Which method (A or B) is best? Explain why (3 marks)
ANSWER:
Assessment of week 7 sales are enumerated below:
110 * 0.1 + 105 * 0.3 + 115 * 0.6
= $112
By doing assessment,it has found that wrighted moving average method is highly effectual over
linear forecasting method. The rationale behind this, weighted average moving method places
highlevel of emphasis on current data and thereby presents suitable framework for decision making.
Thus, referring overall evaluation, it can be stated that WAMM exhibits appropriate sales value
pertaining to week 7 such as $112 respectively.
Question 6 (7 marks)
Dex Research Limited conducted a research to investigate consumer characteristics that can be used
to predict the amount charged by credit card users. The following multiple regression output is
based on a data collected by this research company on annual income, household size and annual
credit card charges for a sample if 50 consumers.
Regression Statistics
Multiple R 0.9086
R Square A
HI6007 Online Supp T3 2020
⊘ This is a preview!⊘
Do you want full access?
Subscribe today to unlock all pages.
Trusted by 1+ million students worldwide
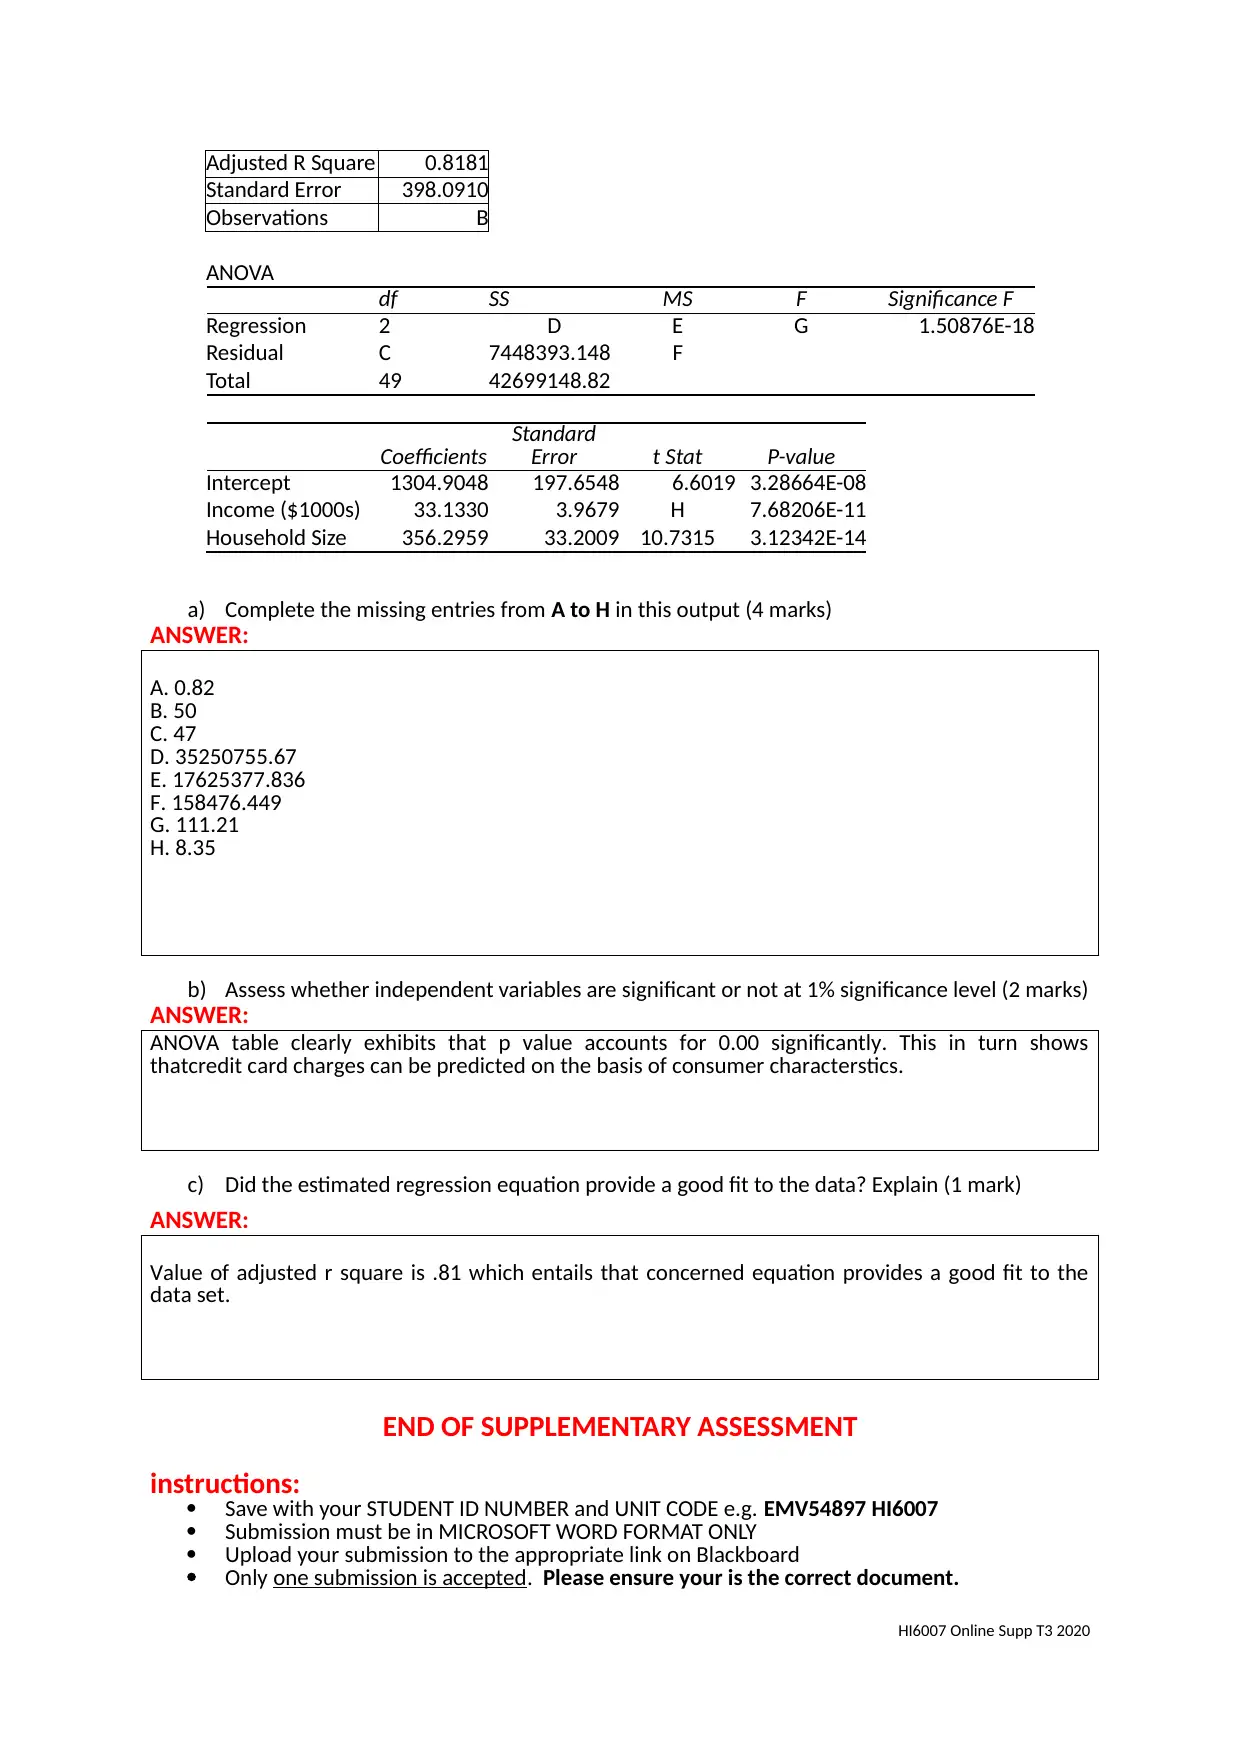
Adjusted R Square 0.8181
Standard Error 398.0910
Observations B
ANOVA
df SS MS F Significance F
Regression 2 D E G 1.50876E-18
Residual C 7448393.148 F
Total 49 42699148.82
Coefficients Standard
Error t Stat P-value
Intercept 1304.9048 197.6548 6.6019 3.28664E-08
Income ($1000s) 33.1330 3.9679 H 7.68206E-11
Household Size 356.2959 33.2009 10.7315 3.12342E-14
a) Complete the missing entries from A to H in this output (4 marks)
ANSWER:
A. 0.82
B. 50
C. 47
D. 35250755.67
E. 17625377.836
F. 158476.449
G. 111.21
H. 8.35
b) Assess whether independent variables are significant or not at 1% significance level (2 marks)
ANSWER:
ANOVA table clearly exhibits that p value accounts for 0.00 significantly. This in turn shows
thatcredit card charges can be predicted on the basis of consumer characterstics.
c) Did the estimated regression equation provide a good fit to the data? Explain (1 mark)
ANSWER:
Value of adjusted r square is .81 which entails that concerned equation provides a good fit to the
data set.
END OF SUPPLEMENTARY ASSESSMENT
instructions:
Save with your STUDENT ID NUMBER and UNIT CODE e.g. EMV54897 HI6007
Submission must be in MICROSOFT WORD FORMAT ONLY
Upload your submission to the appropriate link on Blackboard
Only one submission is accepted. Please ensure your is the correct document.
HI6007 Online Supp T3 2020
Paraphrase This Document
Need a fresh take? Get an instant paraphrase of this document with our AI Paraphraser

All submissions are automatically passed through SafeAssign to assess academic integrity.
HI6007 Online Supp T3 2020
HI6007 Online Supp T3 2020
FORMULA SHEET
K = 1 + 3.3 log10 n
Summary Measures (n – sample size; N – Population size)
Or
Or
Or
Location of the pth percentile:
IQR = Q3 – Q1
Expected value of a discrete random variable
Variance of a discrete random variable
Z and t formulas:
Confidence intervals
Mean:
Proportion:
HI6007 Online Supp T3 2020
K = 1 + 3.3 log10 n
Summary Measures (n – sample size; N – Population size)
Or
Or
Or
Location of the pth percentile:
IQR = Q3 – Q1
Expected value of a discrete random variable
Variance of a discrete random variable
Z and t formulas:
Confidence intervals
Mean:
Proportion:
HI6007 Online Supp T3 2020
⊘ This is a preview!⊘
Do you want full access?
Subscribe today to unlock all pages.
Trusted by 1+ million students worldwide
Time Series Regression
ANOVA:
Simple Linear Regression:
SSE = SST =
SSR=
Coefficient of determination
Correlation coefficient
or
R2
Testing for Significance
Confidence Interval for β1
HI6007 Online Supp T3 2020
F = MSTR / MSE
SST = SSR + SSE
R2= SSR/SST
s 2 = MSE = SSE/(
n 2)
s = F = MSTR / MSE
MSR = SSR/k-1 MSE = SSE/n-k
Paraphrase This Document
Need a fresh take? Get an instant paraphrase of this document with our AI Paraphraser

Multiple Regression:
HI6007 Online Supp T3 2020
y =
0 +
1x1 +
2x2 + . . . +
pxp +
= b0 + b1x1 + b2x2 + . . . + bpxp
R2 = SSR/SST
HI6007 Online Supp T3 2020
y =
0 +
1x1 +
2x2 + . . . +
pxp +
= b0 + b1x1 + b2x2 + . . . + bpxp
R2 = SSR/SST
HI6007 Online Supp T3 2020
⊘ This is a preview!⊘
Do you want full access?
Subscribe today to unlock all pages.
Trusted by 1+ million students worldwide
1 out of 19
Your All-in-One AI-Powered Toolkit for Academic Success.
+13062052269
info@desklib.com
Available 24*7 on WhatsApp / Email
![[object Object]](/_next/static/media/star-bottom.7253800d.svg)
Unlock your academic potential
Copyright © 2020–2026 A2Z Services. All Rights Reserved. Developed and managed by ZUCOL.