HI6007: Statistics for Business Decisions Group Assignment T3 2019
VerifiedAdded on 2022/08/18
|13
|1104
|13
Homework Assignment
AI Summary
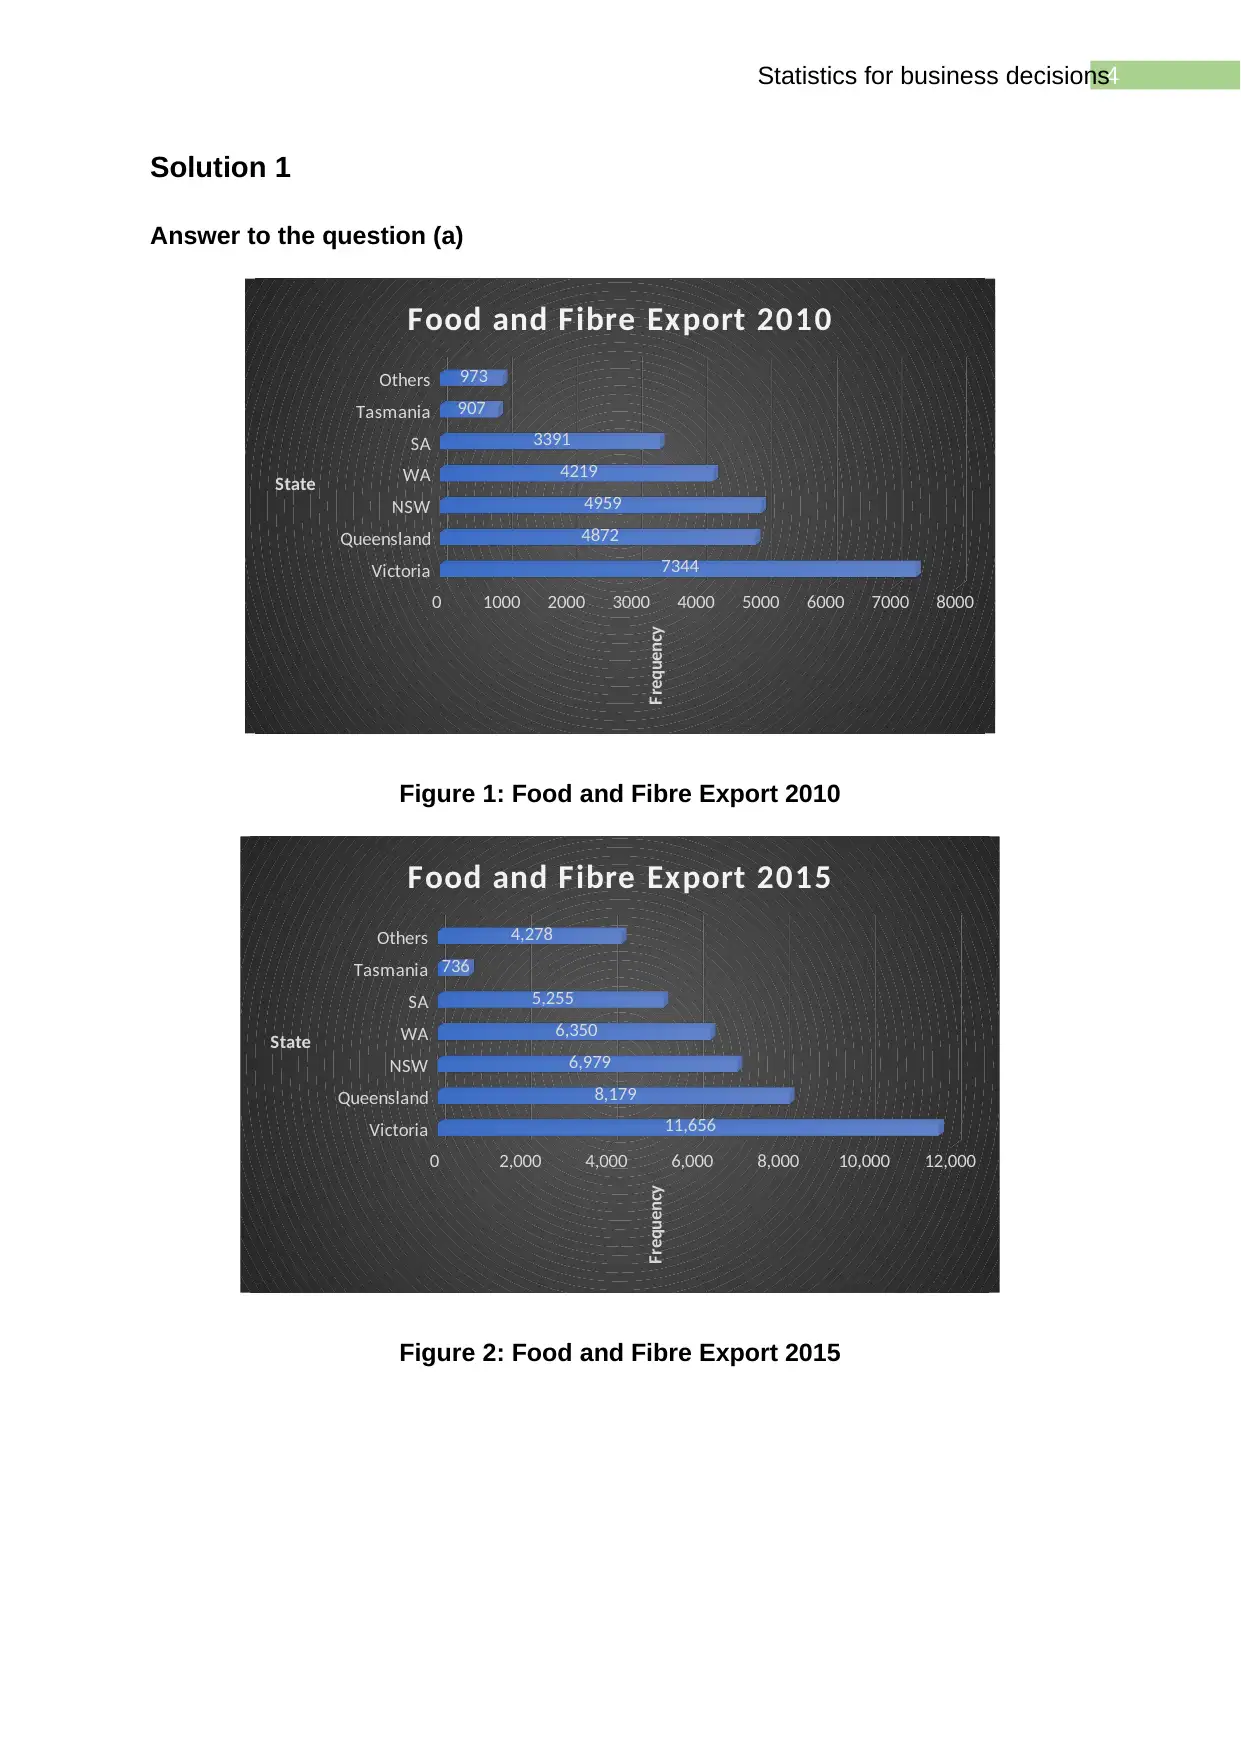
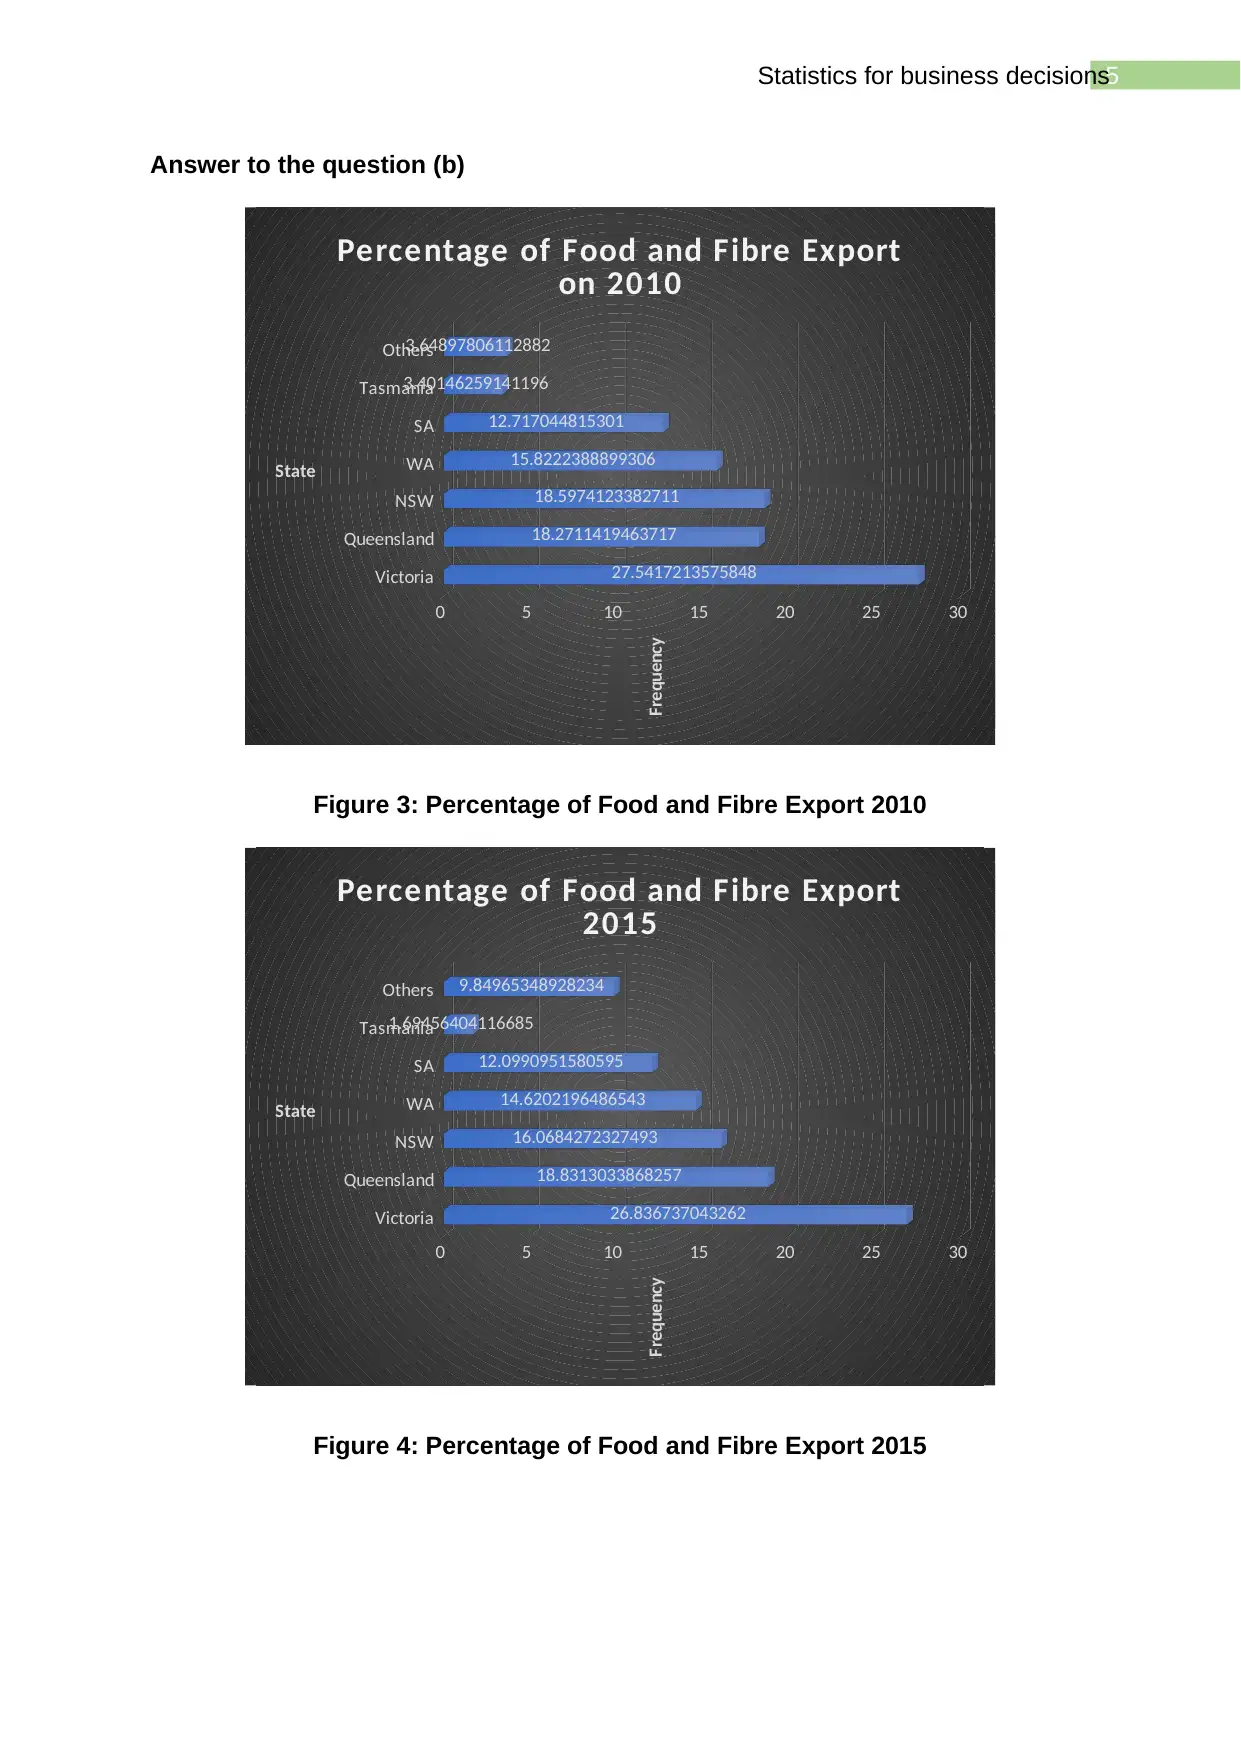
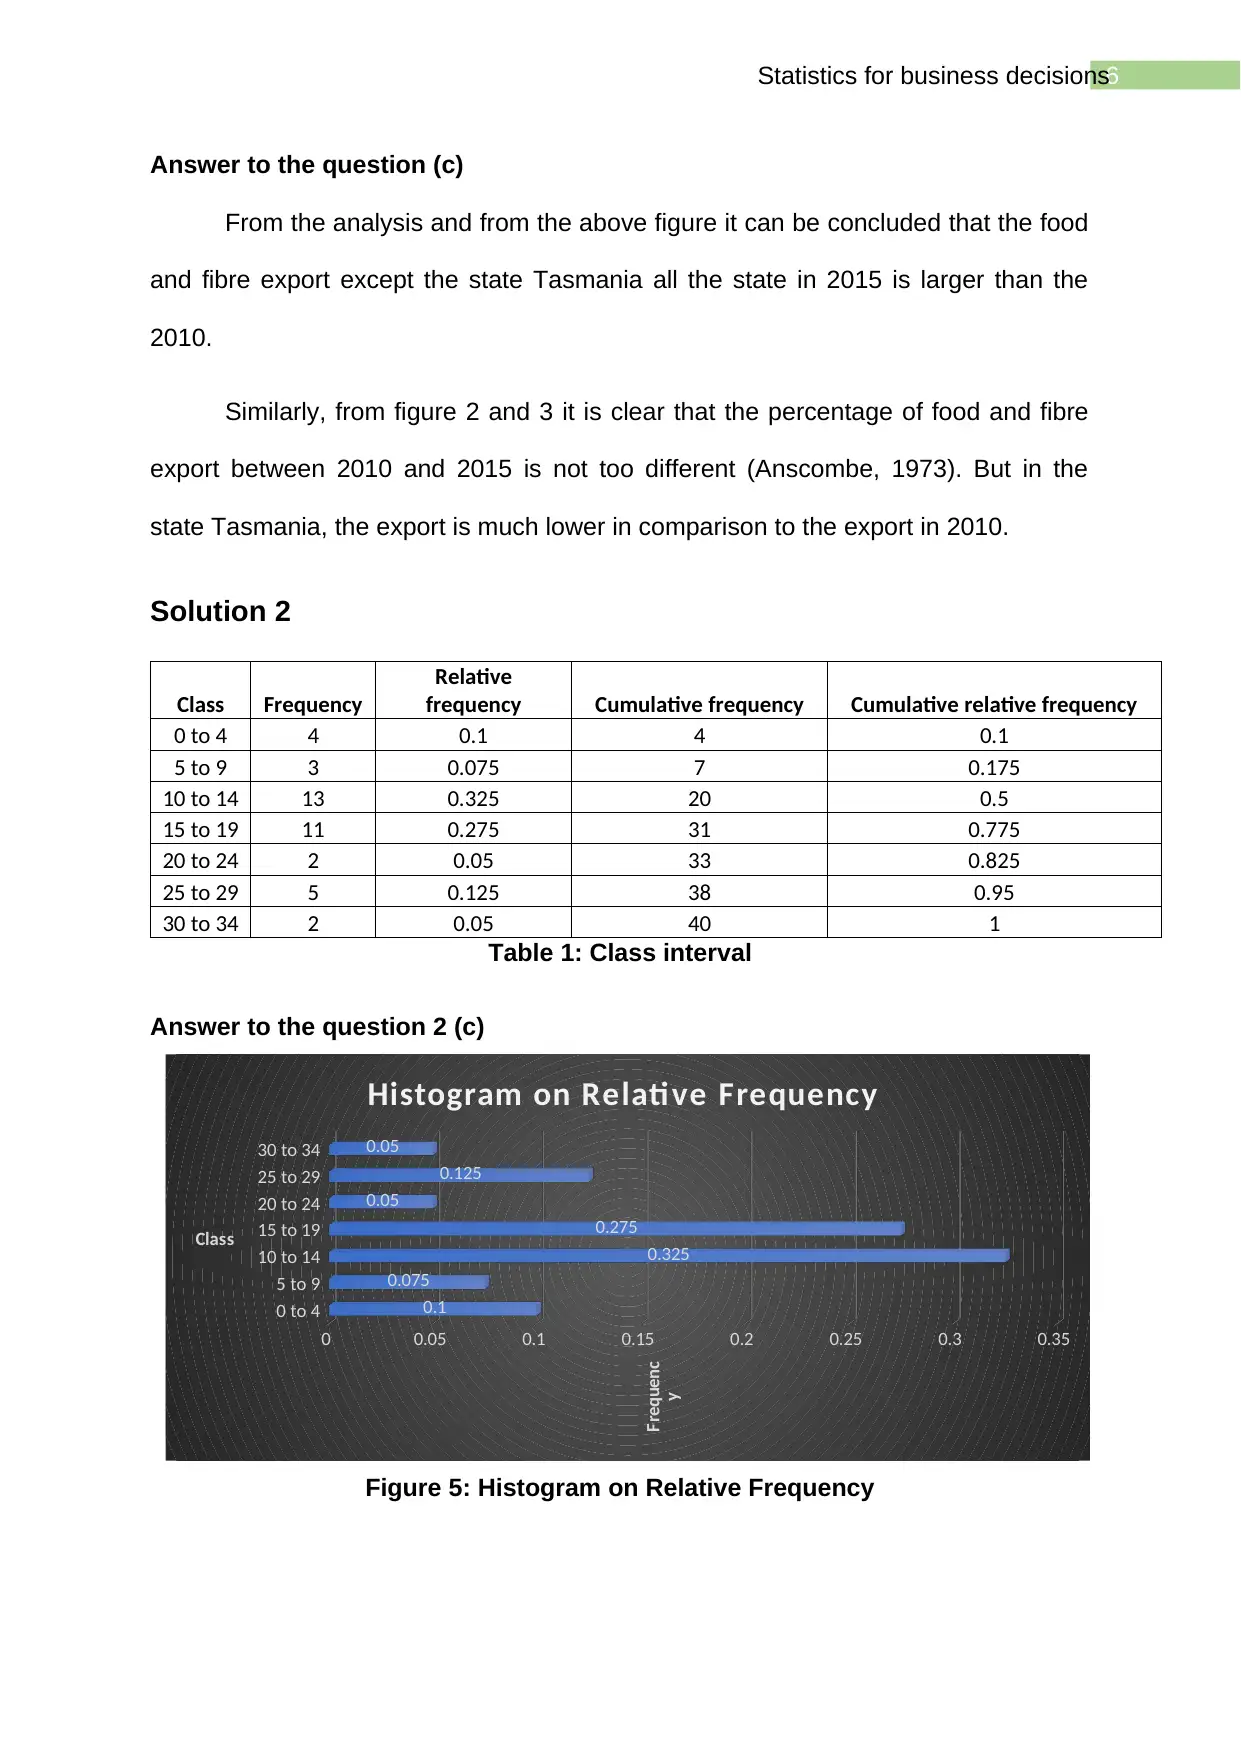
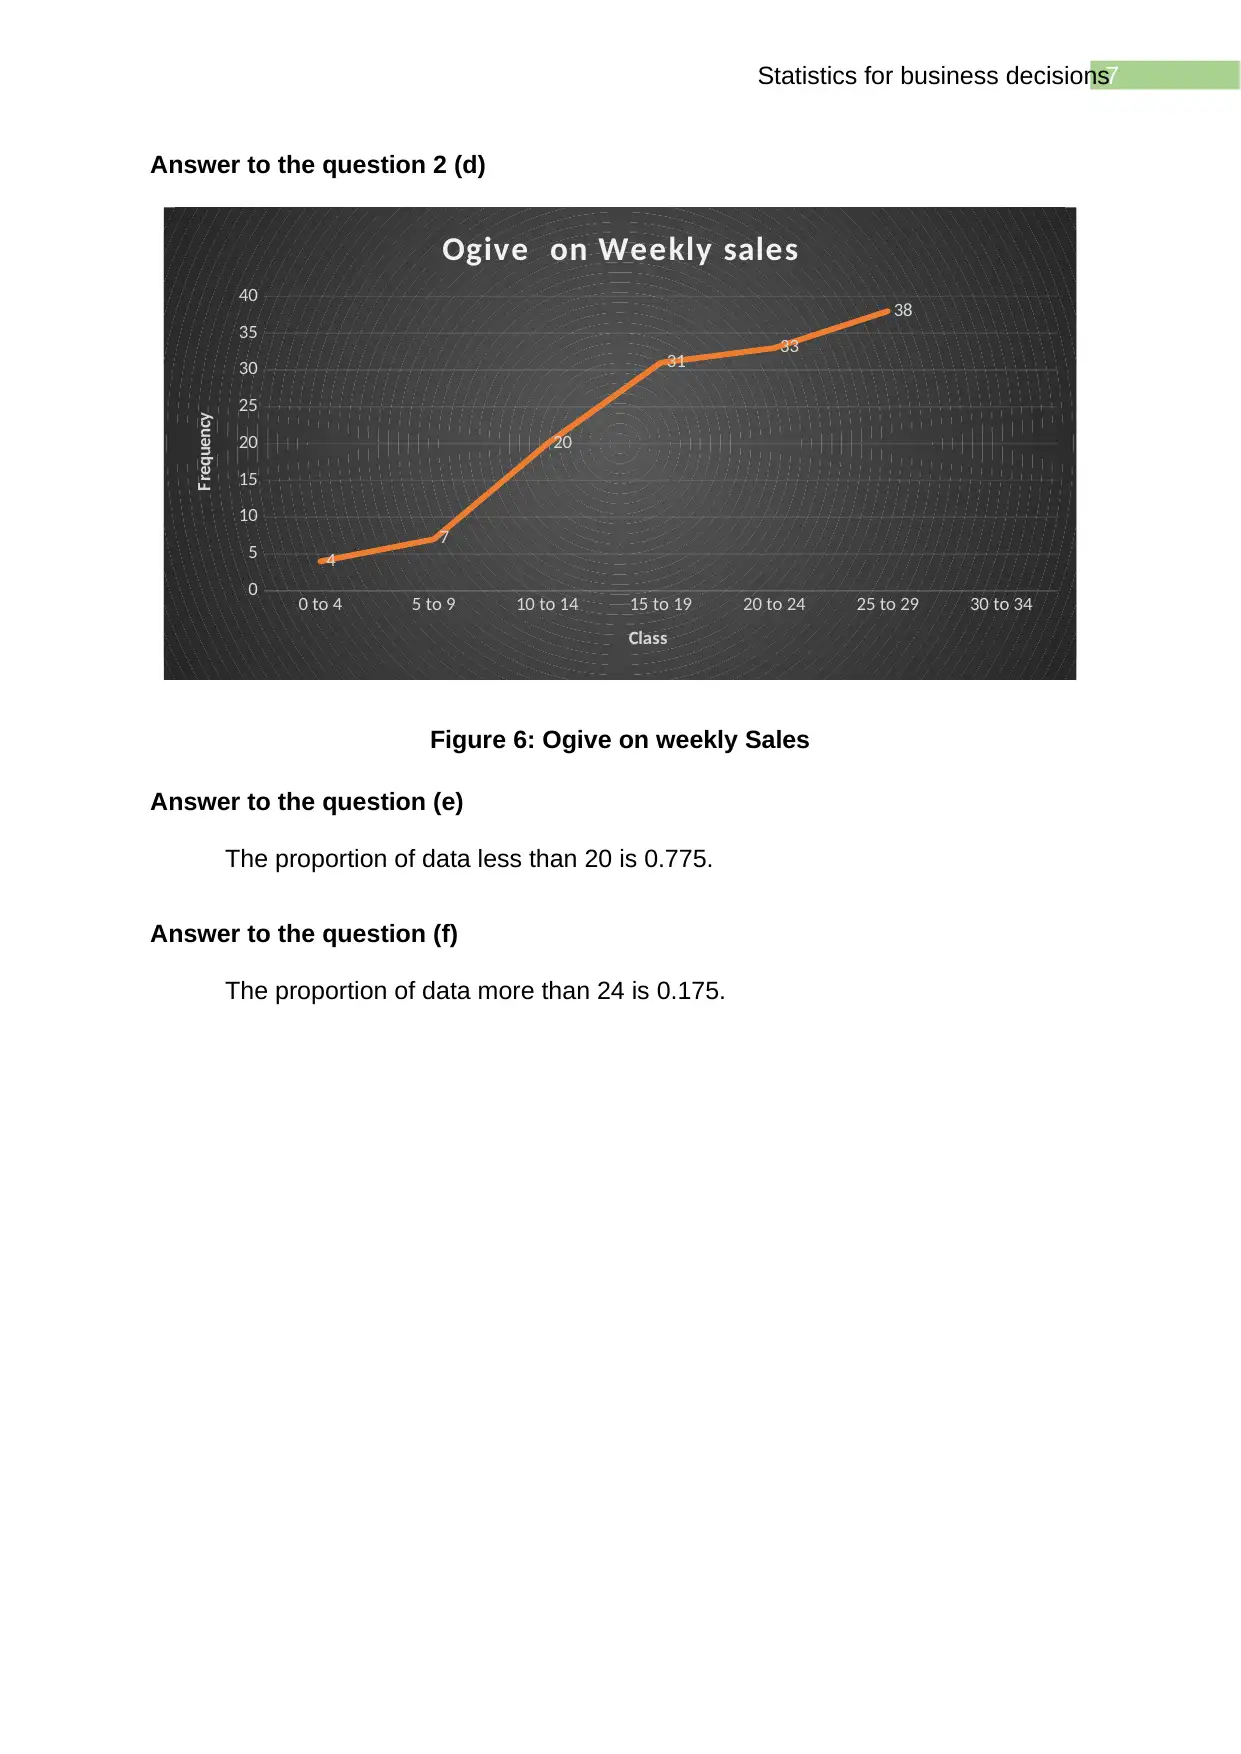
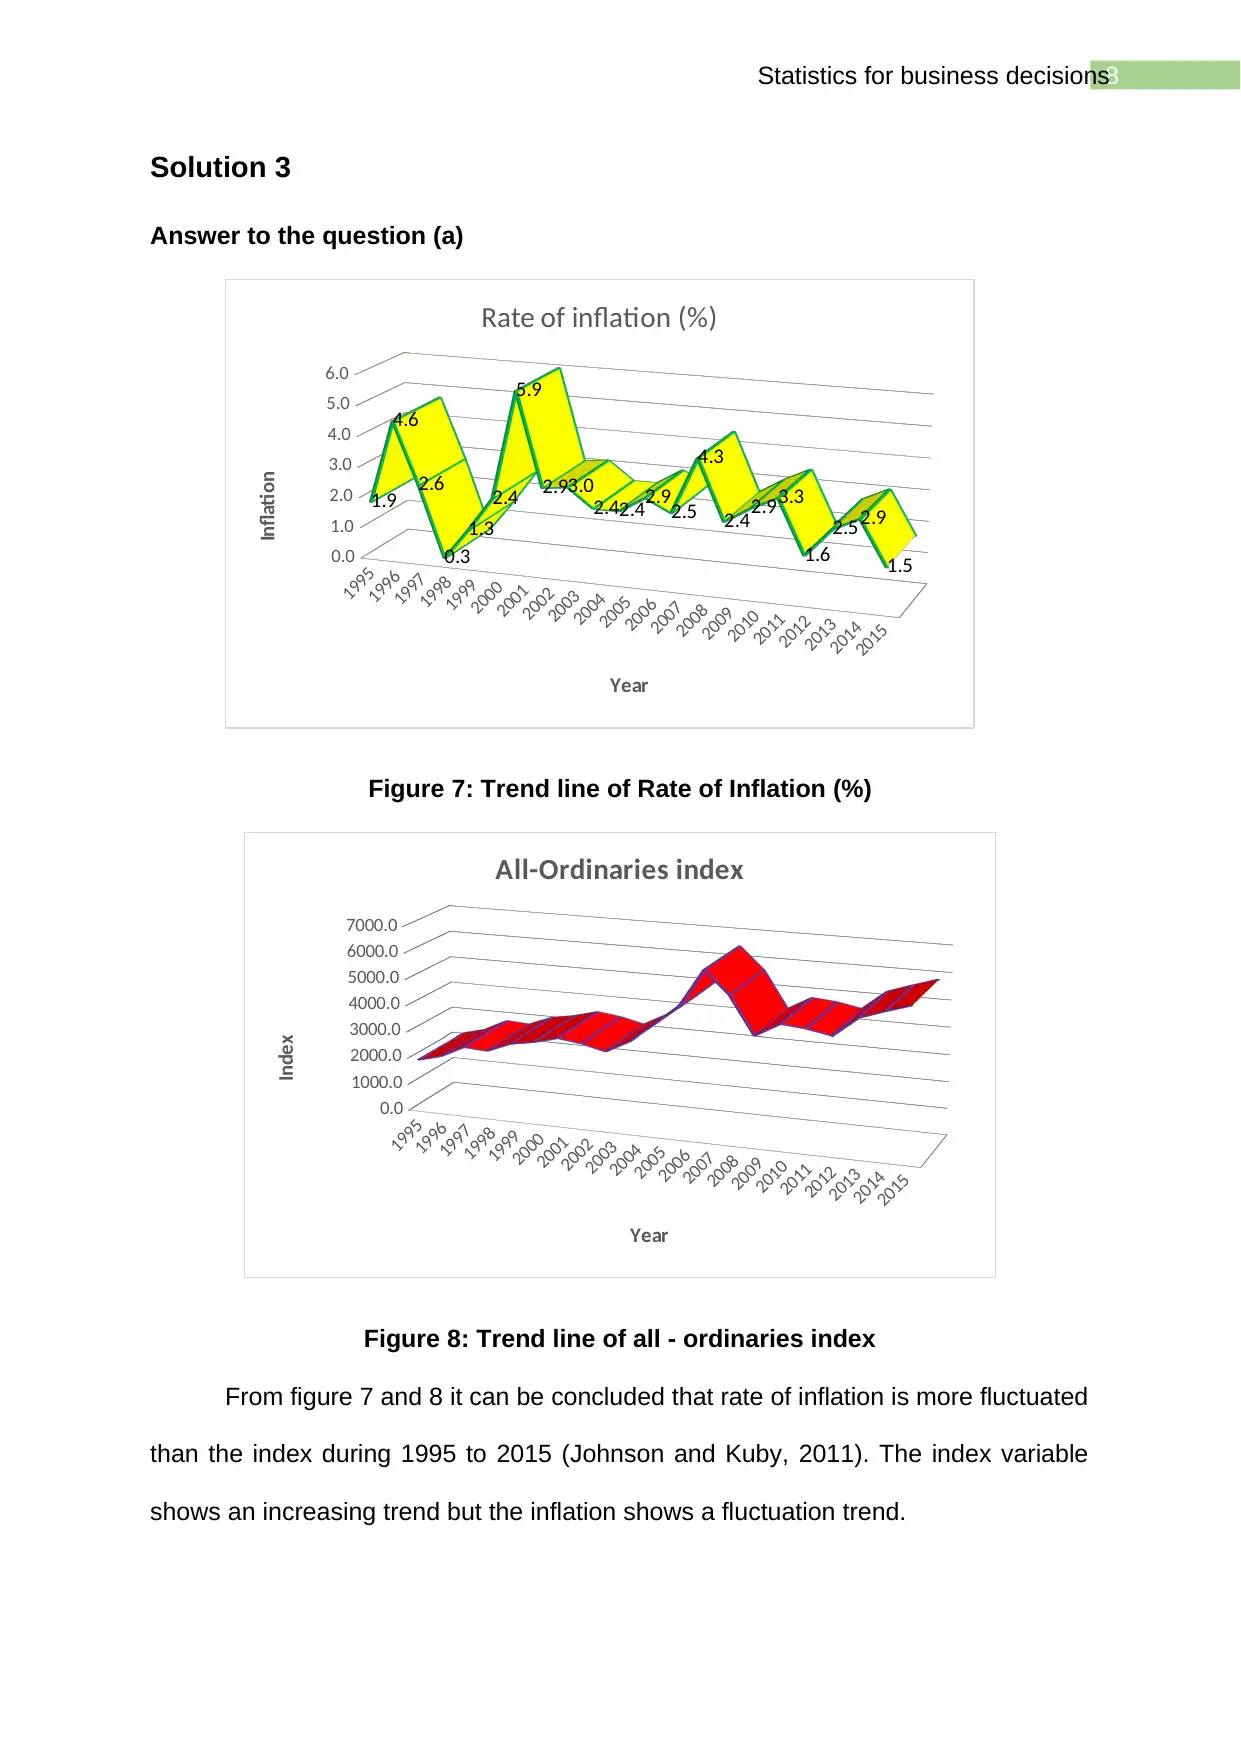
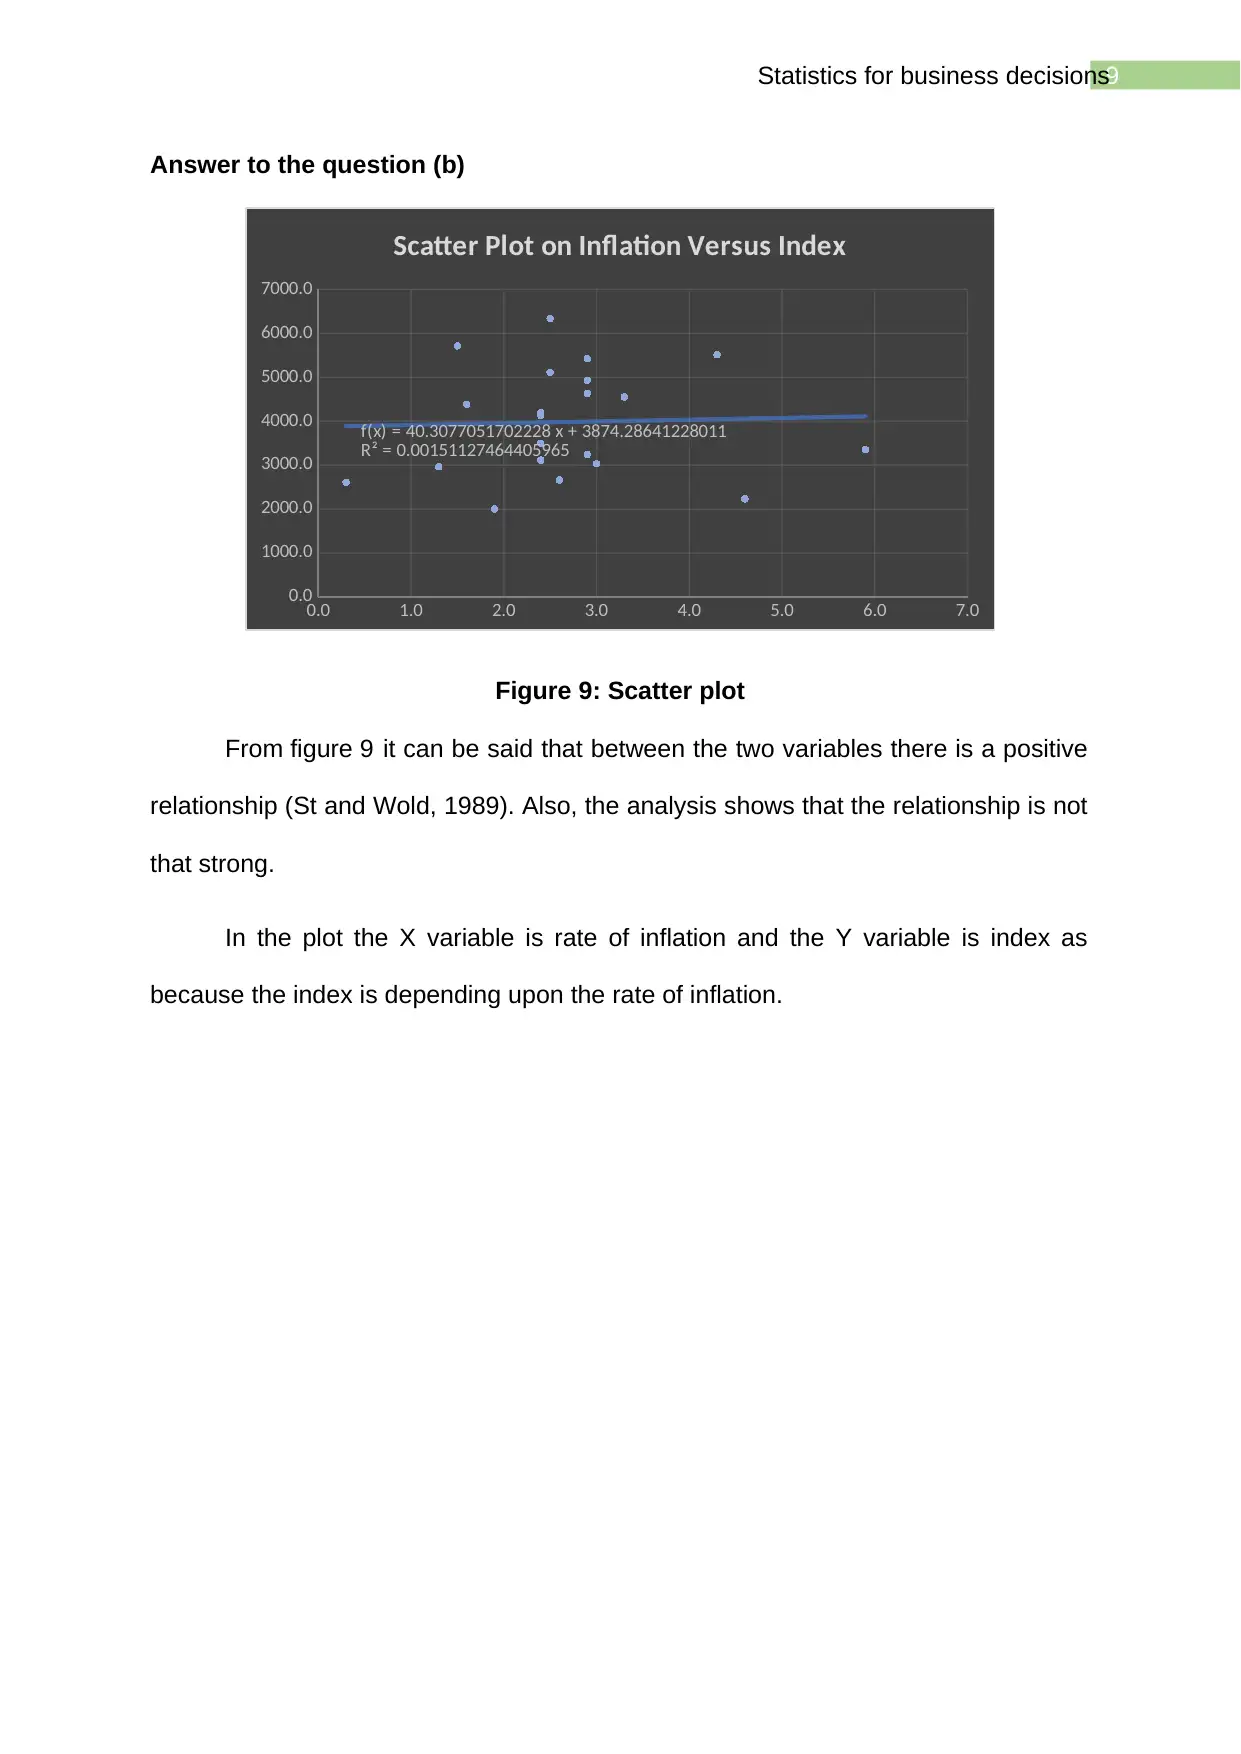
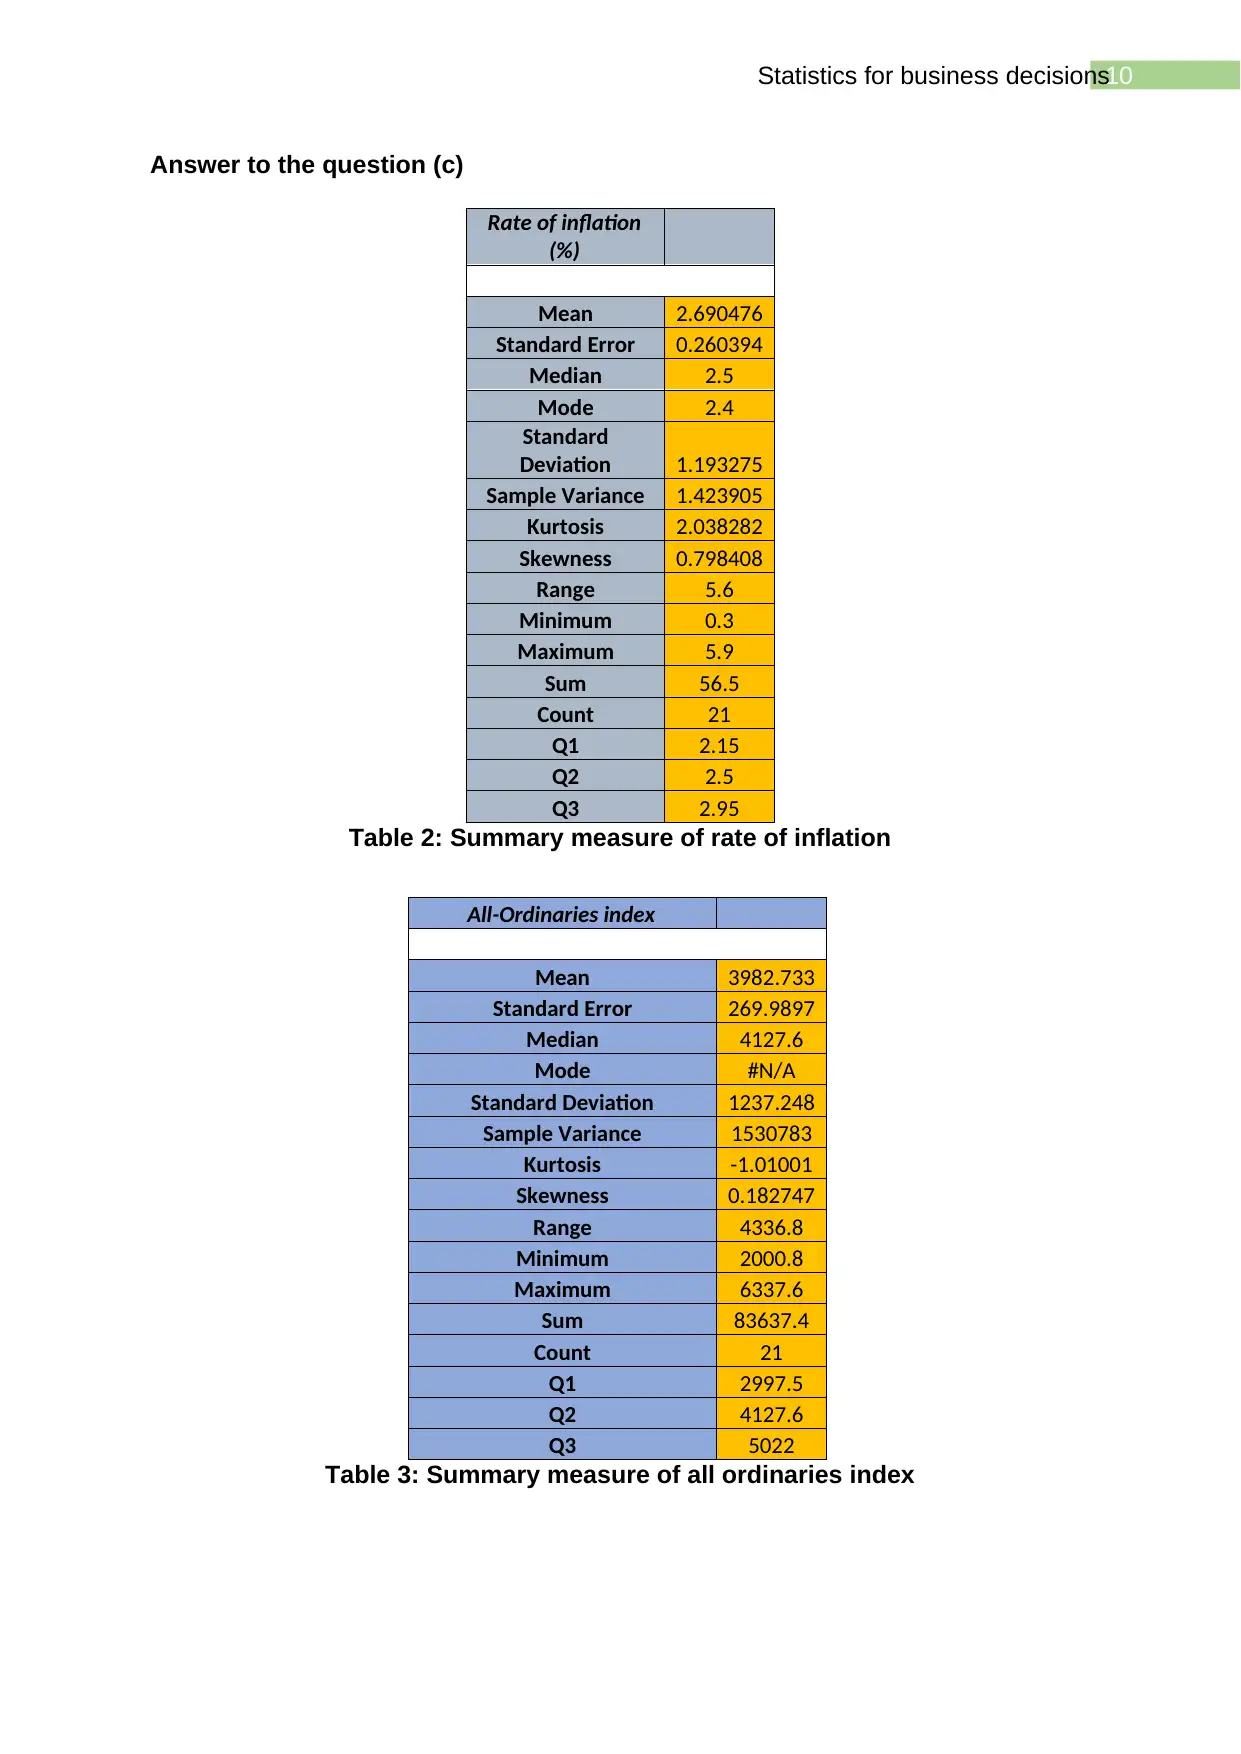
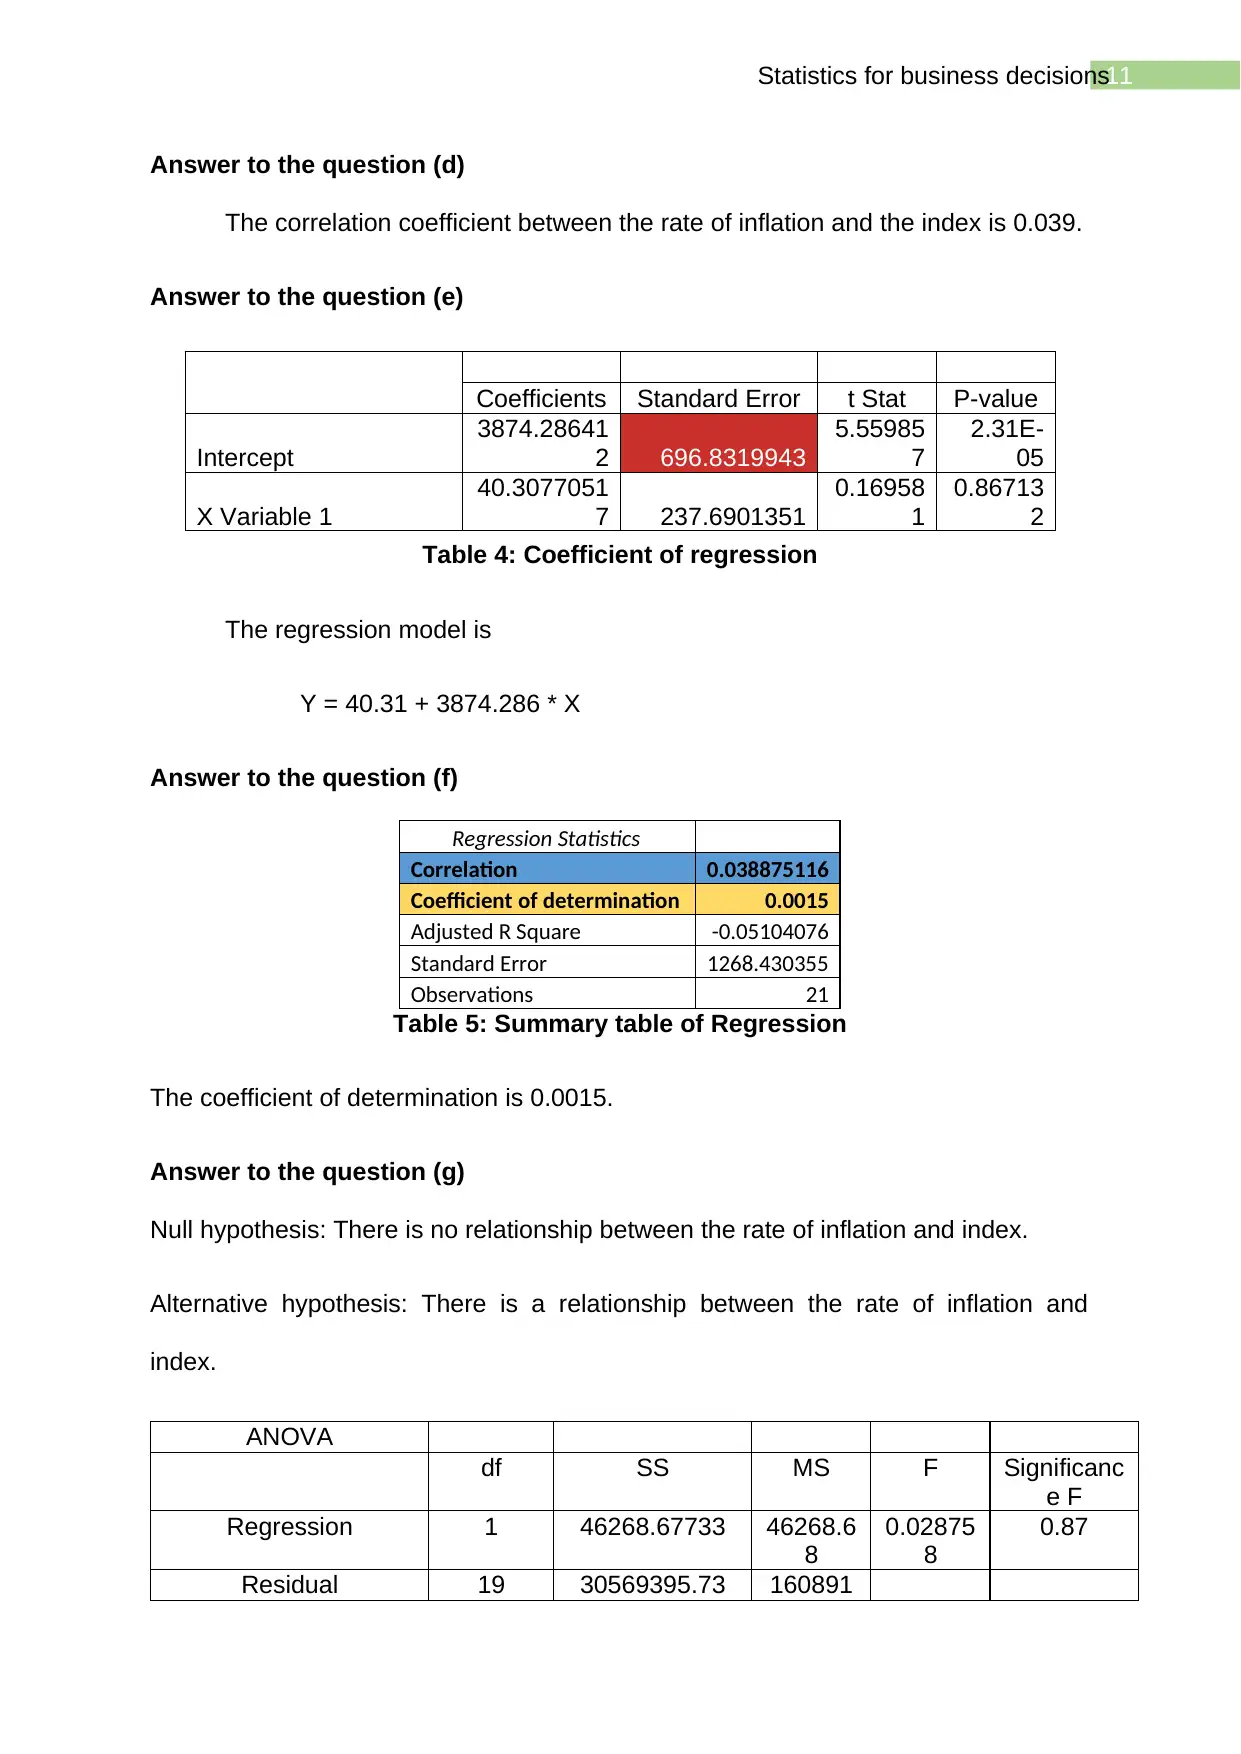
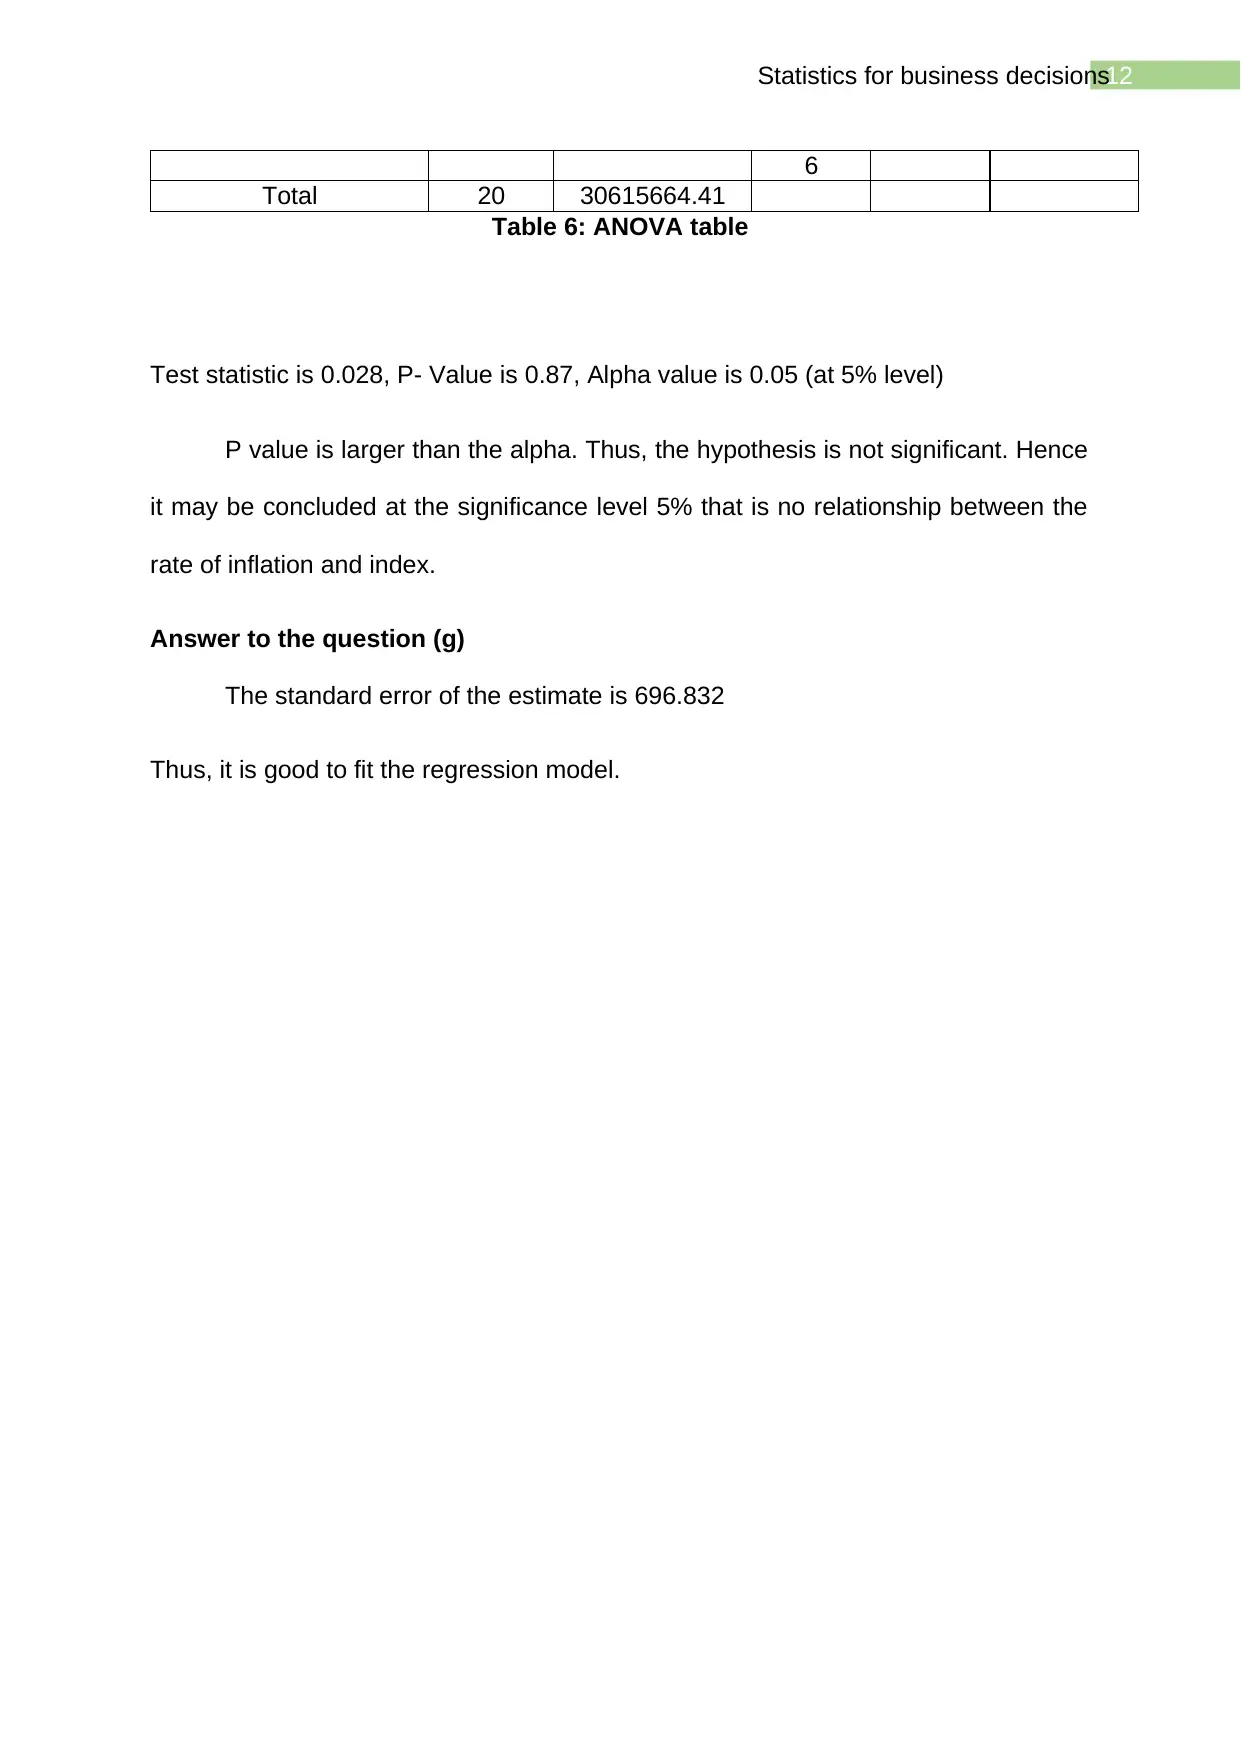
This assignment solution addresses statistical concepts relevant to business decision-making. It includes an analysis of food and fiber export data, exploring trends and percentages. The solution also covers descriptive statistics, such as frequency distributions, histograms, and ogives, using a dataset on weekly sales. Further analysis involves regression models, correlation coefficients, and hypothesis testing, examining the relationship between inflation rates and an all-ordinaries index. The assignment demonstrates the application of statistical techniques to interpret data, draw conclusions, and make informed business decisions. Tables, figures, and calculations are provided to support the analysis, along with references to relevant statistical literature.
1 out of 13
Related Documents


Your All-in-One AI-Powered Toolkit for Academic Success.
+13062052269
info@desklib.com
Available 24*7 on WhatsApp / Email
![[object Object]](/_next/static/media/star-bottom.7253800d.svg)
Copyright © 2020–2026 A2Z Services. All Rights Reserved. Developed and managed by ZUCOL.