Analysis of Statistics for Business and Finance - Assignment

Verified

Added on  2019/10/31

|12
|1433
|146
Homework Assignment
AI Summary
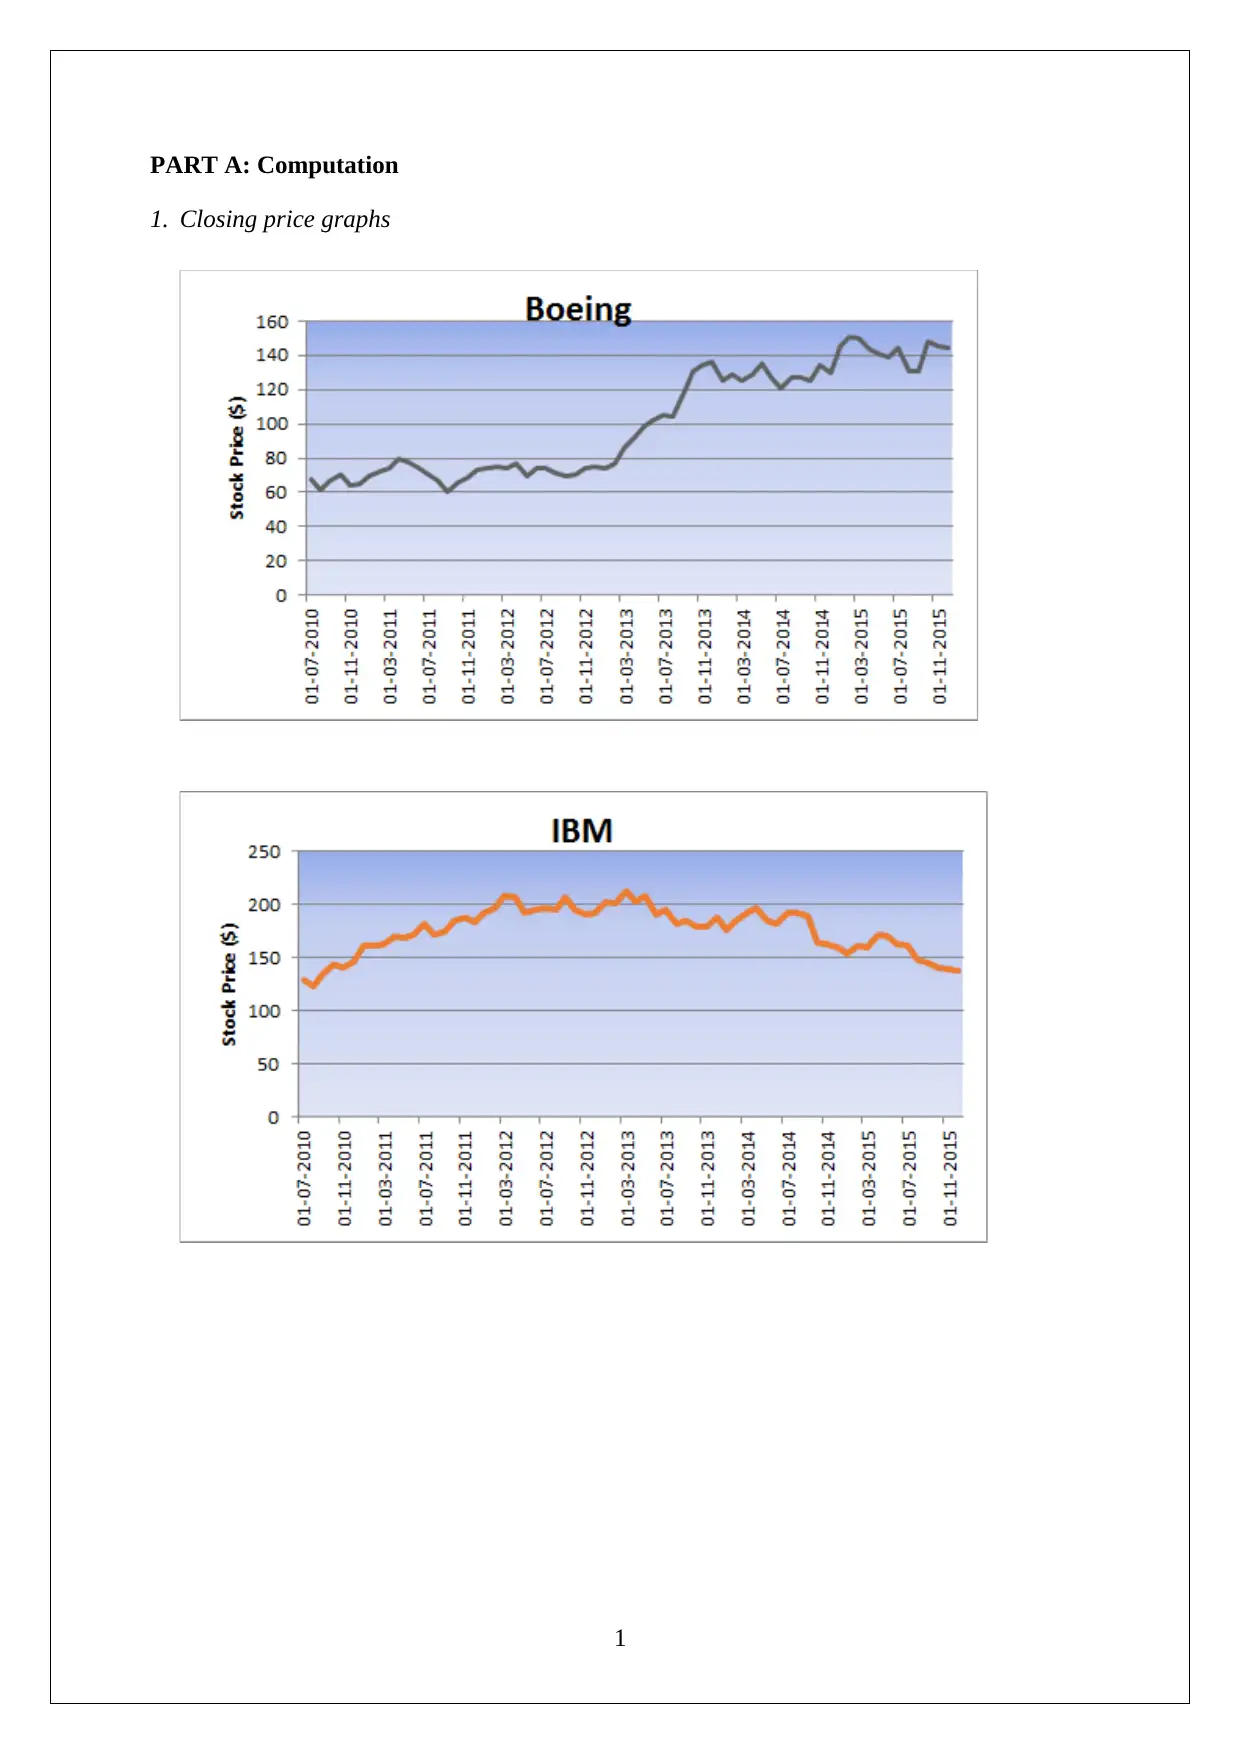
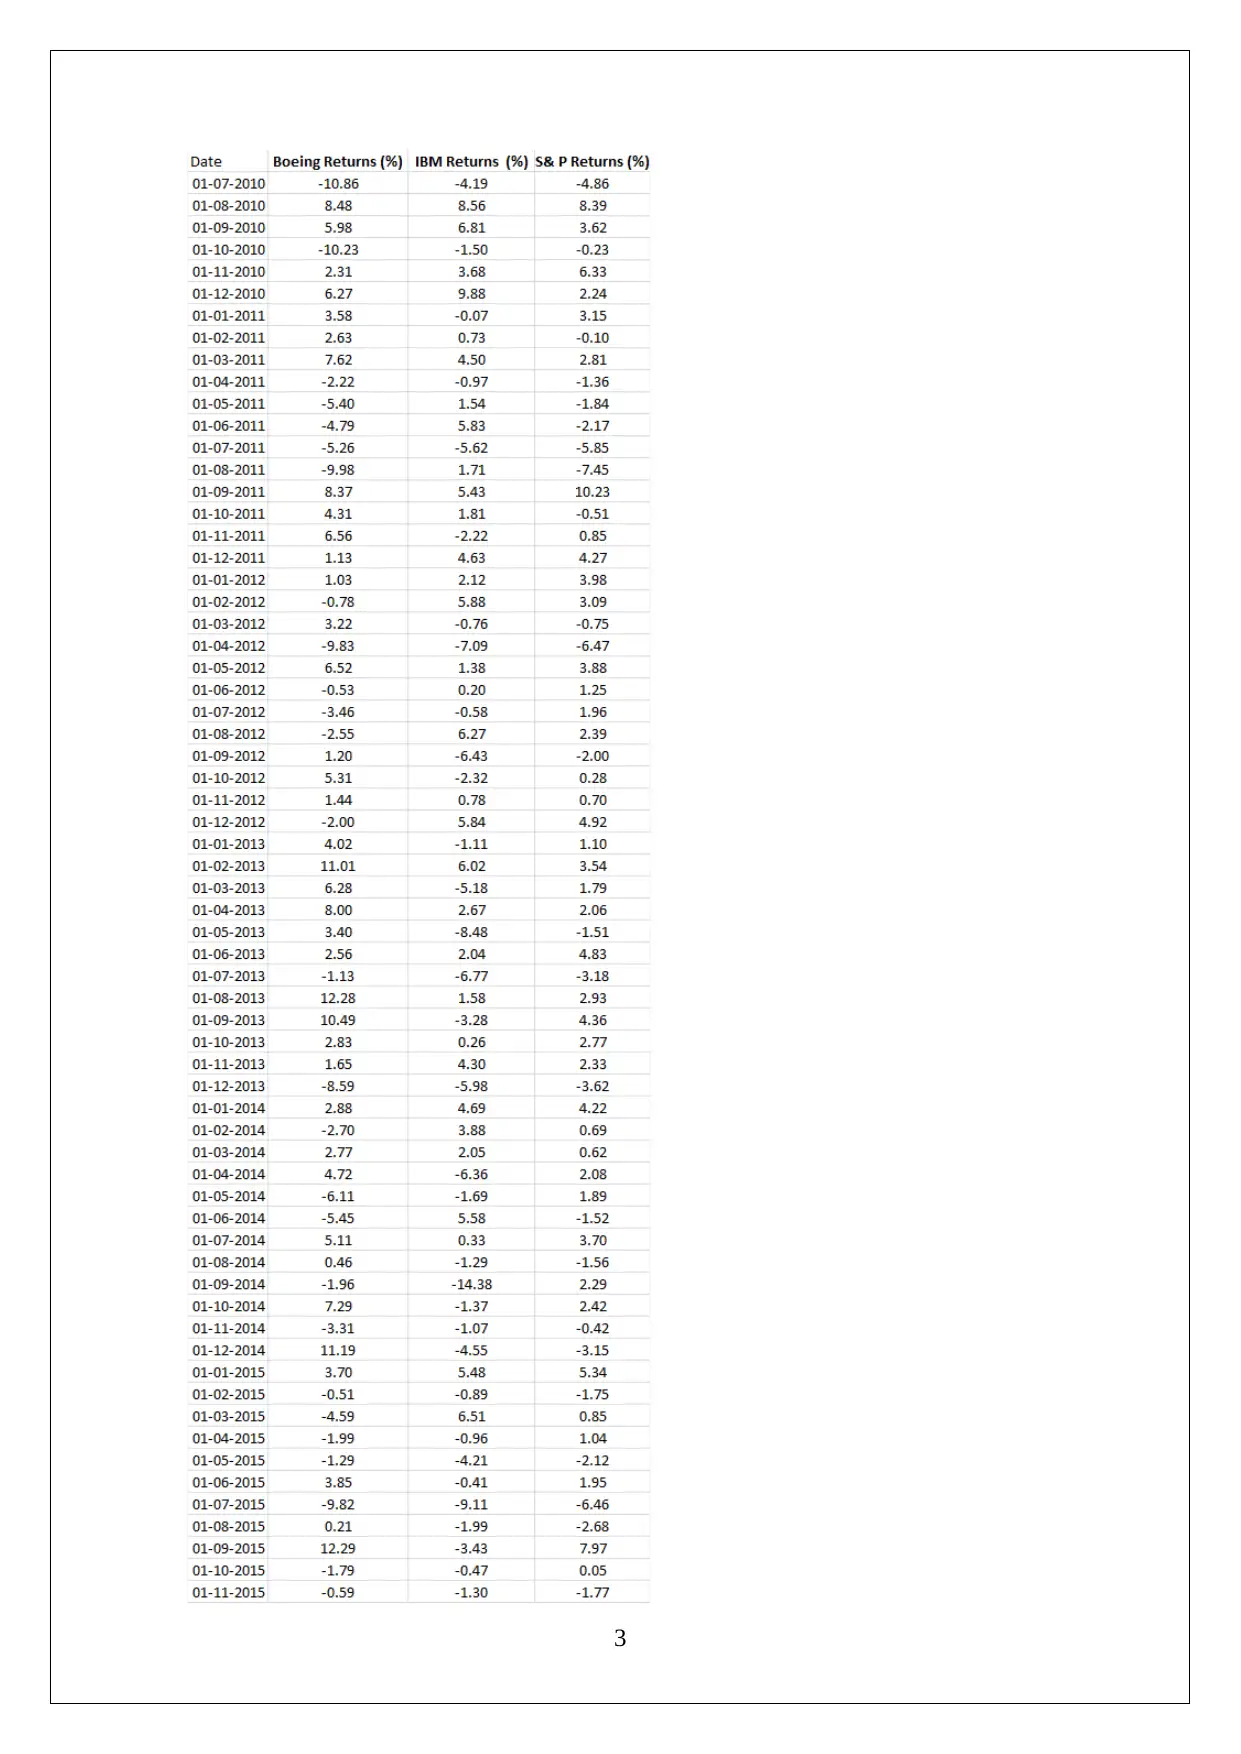
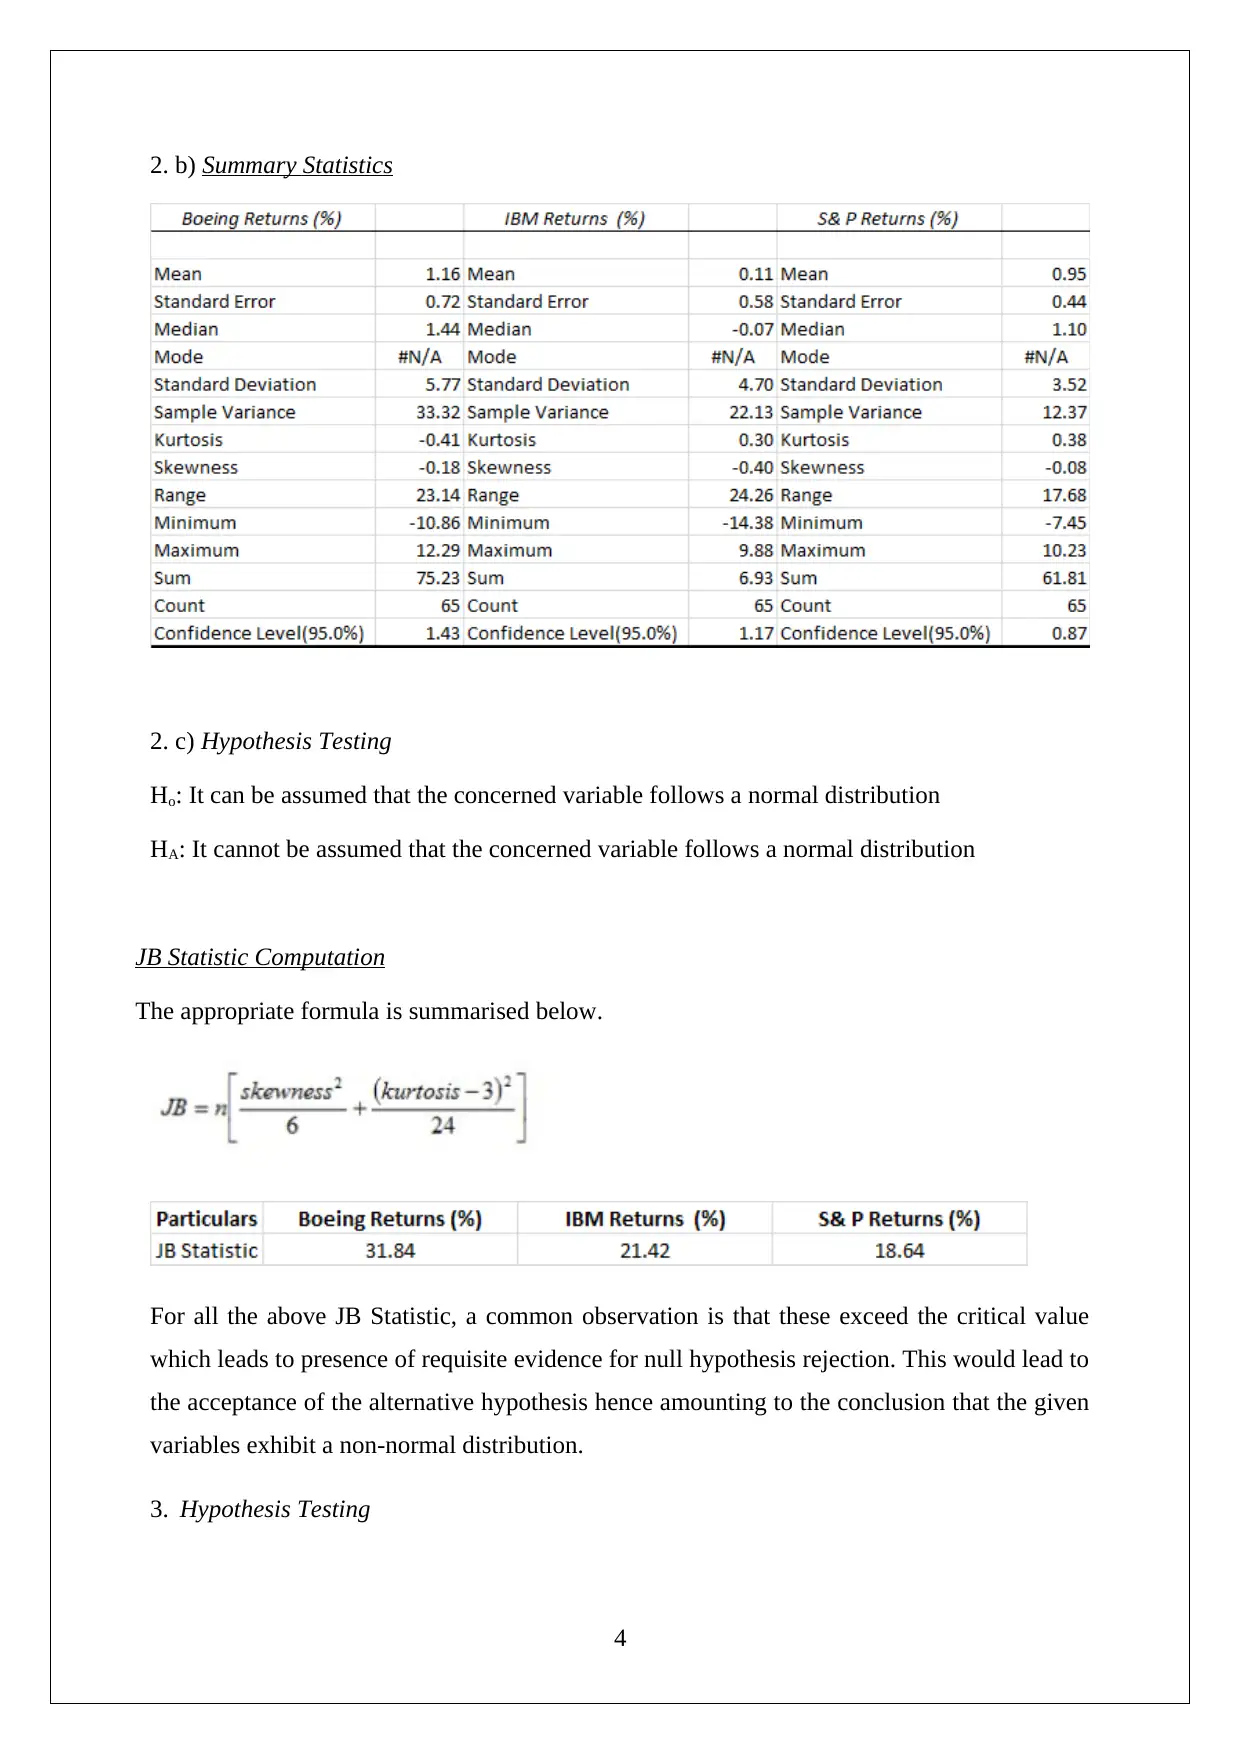
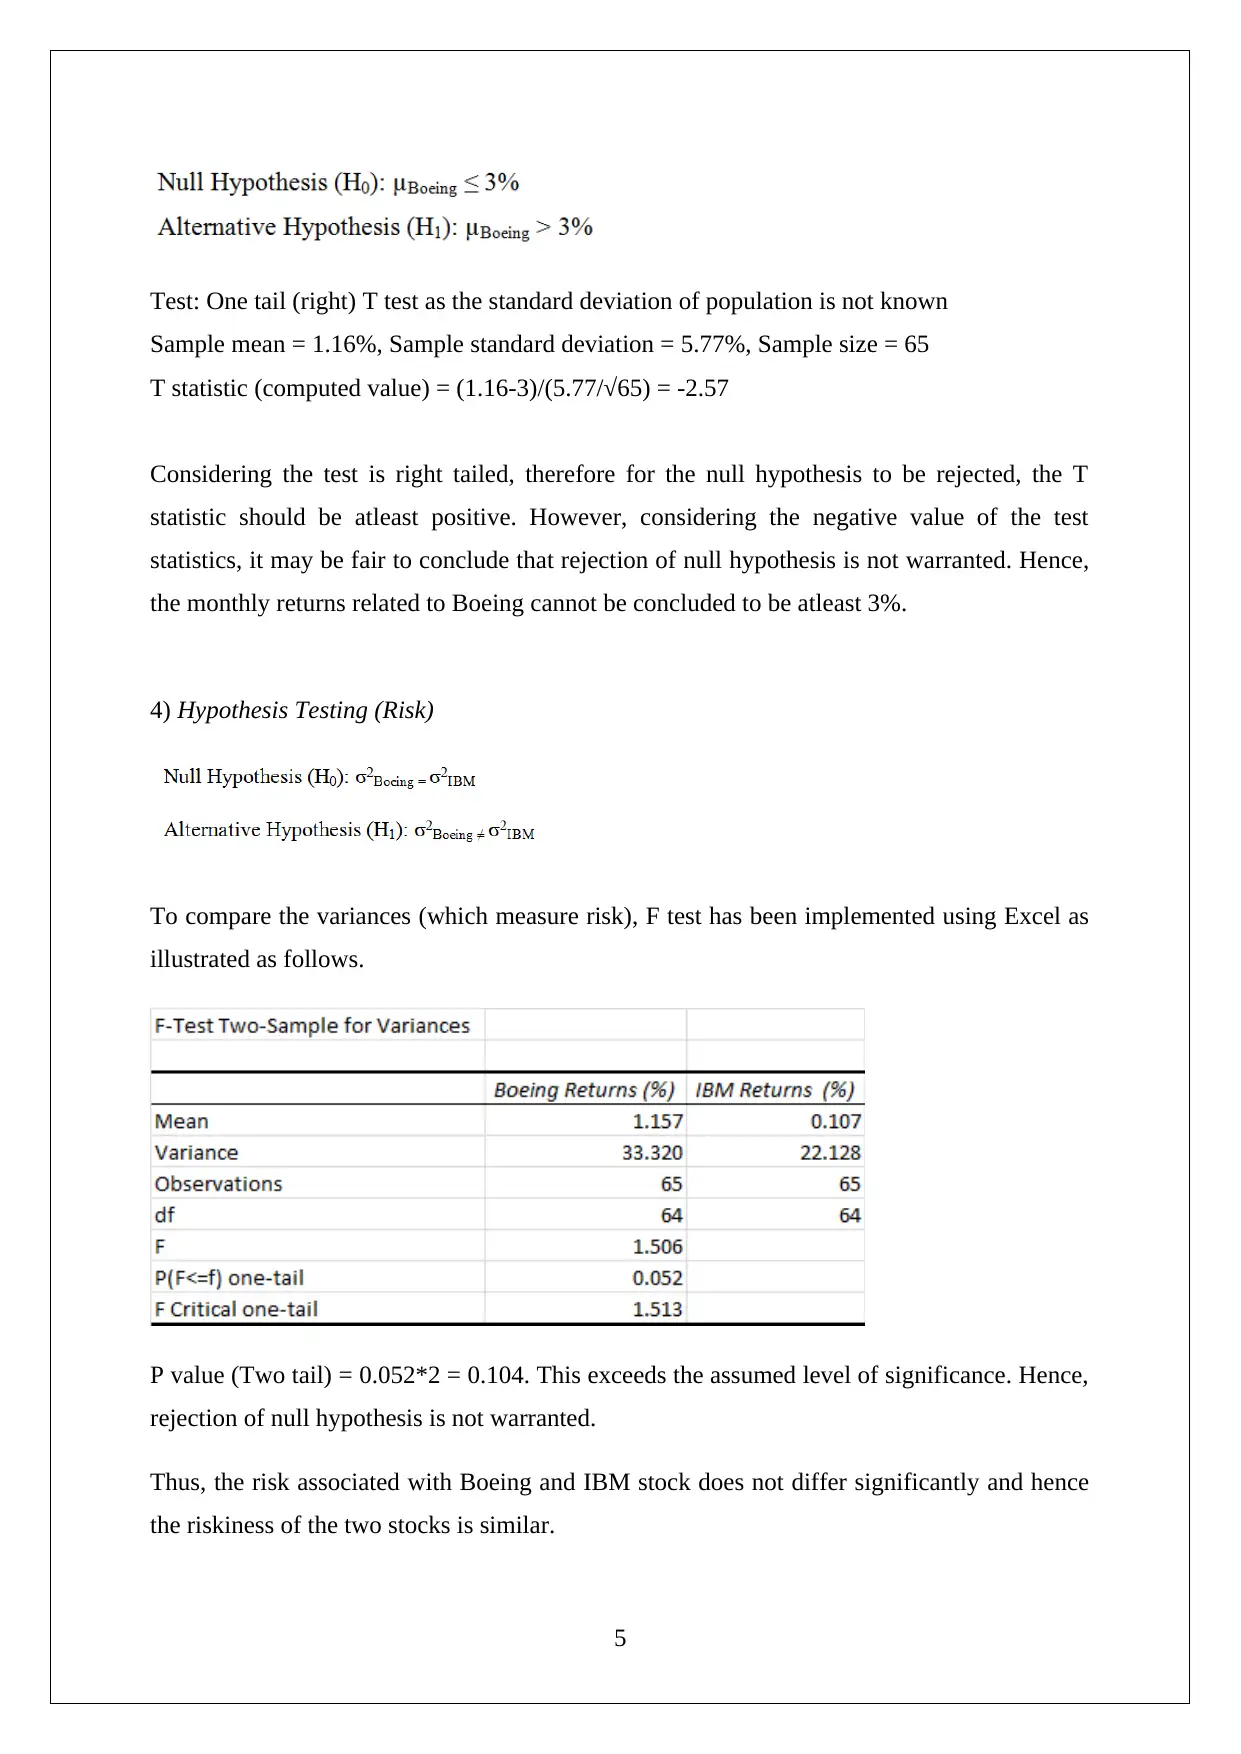
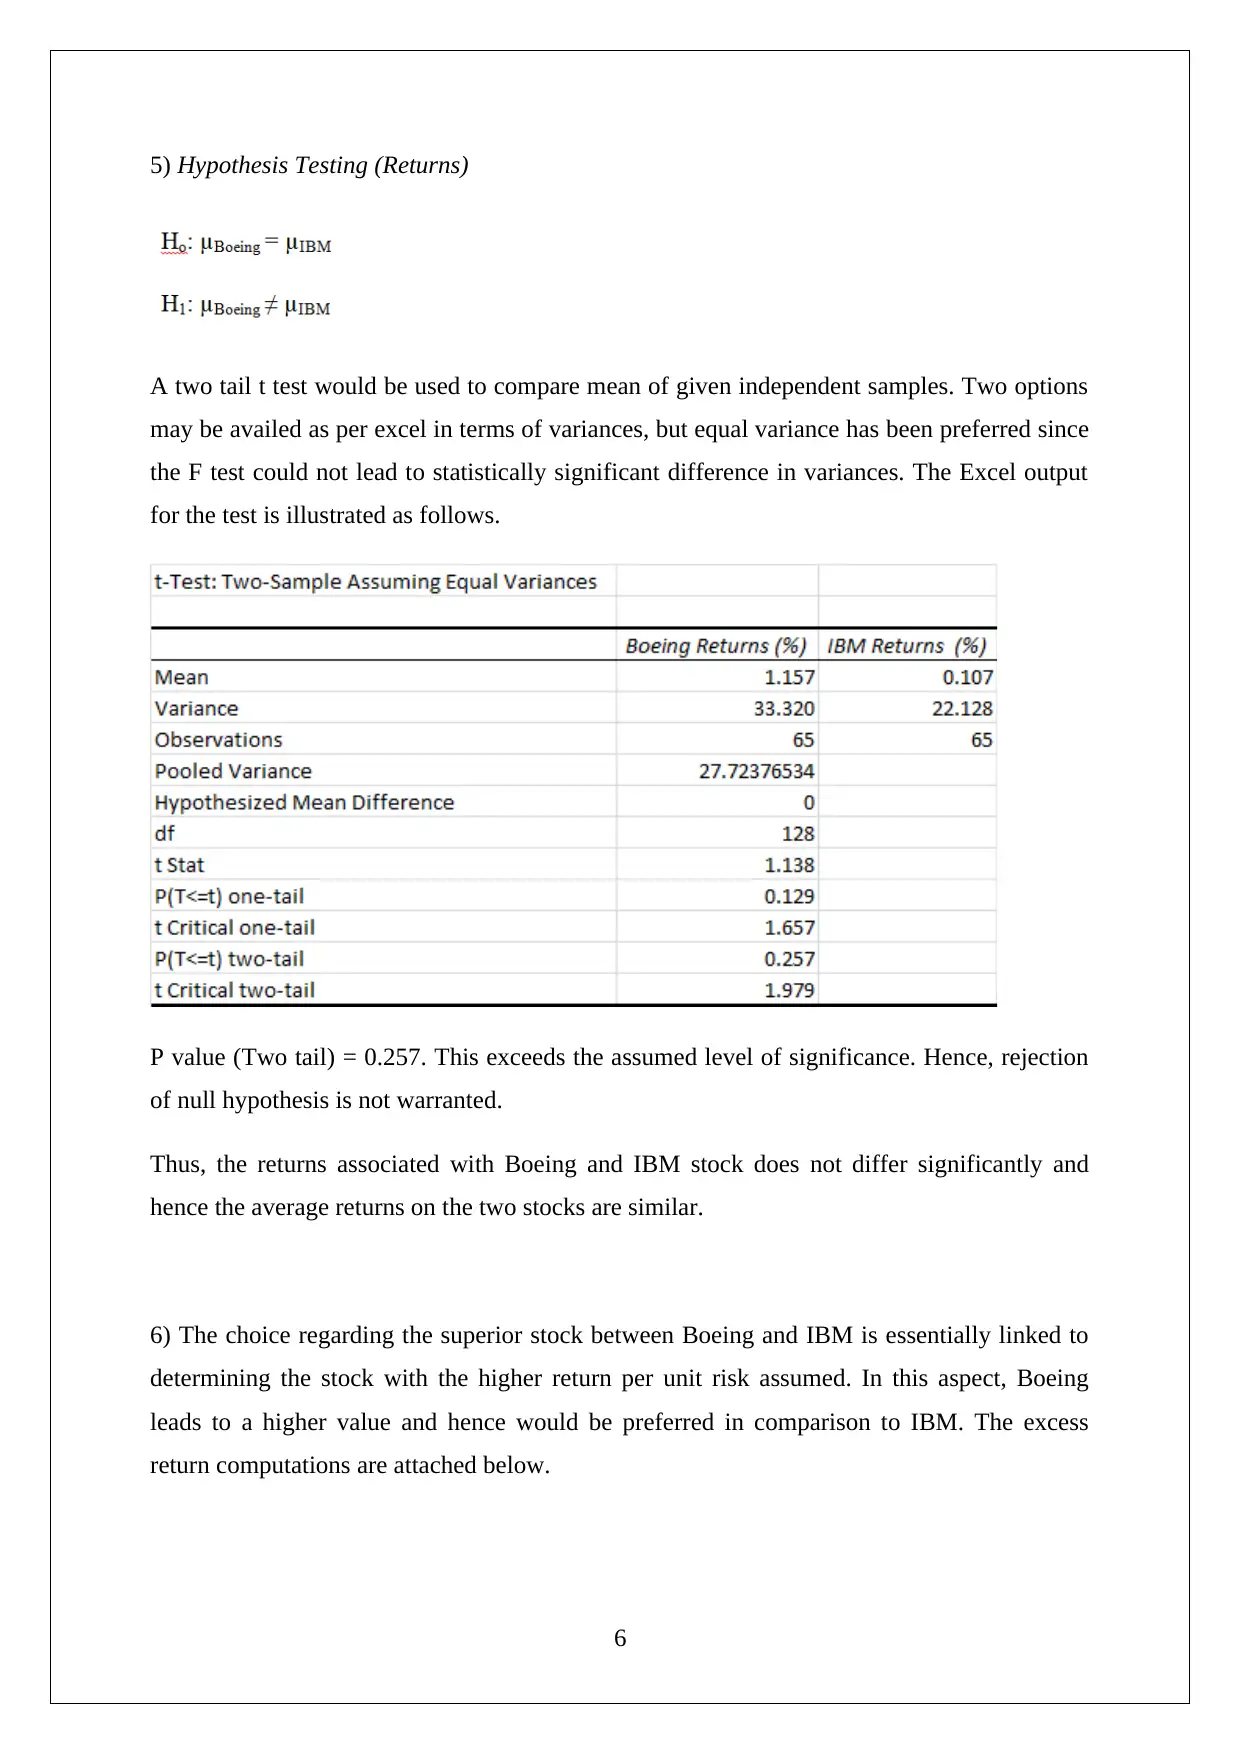
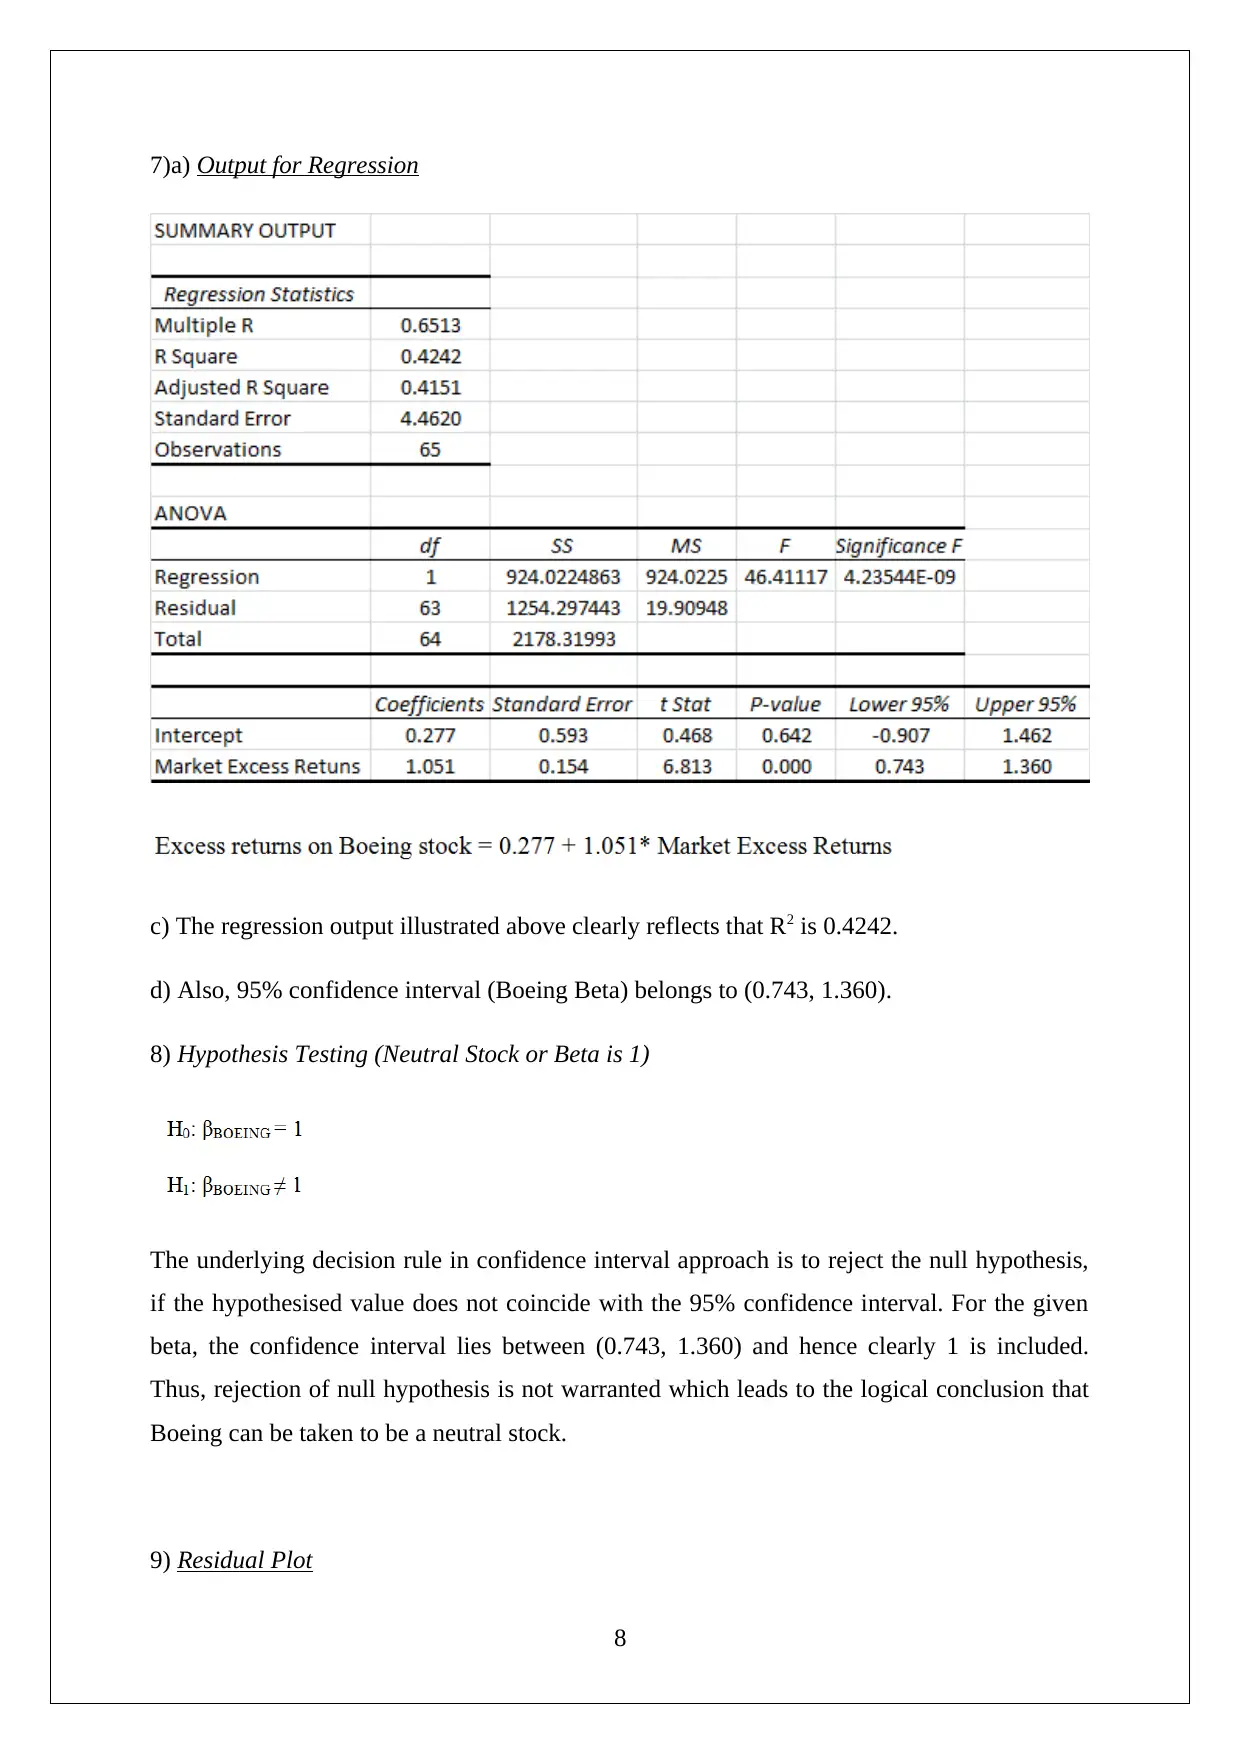
This assignment delves into statistical analysis within the context of business and finance, focusing on stock analysis, hypothesis testing, and risk assessment. Part A involves computational analysis of stock data, including the calculation of monthly returns, summary statistics, and hypothesis testing for normality, risk, and returns. It compares Boeing and IBM stocks, assessing their performance and risk profiles using t-tests, F-tests, and regression analysis. The assignment also examines the beta of Boeing stock, assesses its neutrality, and analyzes residual plots. Part B provides an interpretation of the findings, including a comparative analysis of Boeing, IBM, and the S&P 500, discussing returns, risk, and normality of returns. It also includes the interpretation of the regression model and coefficient of determination, and the interpretation of the beta and confidence interval. The analysis concludes with a determination of the superior stock based on the risk-return profile and highlights the limitations of the model.
Document Page
STATISTICS FOR BUSINESS & FINANCE
[Type the document subtitle]
STUDENT ID
[Pick the date]
tabler-icon-diamond-filled.svg

Paraphrase This Document

Need a fresh take? Get an instant paraphrase of this document with our AI Paraphraser
Document Page
PART A: Computation
1. Closing price graphs
1
Document Page
2. a) For the period under consideration, the monthly returns have been computed and
presented in the form of table below.
2
Document Page
3
tabler-icon-diamond-filled.svg

Paraphrase This Document

Need a fresh take? Get an instant paraphrase of this document with our AI Paraphraser
Document Page
2. b) Summary Statistics
2. c) Hypothesis Testing
Ho: It can be assumed that the concerned variable follows a normal distribution
HA: It cannot be assumed that the concerned variable follows a normal distribution
JB Statistic Computation
The appropriate formula is summarised below.
For all the above JB Statistic, a common observation is that these exceed the critical value
which leads to presence of requisite evidence for null hypothesis rejection. This would lead to
the acceptance of the alternative hypothesis hence amounting to the conclusion that the given
variables exhibit a non-normal distribution.
3. Hypothesis Testing
4
Document Page
Test: One tail (right) T test as the standard deviation of population is not known
Sample mean = 1.16%, Sample standard deviation = 5.77%, Sample size = 65
T statistic (computed value) = (1.16-3)/(5.77/√65) = -2.57
Considering the test is right tailed, therefore for the null hypothesis to be rejected, the T
statistic should be atleast positive. However, considering the negative value of the test
statistics, it may be fair to conclude that rejection of null hypothesis is not warranted. Hence,
the monthly returns related to Boeing cannot be concluded to be atleast 3%.
4) Hypothesis Testing (Risk)
To compare the variances (which measure risk), F test has been implemented using Excel as
illustrated as follows.
P value (Two tail) = 0.052*2 = 0.104. This exceeds the assumed level of significance. Hence,
rejection of null hypothesis is not warranted.
Thus, the risk associated with Boeing and IBM stock does not differ significantly and hence
the riskiness of the two stocks is similar.
5
Document Page
5) Hypothesis Testing (Returns)
A two tail t test would be used to compare mean of given independent samples. Two options
may be availed as per excel in terms of variances, but equal variance has been preferred since
the F test could not lead to statistically significant difference in variances. The Excel output
for the test is illustrated as follows.
P value (Two tail) = 0.257. This exceeds the assumed level of significance. Hence, rejection
of null hypothesis is not warranted.
Thus, the returns associated with Boeing and IBM stock does not differ significantly and
hence the average returns on the two stocks are similar.
6) The choice regarding the superior stock between Boeing and IBM is essentially linked to
determining the stock with the higher return per unit risk assumed. In this aspect, Boeing
leads to a higher value and hence would be preferred in comparison to IBM. The excess
return computations are attached below.
6
tabler-icon-diamond-filled.svg

Paraphrase This Document

Need a fresh take? Get an instant paraphrase of this document with our AI Paraphraser
Document Page
7
Document Page
7)a) Output for Regression
c) The regression output illustrated above clearly reflects that R2 is 0.4242.
d) Also, 95% confidence interval (Boeing Beta) belongs to (0.743, 1.360).
8) Hypothesis Testing (Neutral Stock or Beta is 1)
The underlying decision rule in confidence interval approach is to reject the null hypothesis,
if the hypothesised value does not coincide with the 95% confidence interval. For the given
beta, the confidence interval lies between (0.743, 1.360) and hence clearly 1 is included.
Thus, rejection of null hypothesis is not warranted which leads to the logical conclusion that
Boeing can be taken to be a neutral stock.
9) Residual Plot
8
Document Page
.
9
tabler-icon-diamond-filled.svg

Paraphrase This Document

Need a fresh take? Get an instant paraphrase of this document with our AI Paraphraser
Document Page
Part B: Interpretation
1) Boeing Stock – The stock has been range-bound from mid-2010 to March 2013 and hence
delivered any significant returns for the shareholders. But from there is a definitive
breakout in the stock and in a period of 9 months, the stock has registered gains in excess
of 50%. Post that consolidation has been observed with uptrend continued from
November 2014.
IBM Stock – From July 2010 to March 2012, the stock has shown significant upmove
with returns exceeding 55%. This was followed by a consolidation period where sideways
movement in a narrow range was observed. But after this phase, there is a downward
trend in prices whereby the previous gains have been almost wiped out.
S&P 500 – From July 2010 to March 2011, the index observed an uptrend but these gains
were quickly nullified by a correction that followed. But a consistent uptrend in the index
was observable commencing from October 2011 to March 2015. During this period only
minor corrections were observed. The index posted gains in excess of 70% during this
period.
2) b) The returns on the stock is measured using the average returns while the underlying
risk is indicated by the underlying volatility or standard deviation observed in the returns.
With regards to returns, it is apparent that Boeing leads IBM since the monthly average
returns for the former is 1.16% as compared to the latter value of 0.11%. Also, in relation
to risk, Boeing leads IBM since the former has a higher standard deviation value in
comparison with the latter. Thus, the riskier of the two is Boeing stock.
c) To ascertain the normality of returns for the various stocks and index is imperative as it
is a key assumption with regarding to deploying hypothesis testing for deriving
population characteristics on the basis of sample characteristics. This is especially in
relation to determining the risk return characteristics which can enable the investor to
decide on the superior stock.
5) The hypothesis testing clearly leads to the conclusion that the average returns on the two
stocks do not show any significant differ and the superior stock cannot be selected on this
10
Document Page
basis. Also, the average risk (depicted through standard deviation) does not indicate higher
risk for any particular stock. Hence, only the sample data could potentially lead to any
conclusions in relation to the superior stock. For this, the return per unit risk is computed for
both stocks considering the sample data and a higher value is obtained for Boeing leading to
proof of its superiority as an investment.
7) b) The slope coefficient for the regression model highlights the stock beta which
essentially captures all possible systematic risk associated with the stock. This value has been
derived as 1.05. Considering that this is greater than 1, hence the first conclusion is that the
Boeing stock is aggressive. Also, the expected movement in Boeing stock would be higher in
comparison to the corresponding index movements. Thus, for ever 1% movement in S&P 500
index observed, a corresponding change of 1.05% can be assumed to take place in Boeing
stock in the same direction.
c) The coefficient of determination highlights that the market index accounts for only 42.42%
of the respective movements experienced by the Boeing stock. The remaining 57.58%
movement in the stock is not offered any explanation by the market. Hence, it would be
appropriate to comment that systematic risk associated with Boeing is not represented
adequately by beta and hence other predictor variables which could capture other parameters
or associated risk need to be added to the given CAPM model.
d) Based on the 95% confidence interval output, it would be appropriate to comment with
95% confidence or likelihood that the Boeing beta would lie in the interval captured by (0.74,
1.36).
9) The residual plot clearly highlights the random distribution of the residuals across the
whole range of the independent variable (X) and no pattern is decipherable. Hence, it would
be appropriate to reach the conclusion that the residuals are normally distributed. Presence of
any particular pattern would have meant that the distribution is not normal.
11
chevron_up_icon
1 out of 12
circle_padding
hide_on_mobile
zoom_out_icon
[object Object]