Statistics for Business and Finance: Data Analysis Report (BUS5SBF)
VerifiedAdded on 2022/07/28
|9
|1061
|21
Report
AI Summary
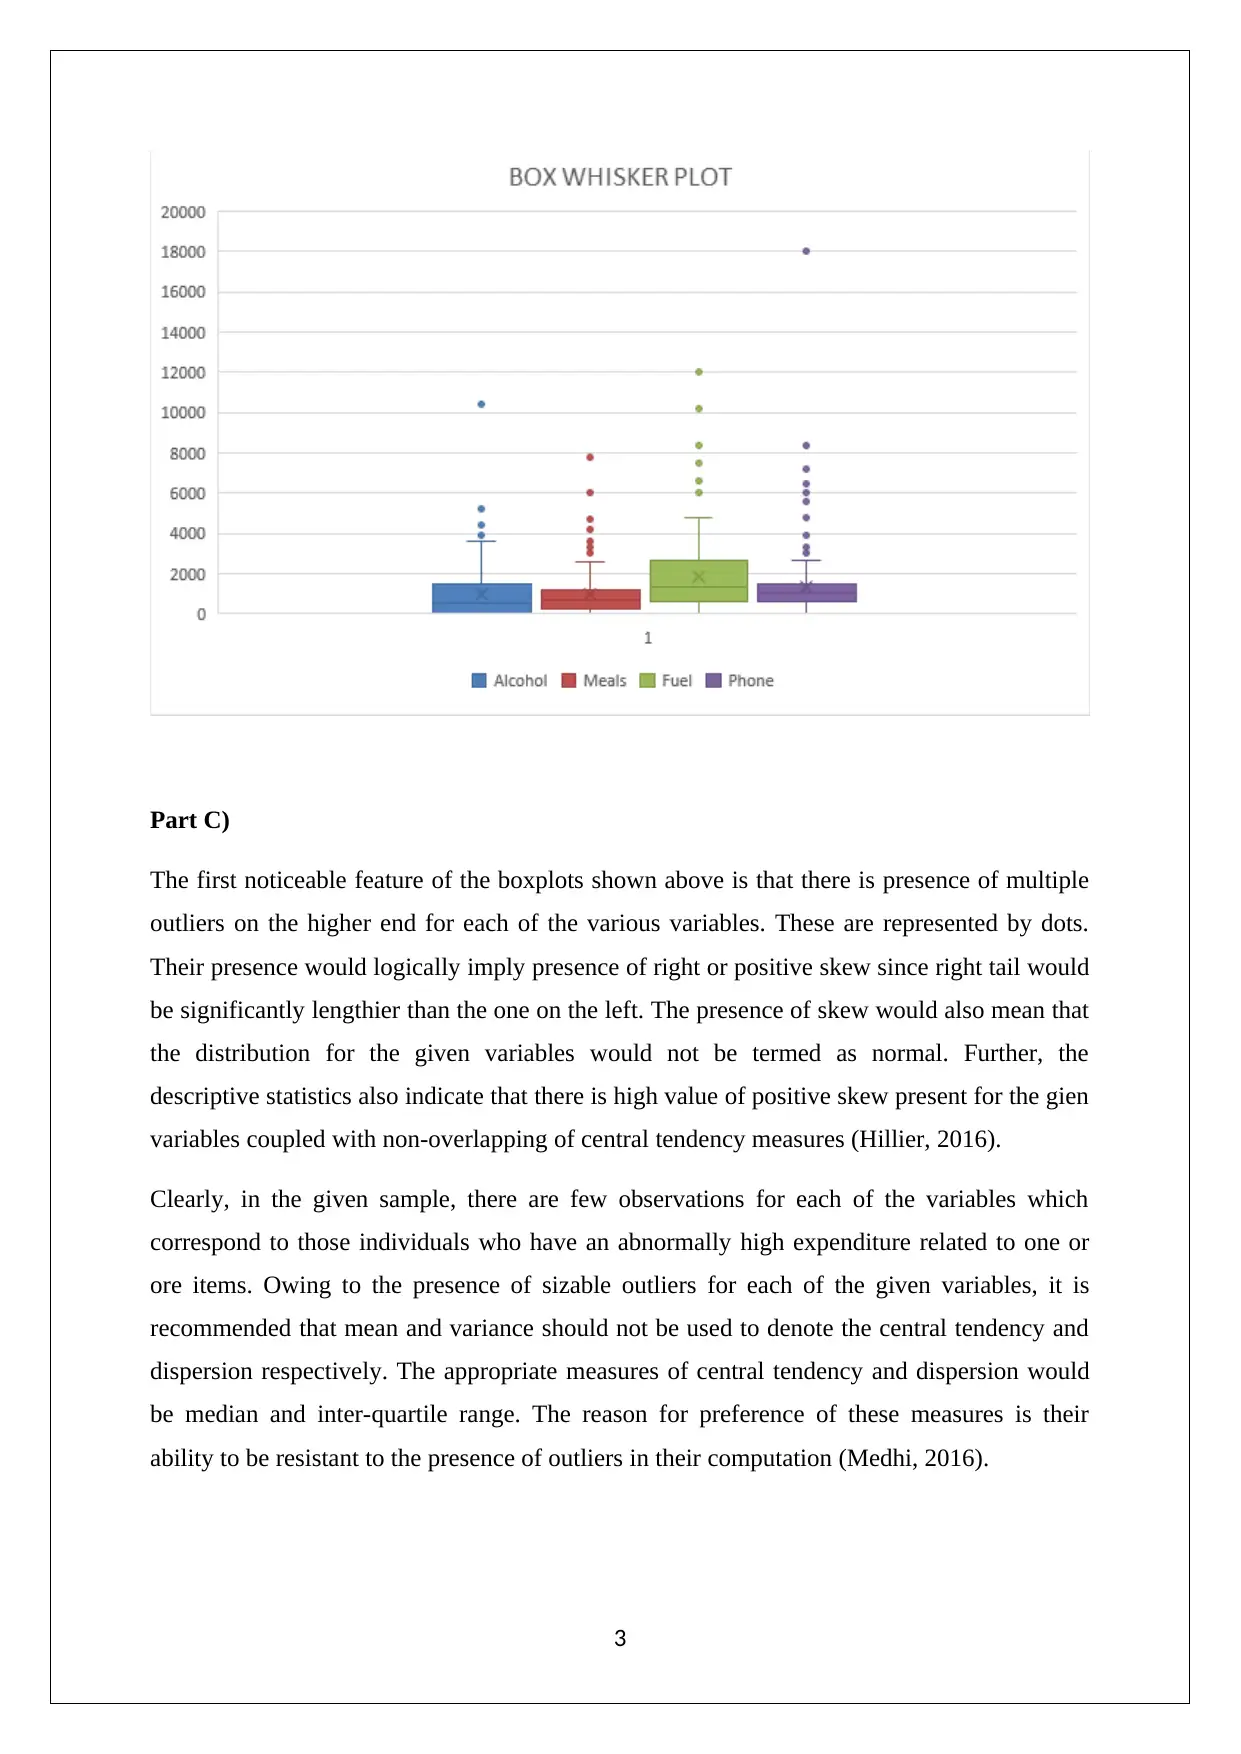
This report, prepared for a Statistics for Business and Finance course, presents a comprehensive analysis of a dataset. It begins by discussing sampling techniques, specifically simple random sampling and stratified random sampling, highlighting their strengths and weaknesses. The report then delves into descriptive statistics, utilizing box-whisker plots to visualize variables like Alcohol, Meals, Fuel, and Phone, identifying outliers and skewness. Furthermore, it explores inferential statistics, calculating percentiles for variables such as ATaxlnc and proportions for OwnHouse. The analysis extends to correlation, examining the relationship between ln(ATaxlnc) and ln(Texp) through scatter plots and correlation coefficients. Finally, the report addresses probability calculations based on cross-tabulated data, determining conditional probabilities related to household heads and their degrees. The report incorporates the use of Excel for data manipulation and visualization, providing a detailed statistical analysis of the provided data set. The references include sources like Flick (2015), Hair et. al. (2015), Hillier (2016), Medhi (2016), and Taylor and Cihon (2017).
1 out of 9
Related Documents


Your All-in-One AI-Powered Toolkit for Academic Success.
+13062052269
info@desklib.com
Available 24*7 on WhatsApp / Email
![[object Object]](/_next/static/media/star-bottom.7253800d.svg)
Copyright © 2020–2026 A2Z Services. All Rights Reserved. Developed and managed by ZUCOL.