Statistics for Business & Finance Report
VerifiedAdded on 2020/03/04
|13
|1717
|33
Report
AI Summary
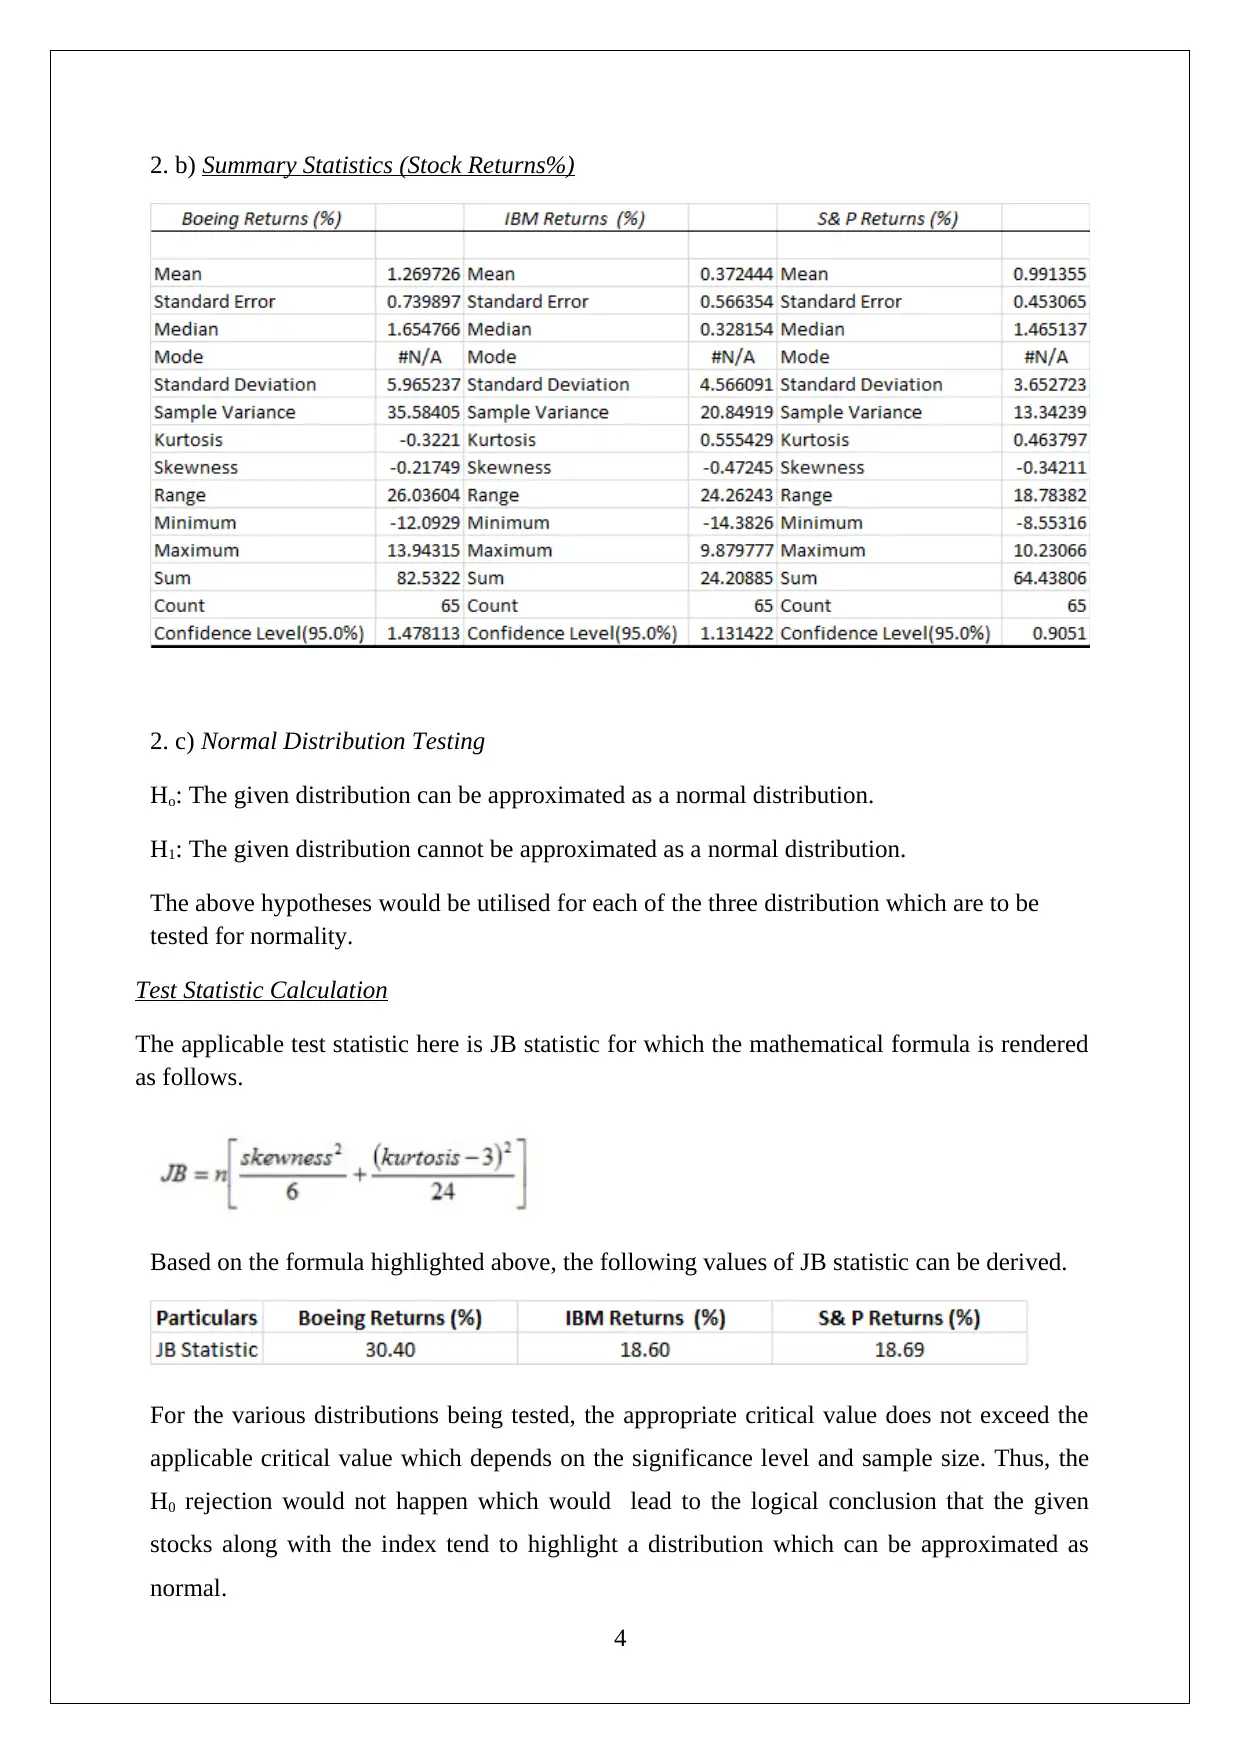
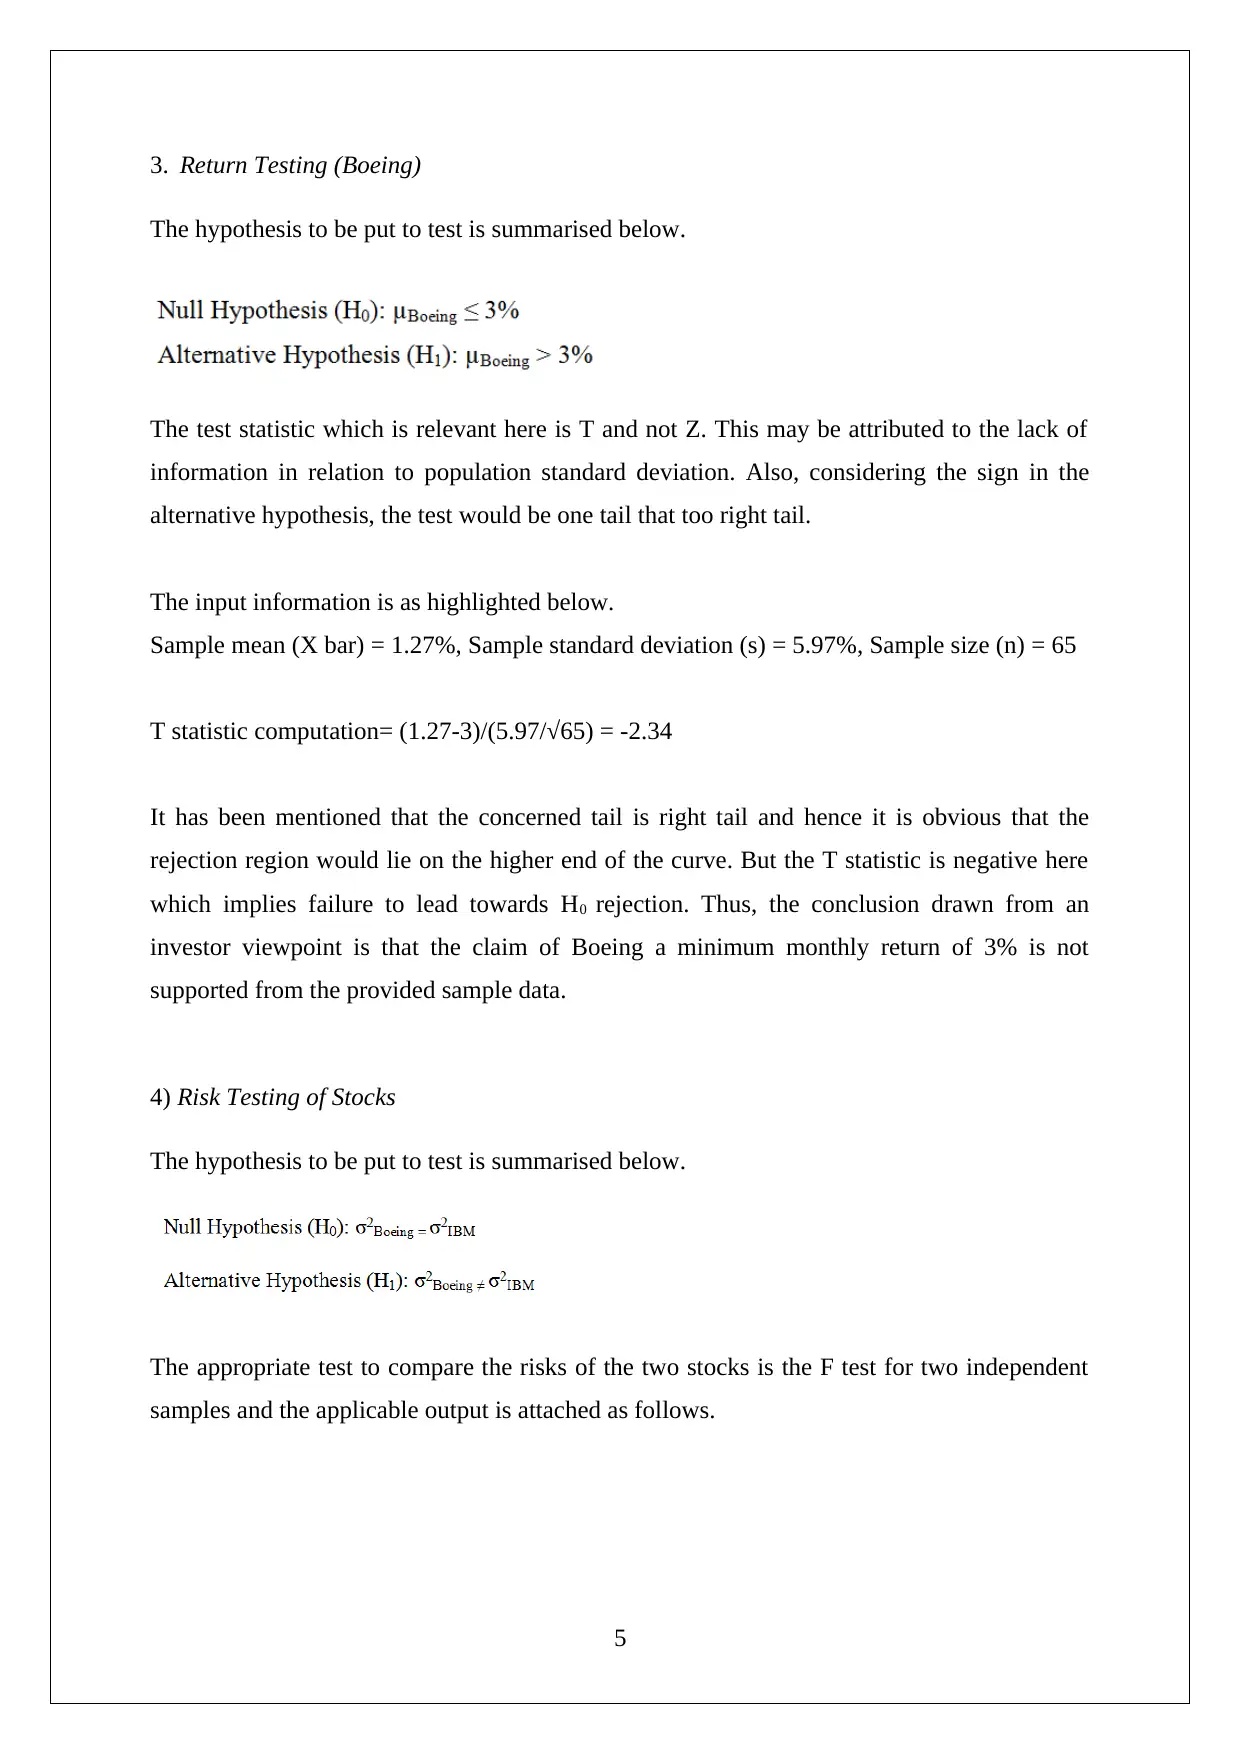
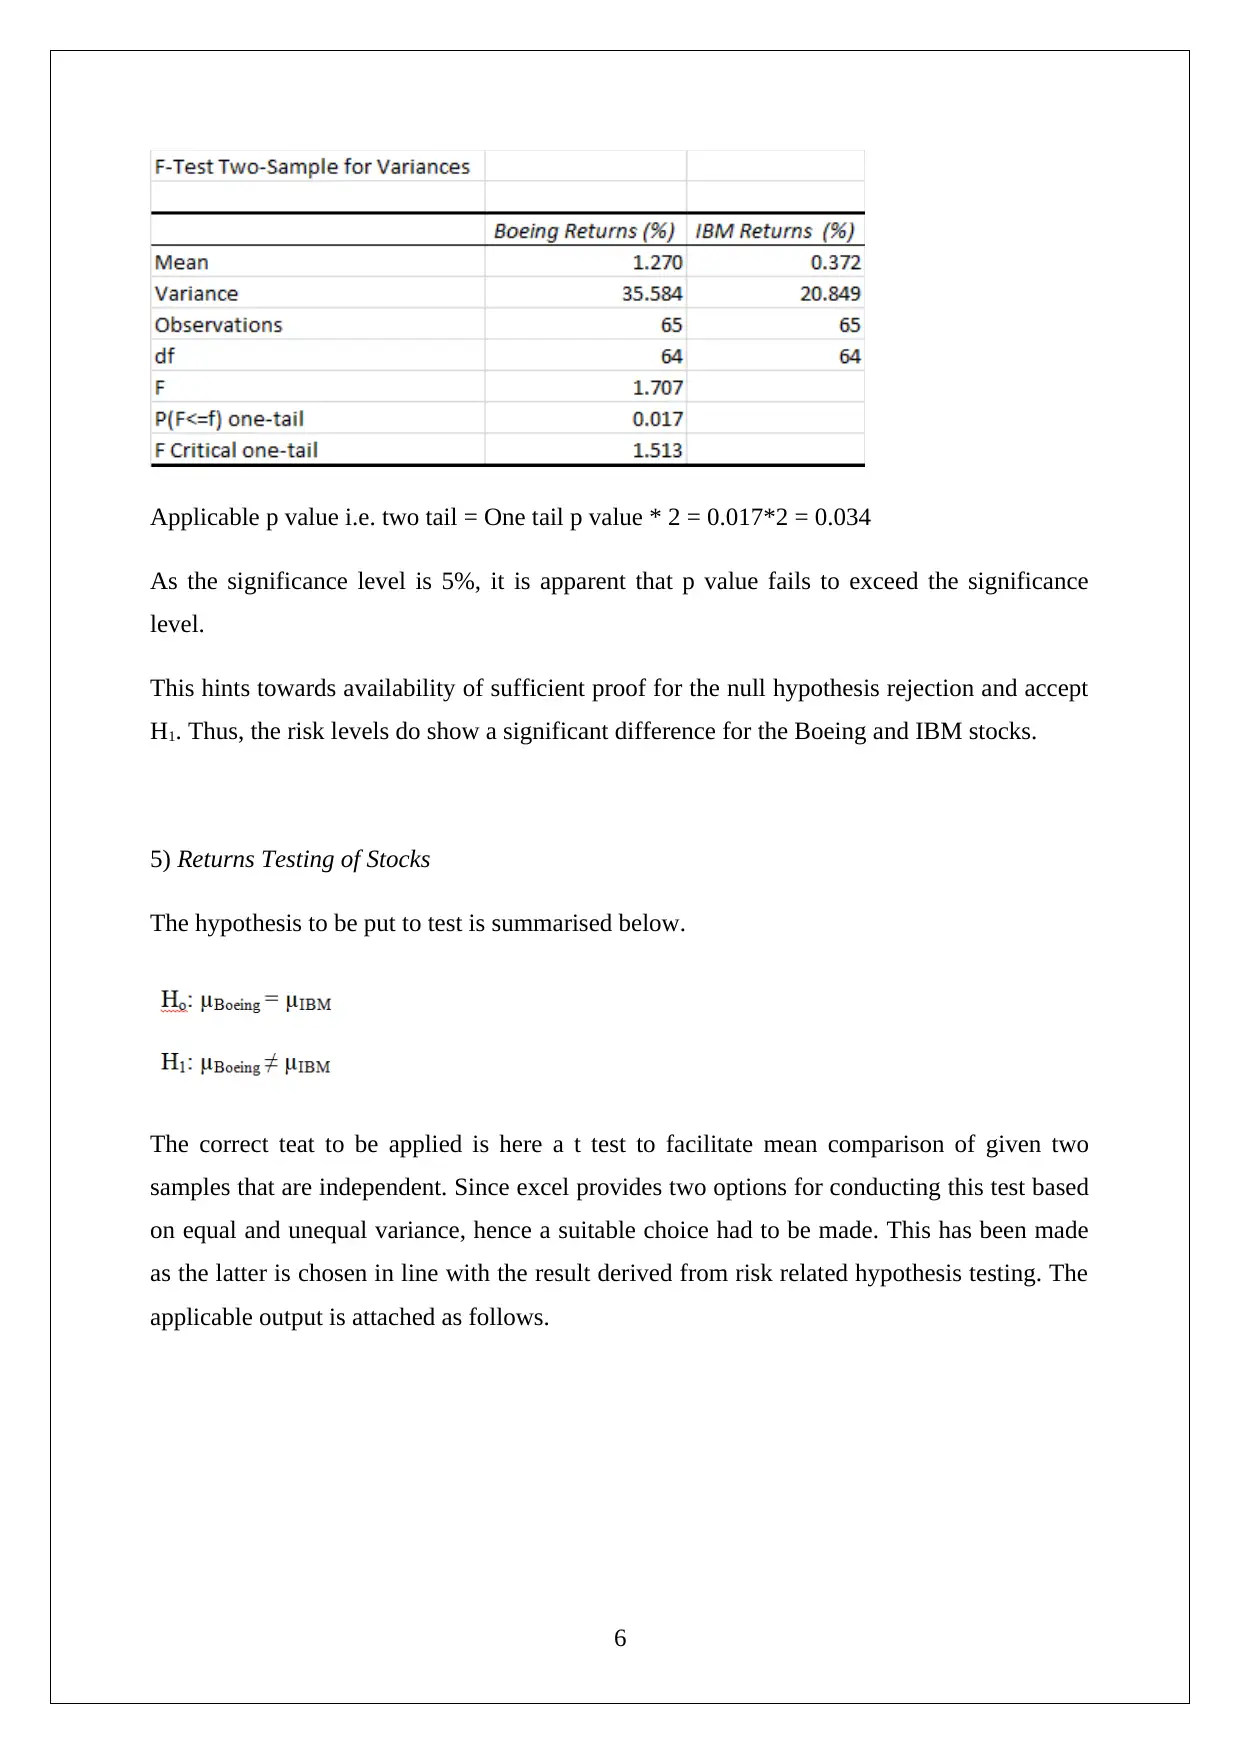
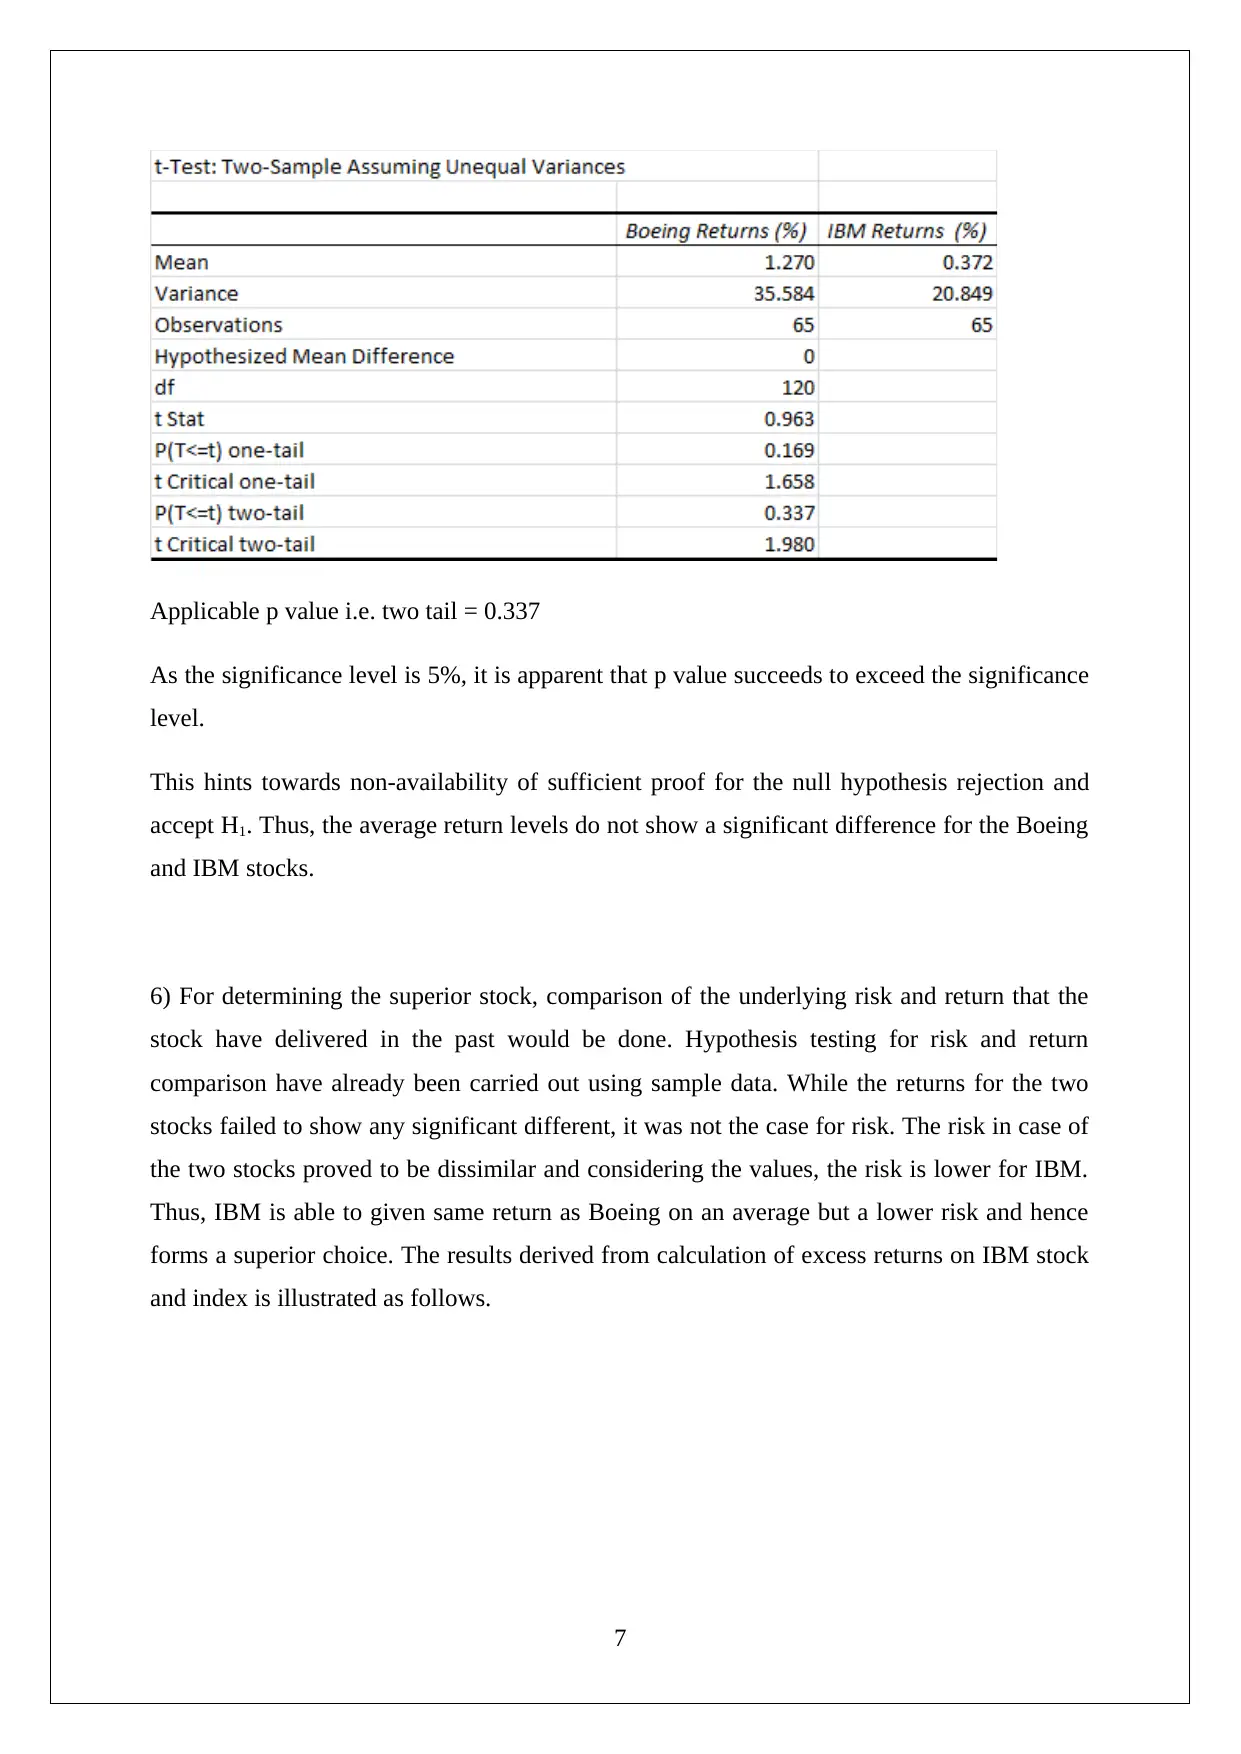
This report covers various statistical analyses related to business and finance, focusing on stock performance, risk assessment, and hypothesis testing for Boeing and IBM stocks. It includes time series graphs, summary statistics, normal distribution testing, and regression analysis, providing insights into the investment potential of these stocks.

STATISTICS FOR BUSINESS & FINANCE
[Type the document subtitle]
STUDENT ID
[Pick the date]
[Type the document subtitle]
STUDENT ID
[Pick the date]
Paraphrase This Document
Need a fresh take? Get an instant paraphrase of this document with our AI Paraphraser

PART A: Computation
1. Time series graphs
1
1. Time series graphs
1

2. a) The closing period for the period under consideration has been utilised to compute the
monthly returns in accordance with the formula that has been highlighted for the same
purpose. These monthly returns are represented in the tabular format.
2
monthly returns in accordance with the formula that has been highlighted for the same
purpose. These monthly returns are represented in the tabular format.
2
⊘ This is a preview!⊘
Do you want full access?
Subscribe today to unlock all pages.

Trusted by 1+ million students worldwide

3
Paraphrase This Document
Need a fresh take? Get an instant paraphrase of this document with our AI Paraphraser

2. b) Summary Statistics (Stock Returns%)
2. c) Normal Distribution Testing
Ho: The given distribution can be approximated as a normal distribution.
H1: The given distribution cannot be approximated as a normal distribution.
The above hypotheses would be utilised for each of the three distribution which are to be
tested for normality.
Test Statistic Calculation
The applicable test statistic here is JB statistic for which the mathematical formula is rendered
as follows.
Based on the formula highlighted above, the following values of JB statistic can be derived.
For the various distributions being tested, the appropriate critical value does not exceed the
applicable critical value which depends on the significance level and sample size. Thus, the
H0 rejection would not happen which would lead to the logical conclusion that the given
stocks along with the index tend to highlight a distribution which can be approximated as
normal.
4

3. Return Testing (Boeing)
The hypothesis to be put to test is summarised below.
The test statistic which is relevant here is T and not Z. This may be attributed to the lack of
information in relation to population standard deviation. Also, considering the sign in the
alternative hypothesis, the test would be one tail that too right tail.
The input information is as highlighted below.
Sample mean (X bar) = 1.27%, Sample standard deviation (s) = 5.97%, Sample size (n) = 65
T statistic computation= (1.27-3)/(5.97/√65) = -2.34
It has been mentioned that the concerned tail is right tail and hence it is obvious that the
rejection region would lie on the higher end of the curve. But the T statistic is negative here
which implies failure to lead towards H0 rejection. Thus, the conclusion drawn from an
investor viewpoint is that the claim of Boeing a minimum monthly return of 3% is not
supported from the provided sample data.
4) Risk Testing of Stocks
The hypothesis to be put to test is summarised below.
The appropriate test to compare the risks of the two stocks is the F test for two independent
samples and the applicable output is attached as follows.
5
The hypothesis to be put to test is summarised below.
The test statistic which is relevant here is T and not Z. This may be attributed to the lack of
information in relation to population standard deviation. Also, considering the sign in the
alternative hypothesis, the test would be one tail that too right tail.
The input information is as highlighted below.
Sample mean (X bar) = 1.27%, Sample standard deviation (s) = 5.97%, Sample size (n) = 65
T statistic computation= (1.27-3)/(5.97/√65) = -2.34
It has been mentioned that the concerned tail is right tail and hence it is obvious that the
rejection region would lie on the higher end of the curve. But the T statistic is negative here
which implies failure to lead towards H0 rejection. Thus, the conclusion drawn from an
investor viewpoint is that the claim of Boeing a minimum monthly return of 3% is not
supported from the provided sample data.
4) Risk Testing of Stocks
The hypothesis to be put to test is summarised below.
The appropriate test to compare the risks of the two stocks is the F test for two independent
samples and the applicable output is attached as follows.
5
⊘ This is a preview!⊘
Do you want full access?
Subscribe today to unlock all pages.

Trusted by 1+ million students worldwide

Applicable p value i.e. two tail = One tail p value * 2 = 0.017*2 = 0.034
As the significance level is 5%, it is apparent that p value fails to exceed the significance
level.
This hints towards availability of sufficient proof for the null hypothesis rejection and accept
H1. Thus, the risk levels do show a significant difference for the Boeing and IBM stocks.
5) Returns Testing of Stocks
The hypothesis to be put to test is summarised below.
The correct teat to be applied is here a t test to facilitate mean comparison of given two
samples that are independent. Since excel provides two options for conducting this test based
on equal and unequal variance, hence a suitable choice had to be made. This has been made
as the latter is chosen in line with the result derived from risk related hypothesis testing. The
applicable output is attached as follows.
6
Paraphrase This Document
Need a fresh take? Get an instant paraphrase of this document with our AI Paraphraser

Applicable p value i.e. two tail = 0.337
As the significance level is 5%, it is apparent that p value succeeds to exceed the significance
level.
This hints towards non-availability of sufficient proof for the null hypothesis rejection and
accept H1. Thus, the average return levels do not show a significant difference for the Boeing
and IBM stocks.
6) For determining the superior stock, comparison of the underlying risk and return that the
stock have delivered in the past would be done. Hypothesis testing for risk and return
comparison have already been carried out using sample data. While the returns for the two
stocks failed to show any significant different, it was not the case for risk. The risk in case of
the two stocks proved to be dissimilar and considering the values, the risk is lower for IBM.
Thus, IBM is able to given same return as Boeing on an average but a lower risk and hence
forms a superior choice. The results derived from calculation of excess returns on IBM stock
and index is illustrated as follows.
7

8
⊘ This is a preview!⊘
Do you want full access?
Subscribe today to unlock all pages.

Trusted by 1+ million students worldwide

7)a) Regression (Excel)
From the above, equation for regression model is indicated below.
Excess Returns (IBM) = -1.15 + 0.630 Excess Returns (Market or S&P 500 index)
c) R2 is 0.2697
d) Beta confidence interval at level of 95% lies in range (0.369, 0.891).
8) Testing Stock Beta
Null Hypothesis: βIBM =1
Alternative Hypothesis: βIBM ≠1
Applicable significance level = 5% or 0.05
The decision in respect of null hypothesis rejection is based on the 95% confidence interval
which has been defined as (0.369, 0.891). Rejection takes place only if the hypothesised
value (in this case 1) does not figure in the interval of interest. Here, clearly the value one is
not present in the confidence interval and hence it culminates to rejection of null hypothesis.
Hence, IBM is not a neutral stock.
9) Residual Plot for Narmality
9
Paraphrase This Document
Need a fresh take? Get an instant paraphrase of this document with our AI Paraphraser

.
10
10

Part B: Interpretation
1) Boeing Stock – The stock has seen three clear phases outlined below.
Phase 1 – Movement within narrow trade range of $ 60 and $ 80 (Period from February
2010 to February 2013)
Phase 2 – Uptrend from $ 80 to $ 140 (Period from March 2013 to February 2014)
Phase 3- Consolidation period around $ 140 (Period from March 2014 onwards)
IBM Stock – The stock has seen three clear phases outlined below.
Phase 1 – Uptrend from $ 125 to $ 200 (Period from February 2010 to February 2012)
Phase 2 – Movement within narrow trade range of $ 190 and $ 210 (Period from February
2012 to February 2013)
Phase 3- Downtrend from $ 200 to $ 155 (Period from March 2013 onwards)
S&P 500 – The index from February 2010 to November 2011 did not gain significantly as
all the gains were essentially given up. However, from December 2011 till May 2015, a
significant uptrend has been observed in the index. Also, the corrections during this long
bull run were relatively minimal.
2) b) For returns, the superior choice is Boeing which delivers higher monthly average
returns as is apparent from the summary statistics. However, the same summary statistics
reflect that the higher risk is also borne by Boeing investor considering the higher
standard deviation value it has.
c) The Jarque Berra test hints at the normality of the return variable. The normality testing
becomes critical primarily for carrying out hypothesis testing where based on the
normality assumption suitable test statistic would be selected. Through hypothesis testing,
a comparison between the significant parameters of the stock is facilitated which inturn
improves decision making for investment purposes.
5) Every investors aims to maximise the returns for a unit risk assumed. Also, with similar
returns, a rational investor would always prefer a less risky stock. For the stocks under the
radar, the hypothesis testing highlights that in terms of returns, the two stocks are not
11
⊘ This is a preview!⊘
Do you want full access?
Subscribe today to unlock all pages.

Trusted by 1+ million students worldwide
1 out of 13
Related Documents

Your All-in-One AI-Powered Toolkit for Academic Success.
+13062052269
info@desklib.com
Available 24*7 on WhatsApp / Email
Unlock your academic potential
Copyright © 2020–2025 A2Z Services. All Rights Reserved. Developed and managed by ZUCOL.