Statistics for Management Report: Data Analysis and Findings
VerifiedAdded on 2020/11/23
|19
|3852
|233
Report
AI Summary
This report, titled "Statistics for Management," provides a comprehensive analysis of business and economic data sourced from the Office of National Statistics. It begins with an introduction to statistical methods in business operations, emphasizing their role in strategic planning. Activity 1 focuses on Consumer Price Indices (CPI) and Retail Price Indices (RPI), presenting graphical and tabular representations of the data and comparing the differences between the indices. The analysis extends to the use of CPI data in evaluating annual inflation and assessing its importance. Activity 2 delves into data analysis, employing ogives, calculating median hourly earnings, quartiles, mean, and standard deviation to compare earnings. Activity 3 addresses inventory management, evaluating the economic order quantity, reordering requirements, inventory policy costs, and current service levels. Finally, Activity 4 utilizes data from previous activities to produce an ogive for cumulative percentage of staff versus hourly earnings, culminating in a conclusion summarizing the key findings and insights derived from the statistical analysis.
STATISTICS FOR
MANAGEMENT
MANAGEMENT
Paraphrase This Document
Need a fresh take? Get an instant paraphrase of this document with our AI Paraphraser
Table of Contents
INTRODUCTION...........................................................................................................................1
ACTIVITY 1....................................................................................................................................1
a) Situation of data from Office of National Statistics web site.................................................1
b) Graphical and tabular representation of data acquired form Office of National Statistics.....2
c) The differences the indices.....................................................................................................4
d) Use of data collected form CPI subject to evaluate the annual inflation................................5
e) Importance of rate of inflation and requirement.....................................................................5
ACTIVITY 2....................................................................................................................................6
a) Use of ogive and median hourly earnings and the quartiles, mean and standard deviation. . .6
b) comparison of earnings...........................................................................................................8
b) Analysis of comparative results of survey............................................................................10
ACTIVITY 3..................................................................................................................................10
a) Evaluation of economic order quantity.................................................................................11
b) Assessment of requirement of re-ordering T-Shirts.............................................................12
c) The inventory policy cost......................................................................................................12
d) Current service level to the customers..................................................................................12
e) Work out for the reorder level to accomplishment of desired service level.........................13
ACTIVITY 4..................................................................................................................................13
a) The Office of the National Statistics produce line................................................................13
b) Data used form activity 2 to produce an ogive for cumulative % of staff vs hourly earnings
...................................................................................................................................................16
CONSLUSION..............................................................................................................................17
REFERENCES..............................................................................................................................18
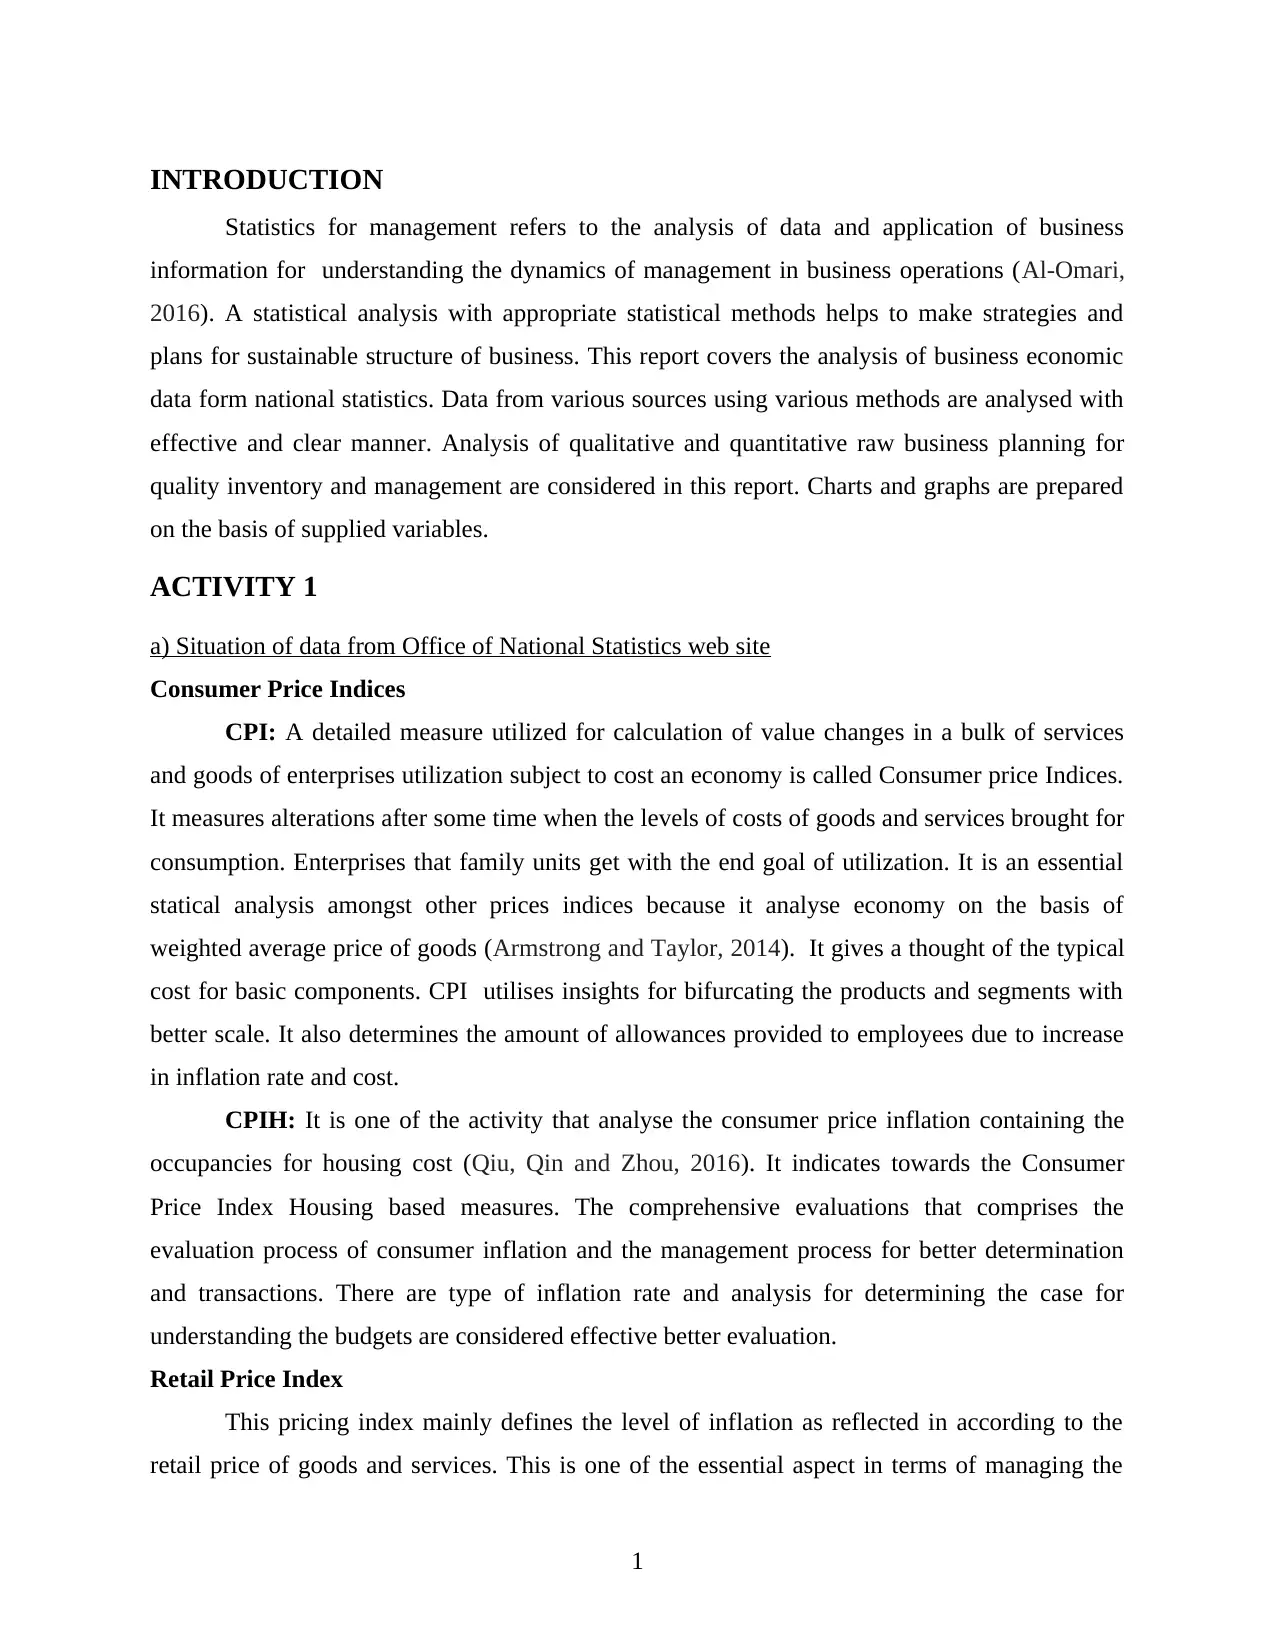
INTRODUCTION
Statistics for management refers to the analysis of data and application of business
information for understanding the dynamics of management in business operations (Al-Omari,
2016). A statistical analysis with appropriate statistical methods helps to make strategies and
plans for sustainable structure of business. This report covers the analysis of business economic
data form national statistics. Data from various sources using various methods are analysed with
effective and clear manner. Analysis of qualitative and quantitative raw business planning for
quality inventory and management are considered in this report. Charts and graphs are prepared
on the basis of supplied variables.
ACTIVITY 1
a) Situation of data from Office of National Statistics web site
Consumer Price Indices
CPI: A detailed measure utilized for calculation of value changes in a bulk of services
and goods of enterprises utilization subject to cost an economy is called Consumer price Indices.
It measures alterations after some time when the levels of costs of goods and services brought for
consumption. Enterprises that family units get with the end goal of utilization. It is an essential
statical analysis amongst other prices indices because it analyse economy on the basis of
weighted average price of goods (Armstrong and Taylor, 2014). It gives a thought of the typical
cost for basic components. CPI utilises insights for bifurcating the products and segments with
better scale. It also determines the amount of allowances provided to employees due to increase
in inflation rate and cost.
CPIH: It is one of the activity that analyse the consumer price inflation containing the
occupancies for housing cost (Qiu, Qin and Zhou, 2016). It indicates towards the Consumer
Price Index Housing based measures. The comprehensive evaluations that comprises the
evaluation process of consumer inflation and the management process for better determination
and transactions. There are type of inflation rate and analysis for determining the case for
understanding the budgets are considered effective better evaluation.
Retail Price Index
This pricing index mainly defines the level of inflation as reflected in according to the
retail price of goods and services. This is one of the essential aspect in terms of managing the
1
⊘ This is a preview!⊘
Do you want full access?
Subscribe today to unlock all pages.
Trusted by 1+ million students worldwide
consumer inflation produced by Office for national statistics. It normally analyse the annual rate
published on the basis of salaries, wages and the tax allowances. The RPI mainly used for
managing various requirements occurs due to different RPI s'. It presents position of expenses of
living record in regard of changing the rate of product and services. which shows how much the
normal expense for primary products get changes time to time. These are circularized by each
month.
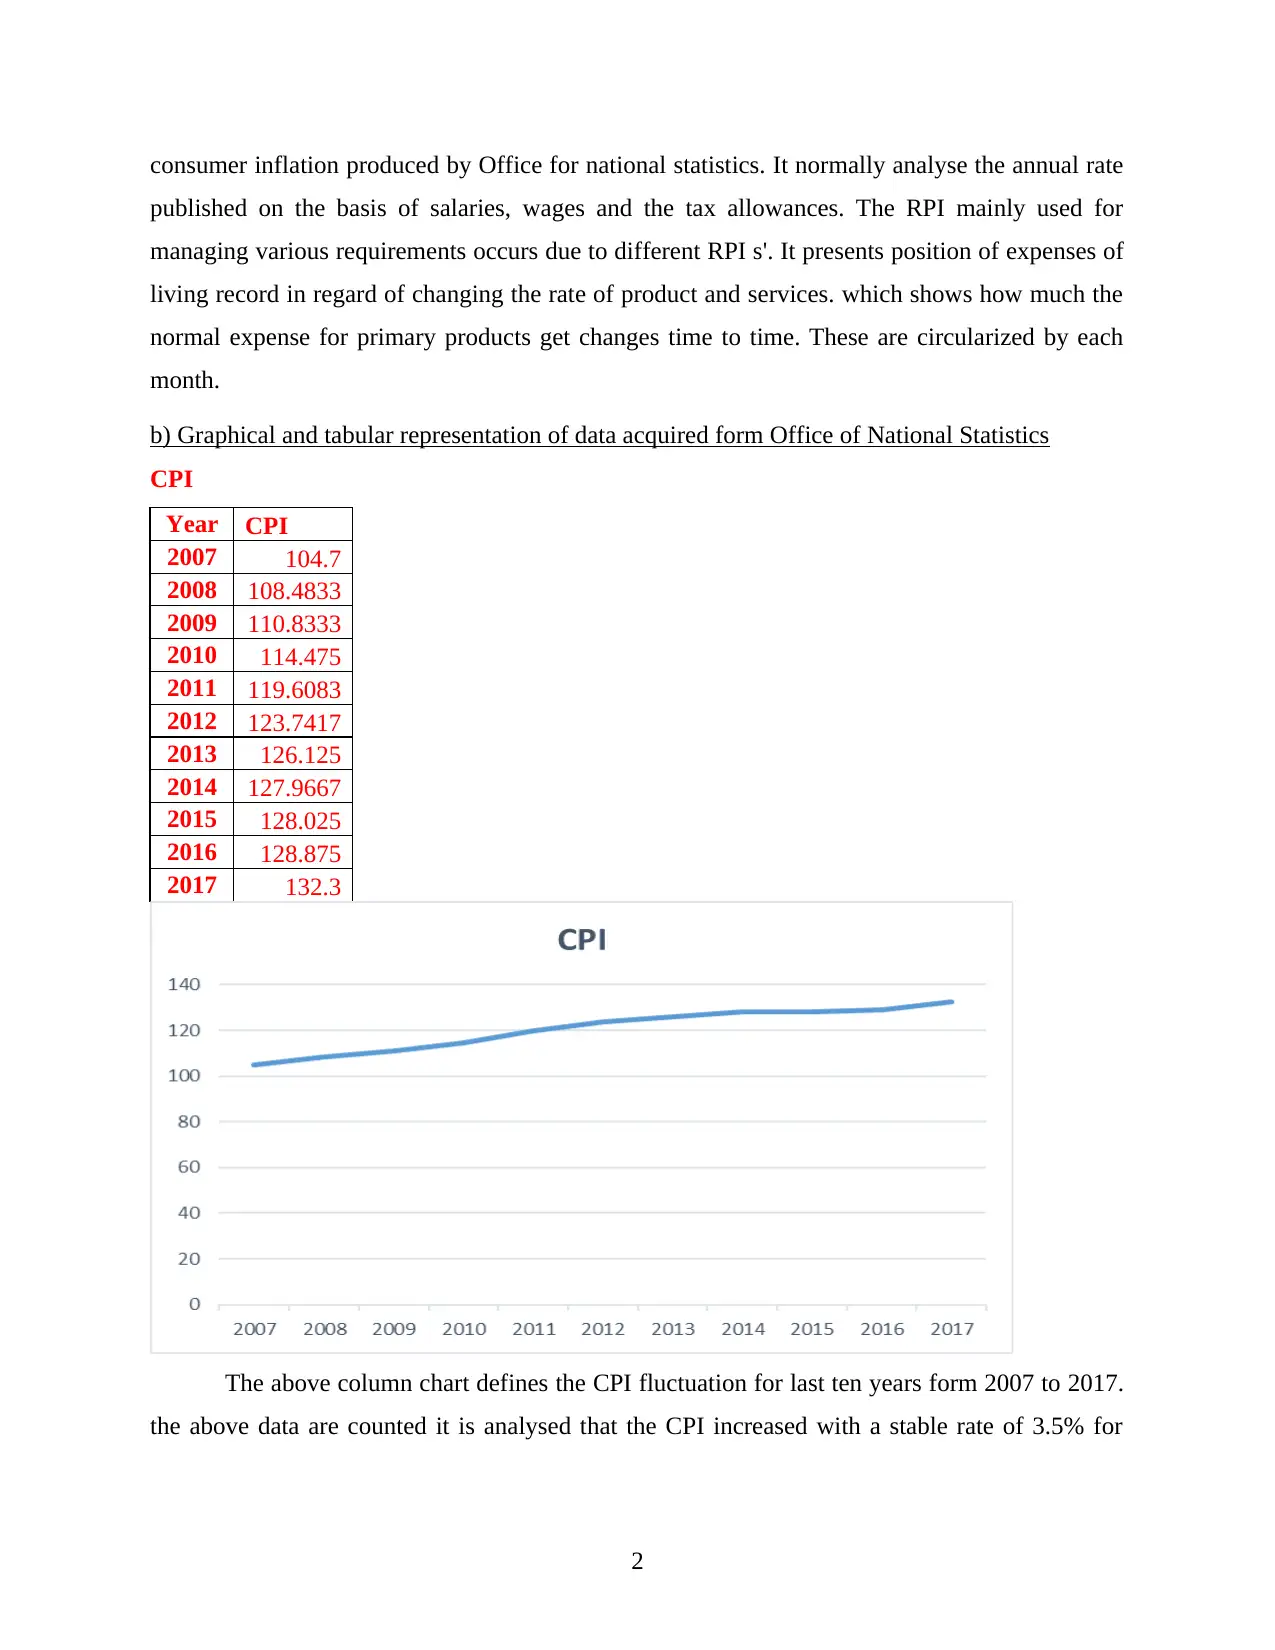
b) Graphical and tabular representation of data acquired form Office of National Statistics
CPI
Year CPI
2007 104.7
2008 108.4833
2009 110.8333
2010 114.475
2011 119.6083
2012 123.7417
2013 126.125
2014 127.9667
2015 128.025
2016 128.875
2017 132.3
The above column chart defines the CPI fluctuation for last ten years form 2007 to 2017.
the above data are counted it is analysed that the CPI increased with a stable rate of 3.5% for
2
published on the basis of salaries, wages and the tax allowances. The RPI mainly used for
managing various requirements occurs due to different RPI s'. It presents position of expenses of
living record in regard of changing the rate of product and services. which shows how much the
normal expense for primary products get changes time to time. These are circularized by each
month.
b) Graphical and tabular representation of data acquired form Office of National Statistics
CPI
Year CPI
2007 104.7
2008 108.4833
2009 110.8333
2010 114.475
2011 119.6083
2012 123.7417
2013 126.125
2014 127.9667
2015 128.025
2016 128.875
2017 132.3
The above column chart defines the CPI fluctuation for last ten years form 2007 to 2017.
the above data are counted it is analysed that the CPI increased with a stable rate of 3.5% for
2
Paraphrase This Document
Need a fresh take? Get an instant paraphrase of this document with our AI Paraphraser
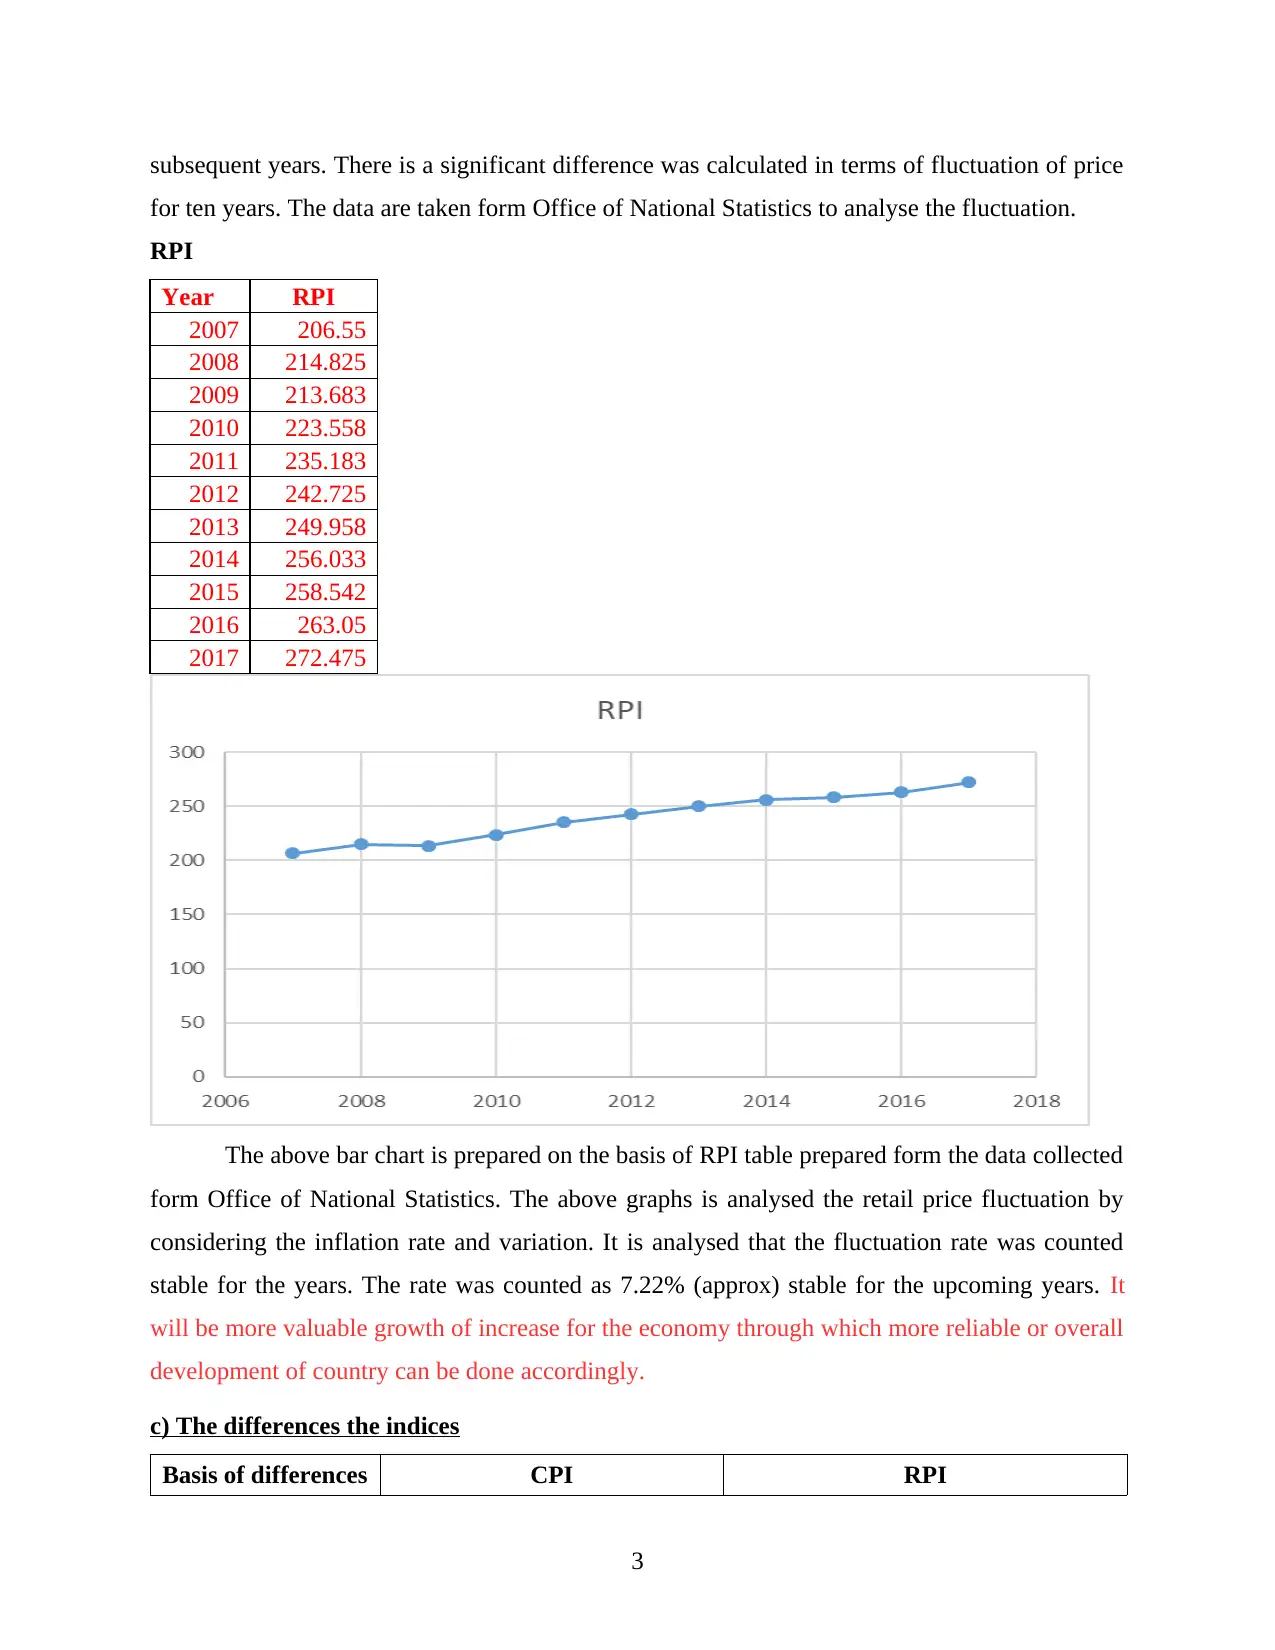
subsequent years. There is a significant difference was calculated in terms of fluctuation of price
for ten years. The data are taken form Office of National Statistics to analyse the fluctuation.
RPI
Year RPI
2007 206.55
2008 214.825
2009 213.683
2010 223.558
2011 235.183
2012 242.725
2013 249.958
2014 256.033
2015 258.542
2016 263.05
2017 272.475
The above bar chart is prepared on the basis of RPI table prepared form the data collected
form Office of National Statistics. The above graphs is analysed the retail price fluctuation by
considering the inflation rate and variation. It is analysed that the fluctuation rate was counted
stable for the years. The rate was counted as 7.22% (approx) stable for the upcoming years. It
will be more valuable growth of increase for the economy through which more reliable or overall
development of country can be done accordingly.
c) The differences the indices
Basis of differences CPI RPI
3
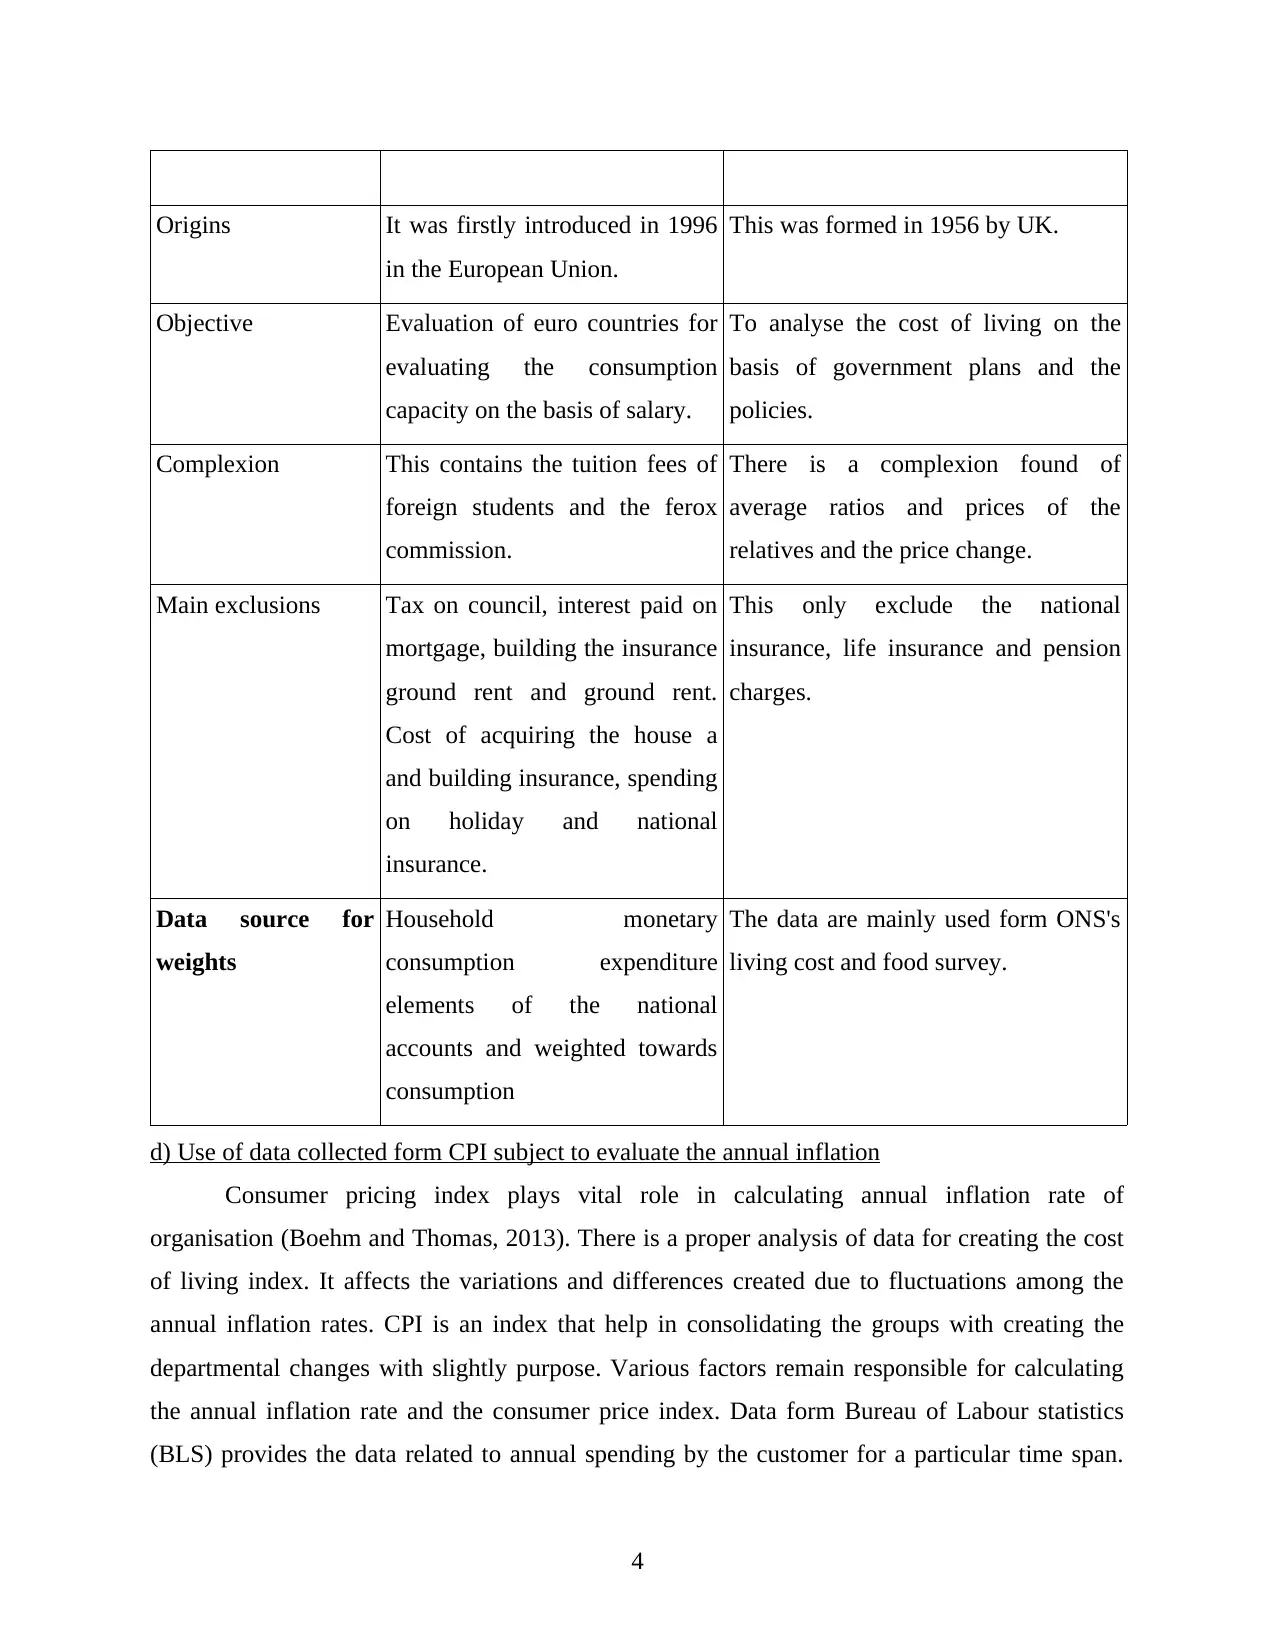
Origins It was firstly introduced in 1996
in the European Union.
This was formed in 1956 by UK.
Objective Evaluation of euro countries for
evaluating the consumption
capacity on the basis of salary.
To analyse the cost of living on the
basis of government plans and the
policies.
Complexion This contains the tuition fees of
foreign students and the ferox
commission.
There is a complexion found of
average ratios and prices of the
relatives and the price change.
Main exclusions Tax on council, interest paid on
mortgage, building the insurance
ground rent and ground rent.
Cost of acquiring the house a
and building insurance, spending
on holiday and national
insurance.
This only exclude the national
insurance, life insurance and pension
charges.
Data source for
weights
Household monetary
consumption expenditure
elements of the national
accounts and weighted towards
consumption
The data are mainly used form ONS's
living cost and food survey.
d) Use of data collected form CPI subject to evaluate the annual inflation
Consumer pricing index plays vital role in calculating annual inflation rate of
organisation (Boehm and Thomas, 2013). There is a proper analysis of data for creating the cost
of living index. It affects the variations and differences created due to fluctuations among the
annual inflation rates. CPI is an index that help in consolidating the groups with creating the
departmental changes with slightly purpose. Various factors remain responsible for calculating
the annual inflation rate and the consumer price index. Data form Bureau of Labour statistics
(BLS) provides the data related to annual spending by the customer for a particular time span.
4
⊘ This is a preview!⊘
Do you want full access?
Subscribe today to unlock all pages.
Trusted by 1+ million students worldwide
There are eight major sections are analysed for determining the price raised due to cost of
inflation and the energy costs. For determining the annual inflation rate it is required to have the
data related consumption for a particular time duration.
It not only helps to determine the healthy economic rate but also helps to analyse the
federal government use to analyse the economic policies for modification and preventing the
inflation rate.
e) Importance of rate of inflation and requirement
It is required to analyse the growth rate and consumer price index of organisation of an
economy. Inflation rate is the only component on the basis of organisation's performance and
GDP output is analysed and varied form each other (Brozović and Schlenker, 2011). The
inflation rate is the main aspect that helps in cumulative the percentage of management and the
retail price index for better change and development. CPI index and the consideration were
analysed with rate of payment of housing index. The housing rate was analysed in terms of
influencing the price separated with different categories.
At international level inflation rate plays vital role for organisers and the stakeholders. An
international investor or industry expect high returns on investments in respect of their
investment. After evaluating inflation rate investors be able to evaluate sustainability of products
and services. There is a rise of products and services indicates high rate of inflation and the
consumer price index. In simple words the fluctuation in inflation rate helps in consolidating the
measurements with proper evaluation of financial markets.
ACTIVITY 2
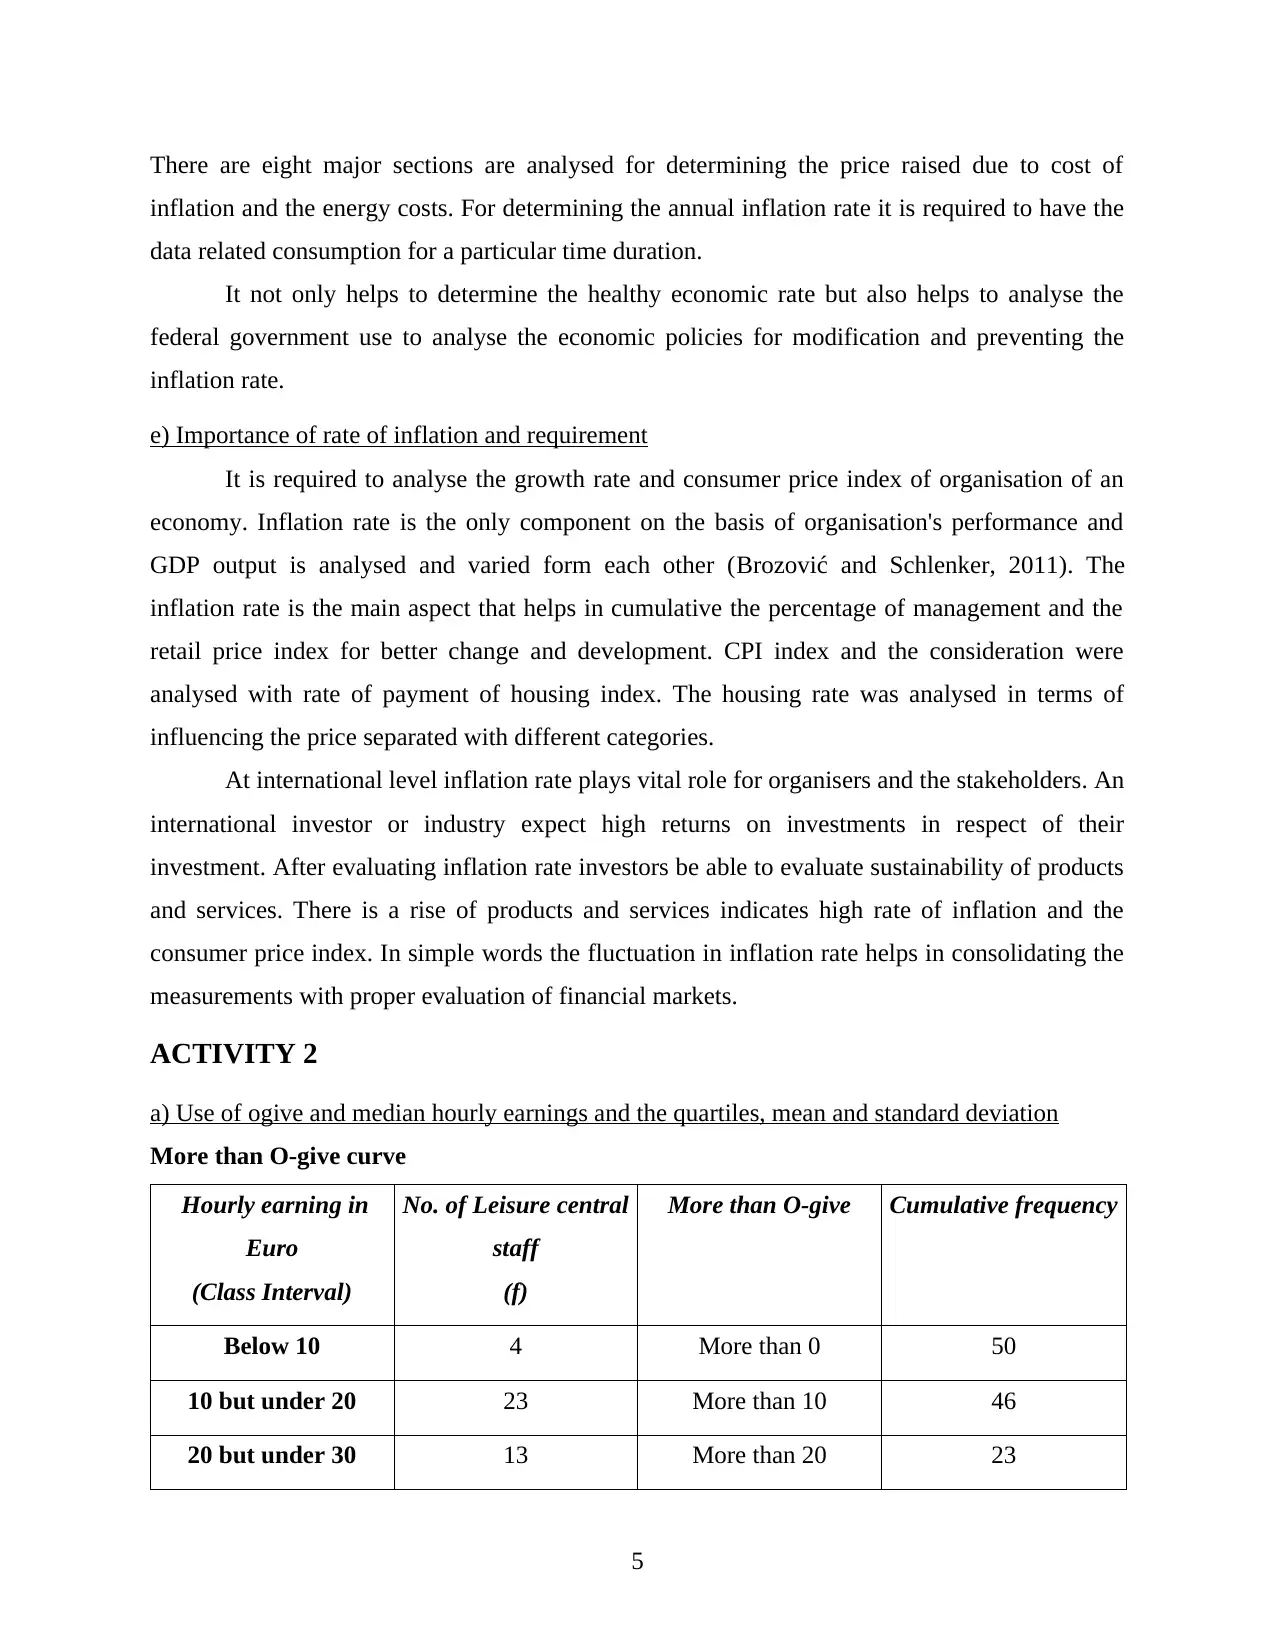
a) Use of ogive and median hourly earnings and the quartiles, mean and standard deviation
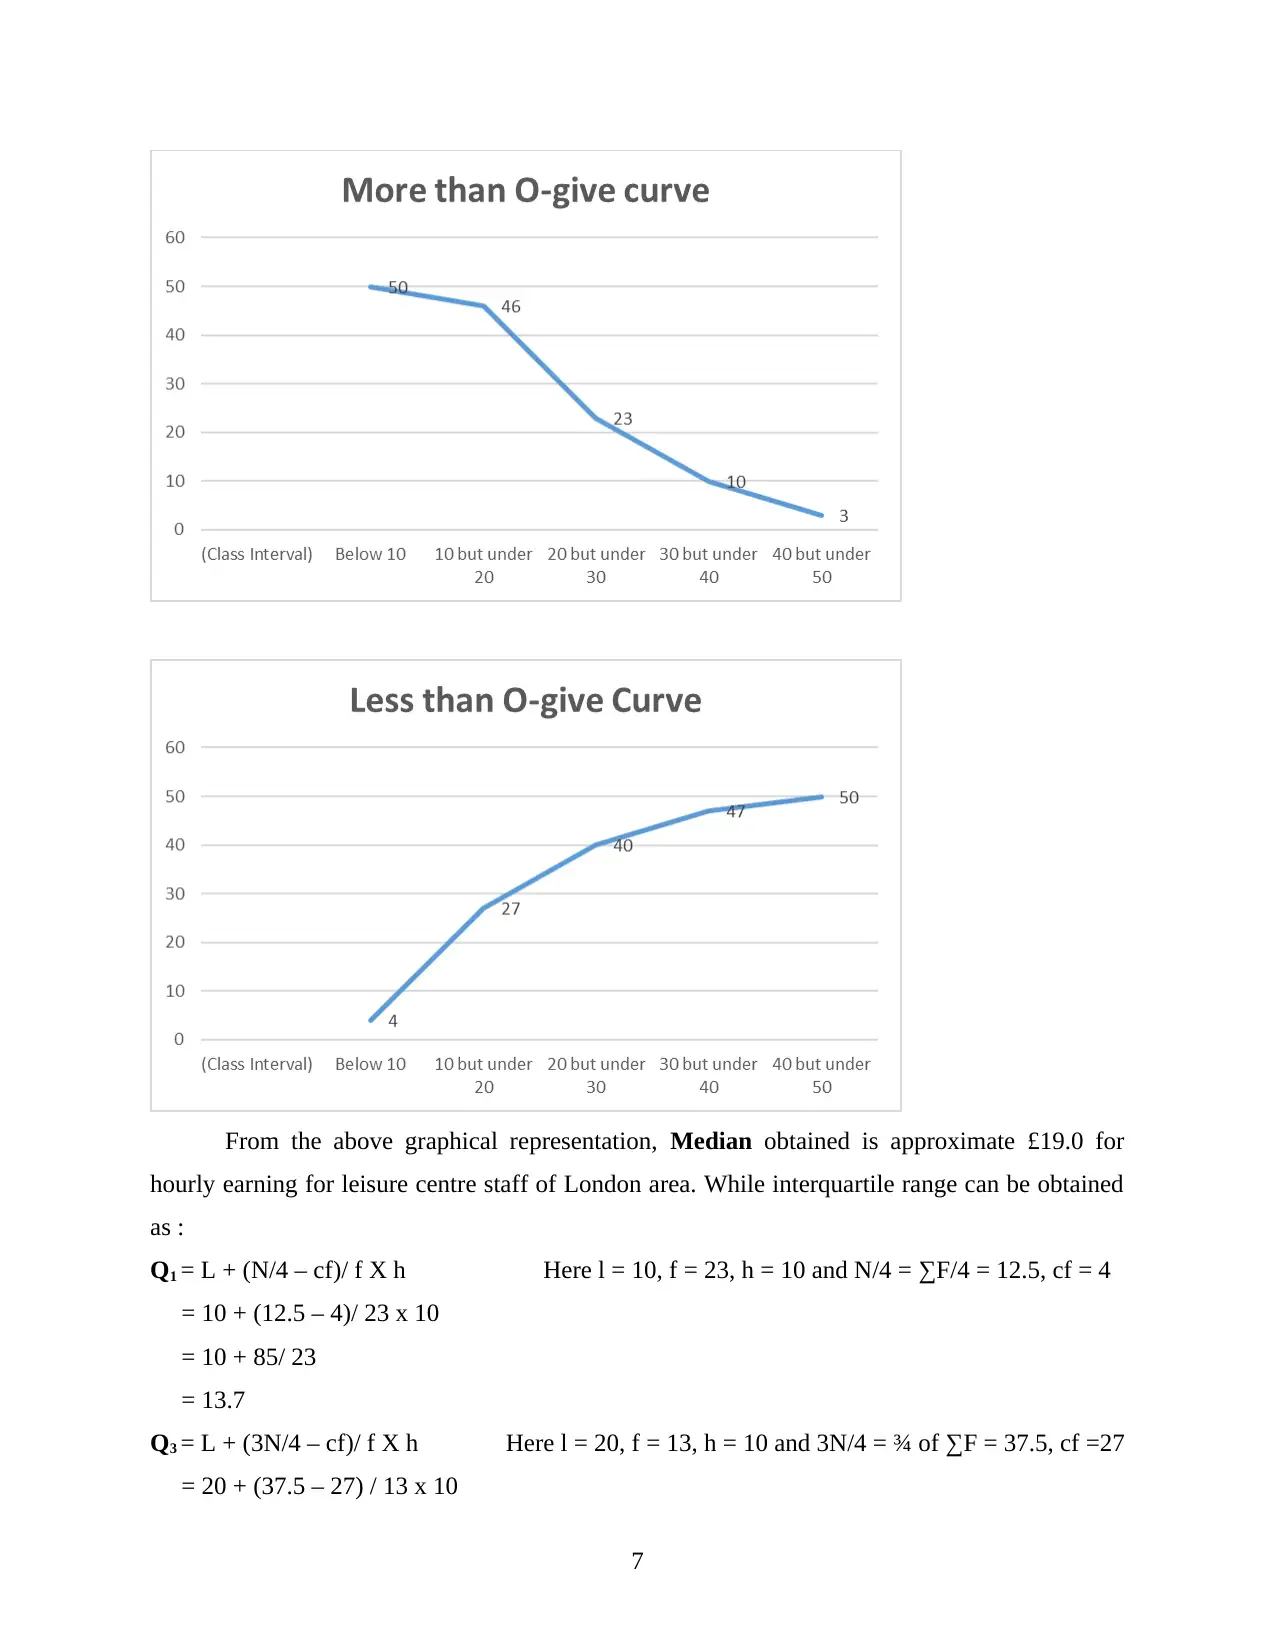
More than O-give curve
Hourly earning in
Euro
(Class Interval)
No. of Leisure central
staff
(f)
More than O-give Cumulative frequency
Below 10 4 More than 0 50
10 but under 20 23 More than 10 46
20 but under 30 13 More than 20 23
5
inflation and the energy costs. For determining the annual inflation rate it is required to have the
data related consumption for a particular time duration.
It not only helps to determine the healthy economic rate but also helps to analyse the
federal government use to analyse the economic policies for modification and preventing the
inflation rate.
e) Importance of rate of inflation and requirement
It is required to analyse the growth rate and consumer price index of organisation of an
economy. Inflation rate is the only component on the basis of organisation's performance and
GDP output is analysed and varied form each other (Brozović and Schlenker, 2011). The
inflation rate is the main aspect that helps in cumulative the percentage of management and the
retail price index for better change and development. CPI index and the consideration were
analysed with rate of payment of housing index. The housing rate was analysed in terms of
influencing the price separated with different categories.
At international level inflation rate plays vital role for organisers and the stakeholders. An
international investor or industry expect high returns on investments in respect of their
investment. After evaluating inflation rate investors be able to evaluate sustainability of products
and services. There is a rise of products and services indicates high rate of inflation and the
consumer price index. In simple words the fluctuation in inflation rate helps in consolidating the
measurements with proper evaluation of financial markets.
ACTIVITY 2
a) Use of ogive and median hourly earnings and the quartiles, mean and standard deviation
More than O-give curve
Hourly earning in
Euro
(Class Interval)
No. of Leisure central
staff
(f)
More than O-give Cumulative frequency
Below 10 4 More than 0 50
10 but under 20 23 More than 10 46
20 but under 30 13 More than 20 23
5
Paraphrase This Document
Need a fresh take? Get an instant paraphrase of this document with our AI Paraphraser
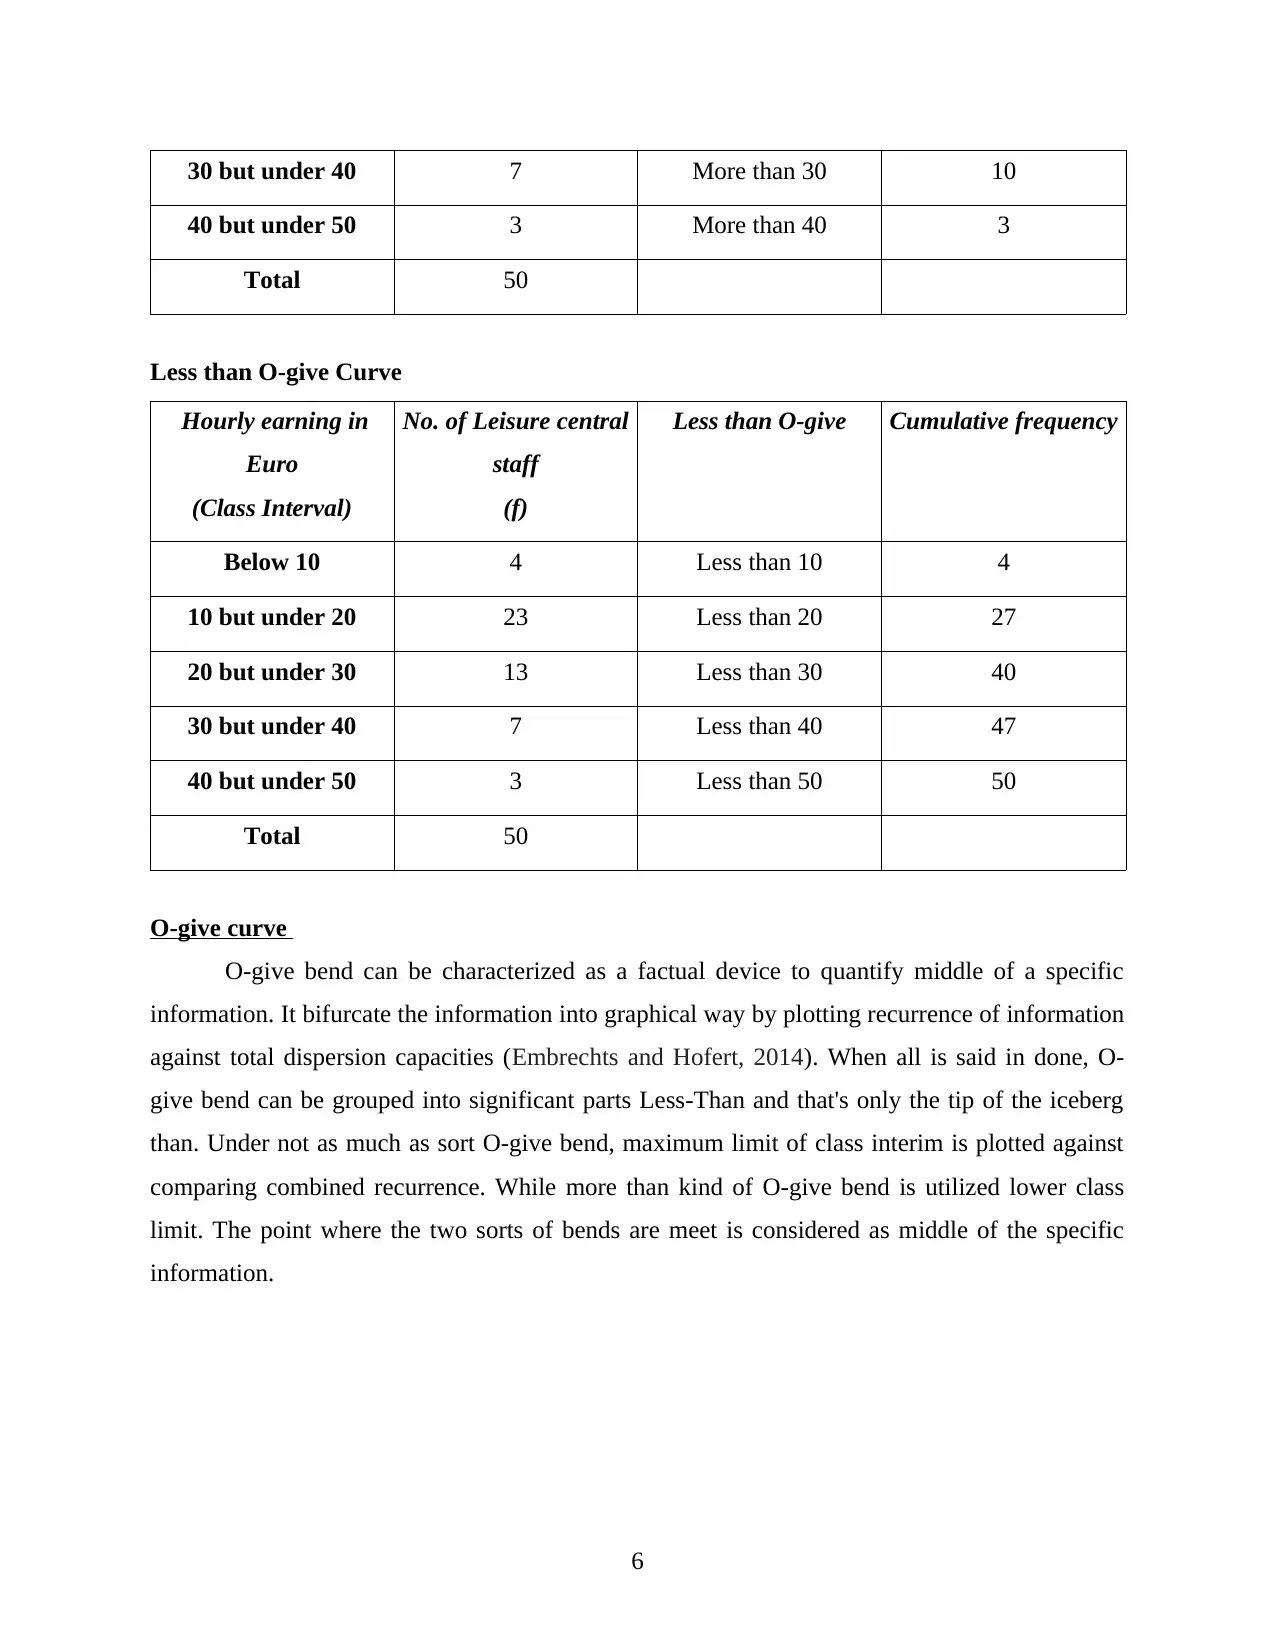
30 but under 40 7 More than 30 10
40 but under 50 3 More than 40 3
Total 50
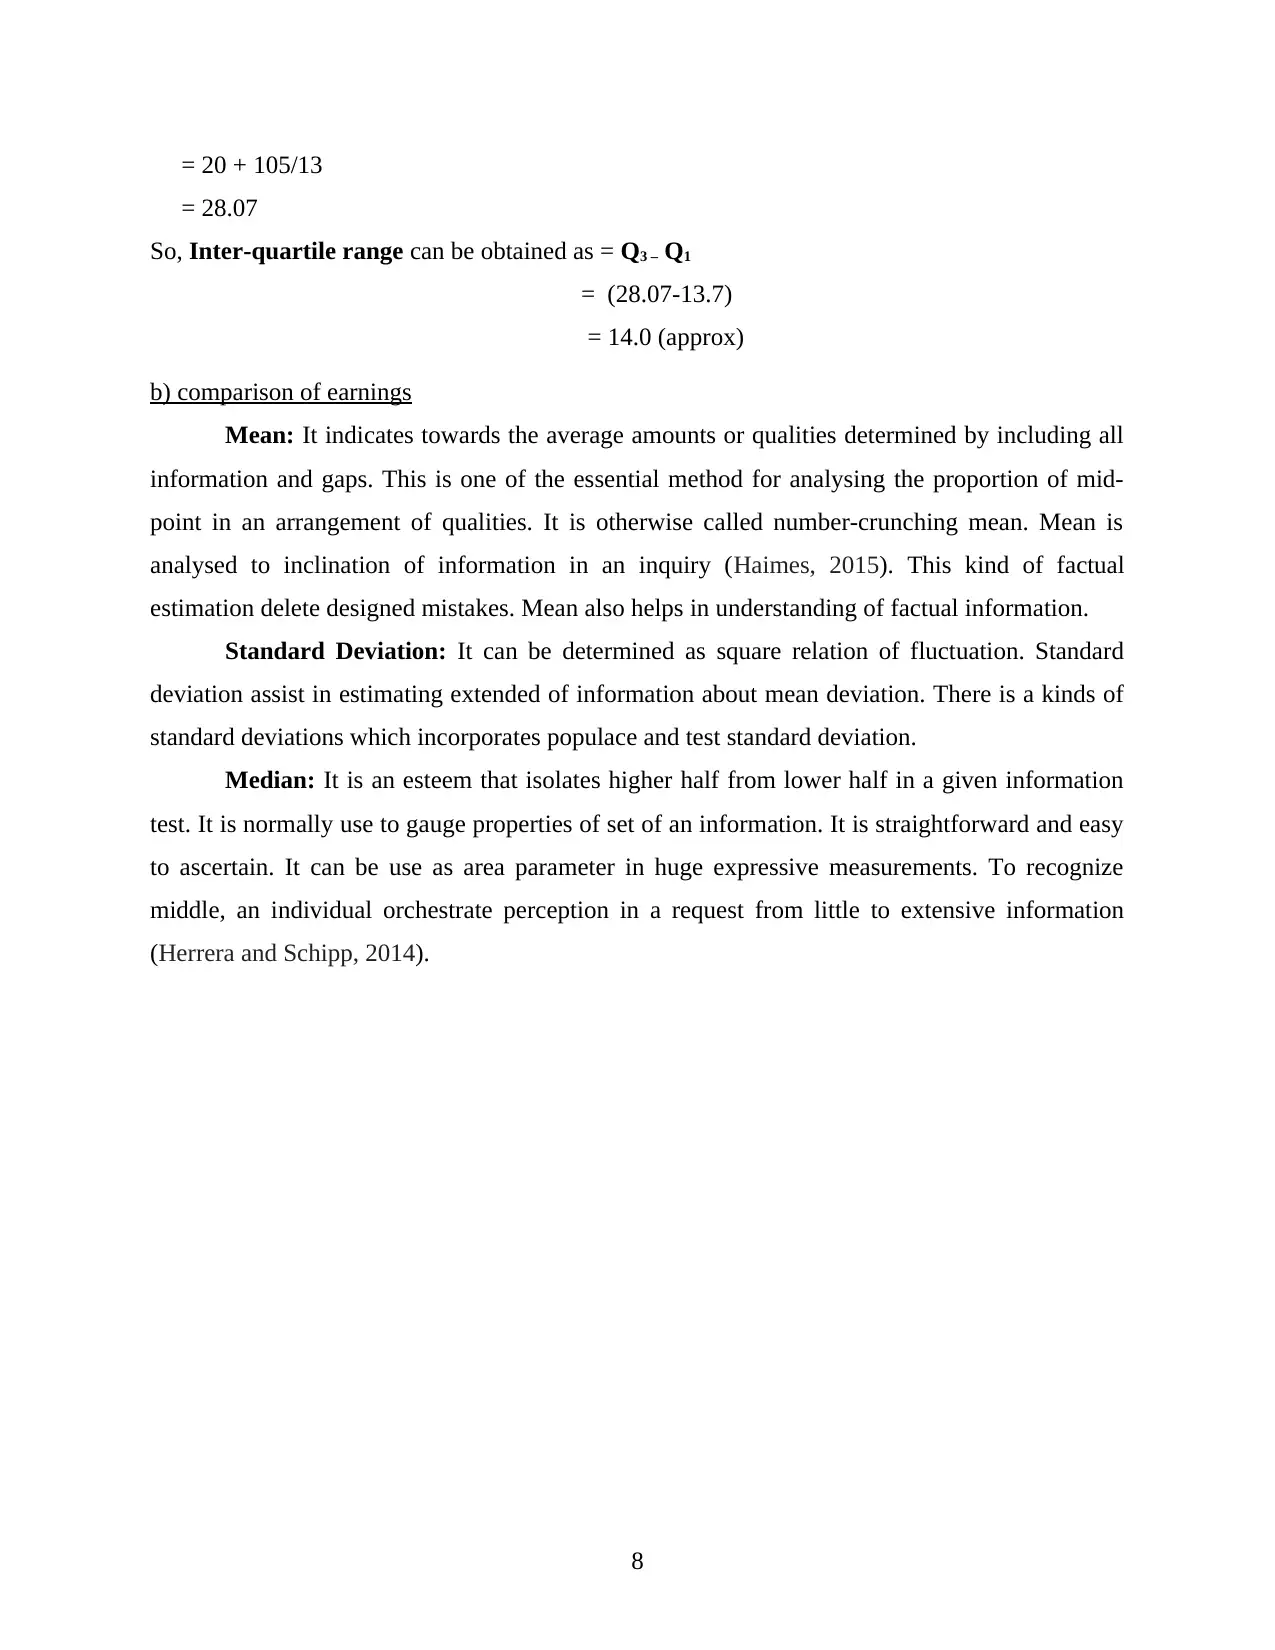
Less than O-give Curve
Hourly earning in
Euro
(Class Interval)
No. of Leisure central
staff
(f)
Less than O-give Cumulative frequency
Below 10 4 Less than 10 4
10 but under 20 23 Less than 20 27
20 but under 30 13 Less than 30 40
30 but under 40 7 Less than 40 47
40 but under 50 3 Less than 50 50
Total 50
O-give curve
O-give bend can be characterized as a factual device to quantify middle of a specific
information. It bifurcate the information into graphical way by plotting recurrence of information
against total dispersion capacities (Embrechts and Hofert, 2014). When all is said in done, O-
give bend can be grouped into significant parts Less-Than and that's only the tip of the iceberg
than. Under not as much as sort O-give bend, maximum limit of class interim is plotted against
comparing combined recurrence. While more than kind of O-give bend is utilized lower class
limit. The point where the two sorts of bends are meet is considered as middle of the specific
information.
6
40 but under 50 3 More than 40 3
Total 50
Less than O-give Curve
Hourly earning in
Euro
(Class Interval)
No. of Leisure central
staff
(f)
Less than O-give Cumulative frequency
Below 10 4 Less than 10 4
10 but under 20 23 Less than 20 27
20 but under 30 13 Less than 30 40
30 but under 40 7 Less than 40 47
40 but under 50 3 Less than 50 50
Total 50
O-give curve
O-give bend can be characterized as a factual device to quantify middle of a specific
information. It bifurcate the information into graphical way by plotting recurrence of information
against total dispersion capacities (Embrechts and Hofert, 2014). When all is said in done, O-
give bend can be grouped into significant parts Less-Than and that's only the tip of the iceberg
than. Under not as much as sort O-give bend, maximum limit of class interim is plotted against
comparing combined recurrence. While more than kind of O-give bend is utilized lower class
limit. The point where the two sorts of bends are meet is considered as middle of the specific
information.
6
From the above graphical representation, Median obtained is approximate £19.0 for
hourly earning for leisure centre staff of London area. While interquartile range can be obtained
as :
Q1 = L + (N/4 – cf)/ f X h Here l = 10, f = 23, h = 10 and N/4 = ∑F/4 = 12.5, cf = 4
= 10 + (12.5 – 4)/ 23 x 10
= 10 + 85/ 23
= 13.7
Q3 = L + (3N/4 – cf)/ f X h Here l = 20, f = 13, h = 10 and 3N/4 = ¾ of ∑F = 37.5, cf =27
= 20 + (37.5 – 27) / 13 x 10
7
⊘ This is a preview!⊘
Do you want full access?
Subscribe today to unlock all pages.
Trusted by 1+ million students worldwide
= 20 + 105/13
= 28.07
So, Inter-quartile range can be obtained as = Q3 – Q1
= (28.07-13.7)
= 14.0 (approx)
b) comparison of earnings
Mean: It indicates towards the average amounts or qualities determined by including all
information and gaps. This is one of the essential method for analysing the proportion of mid-
point in an arrangement of qualities. It is otherwise called number-crunching mean. Mean is
analysed to inclination of information in an inquiry (Haimes, 2015). This kind of factual
estimation delete designed mistakes. Mean also helps in understanding of factual information.
Standard Deviation: It can be determined as square relation of fluctuation. Standard
deviation assist in estimating extended of information about mean deviation. There is a kinds of
standard deviations which incorporates populace and test standard deviation.
Median: It is an esteem that isolates higher half from lower half in a given information
test. It is normally use to gauge properties of set of an information. It is straightforward and easy
to ascertain. It can be use as area parameter in huge expressive measurements. To recognize
middle, an individual orchestrate perception in a request from little to extensive information
(Herrera and Schipp, 2014).
8
Paraphrase This Document
Need a fresh take? Get an instant paraphrase of this document with our AI Paraphraser
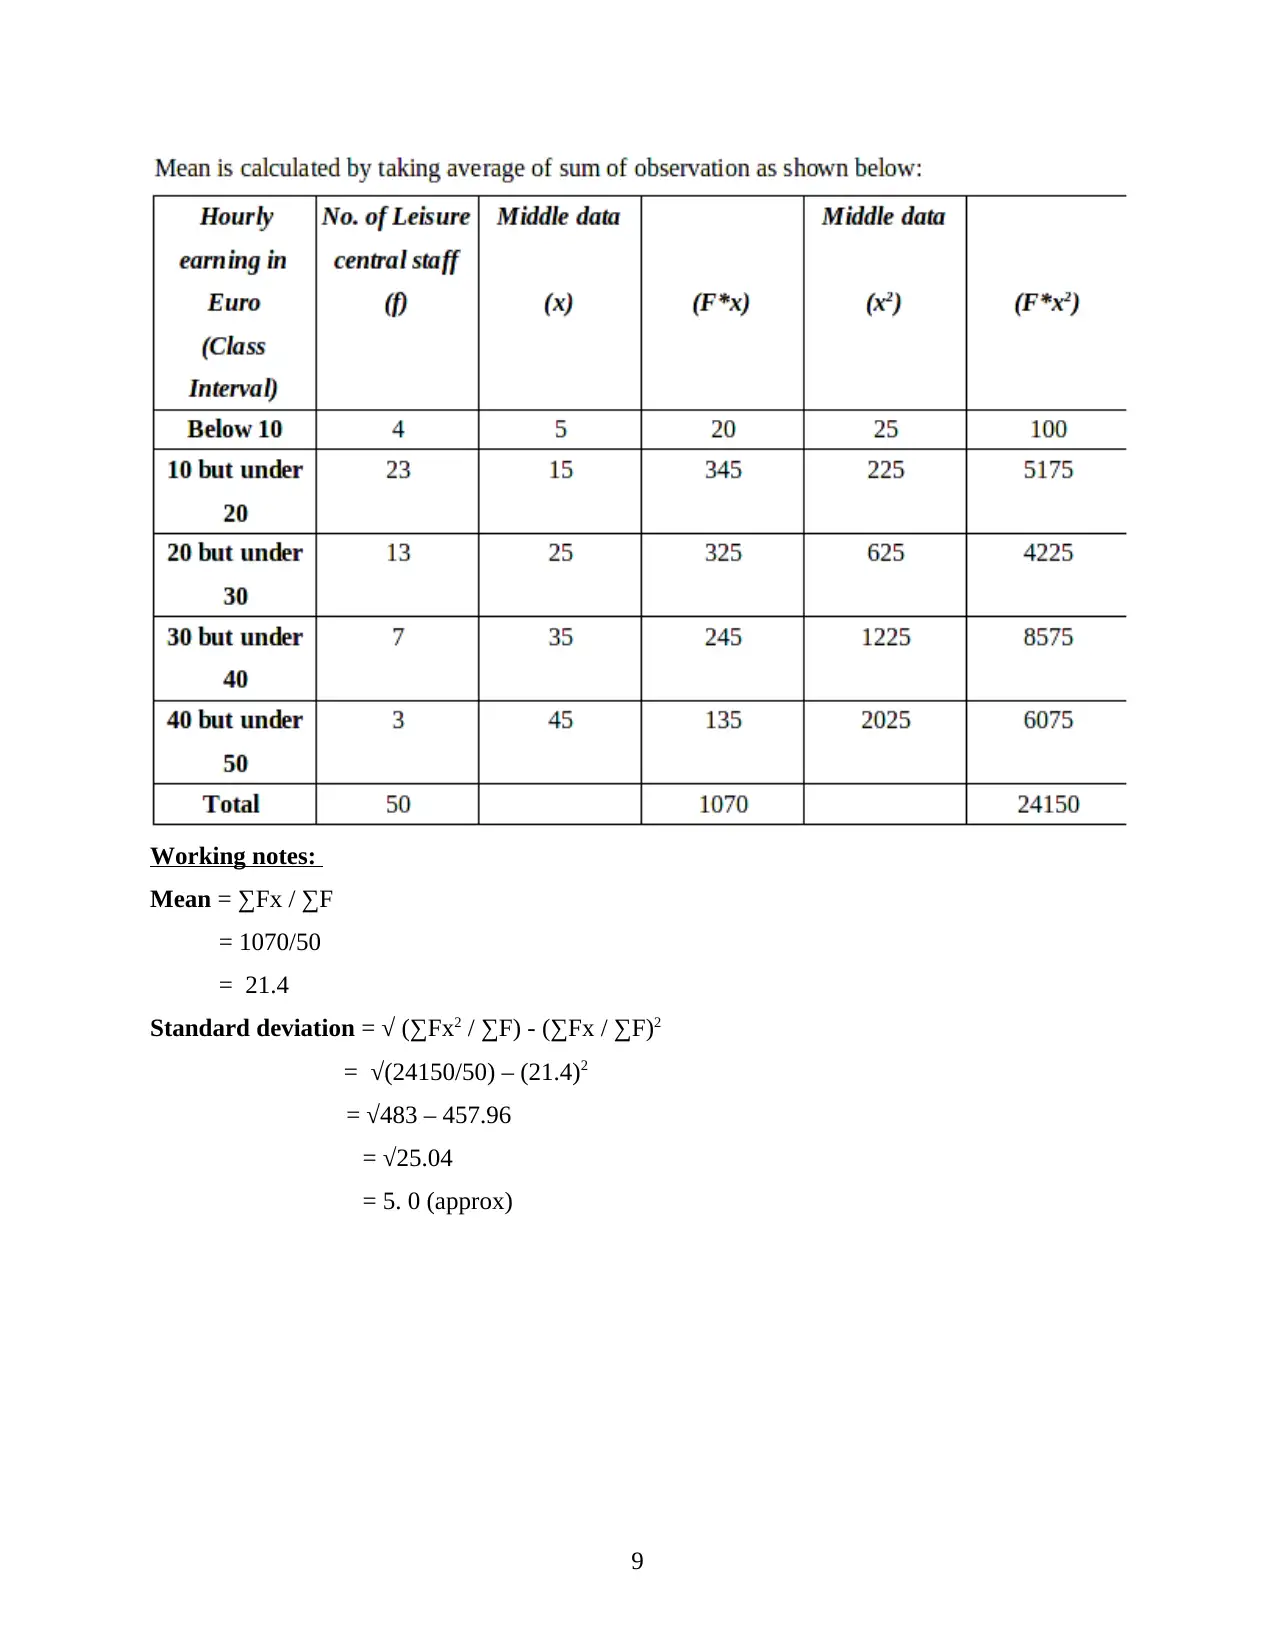
Working notes:
Mean = ∑Fx / ∑F
= 1070/50
= 21.4
Standard deviation = √ (∑Fx2 / ∑F) - (∑Fx / ∑F)2
= √(24150/50) – (21.4)2
= √483 – 457.96
= √25.04
= 5. 0 (approx)
9
Mean = ∑Fx / ∑F
= 1070/50
= 21.4
Standard deviation = √ (∑Fx2 / ∑F) - (∑Fx / ∑F)2
= √(24150/50) – (21.4)2
= √483 – 457.96
= √25.04
= 5. 0 (approx)
9
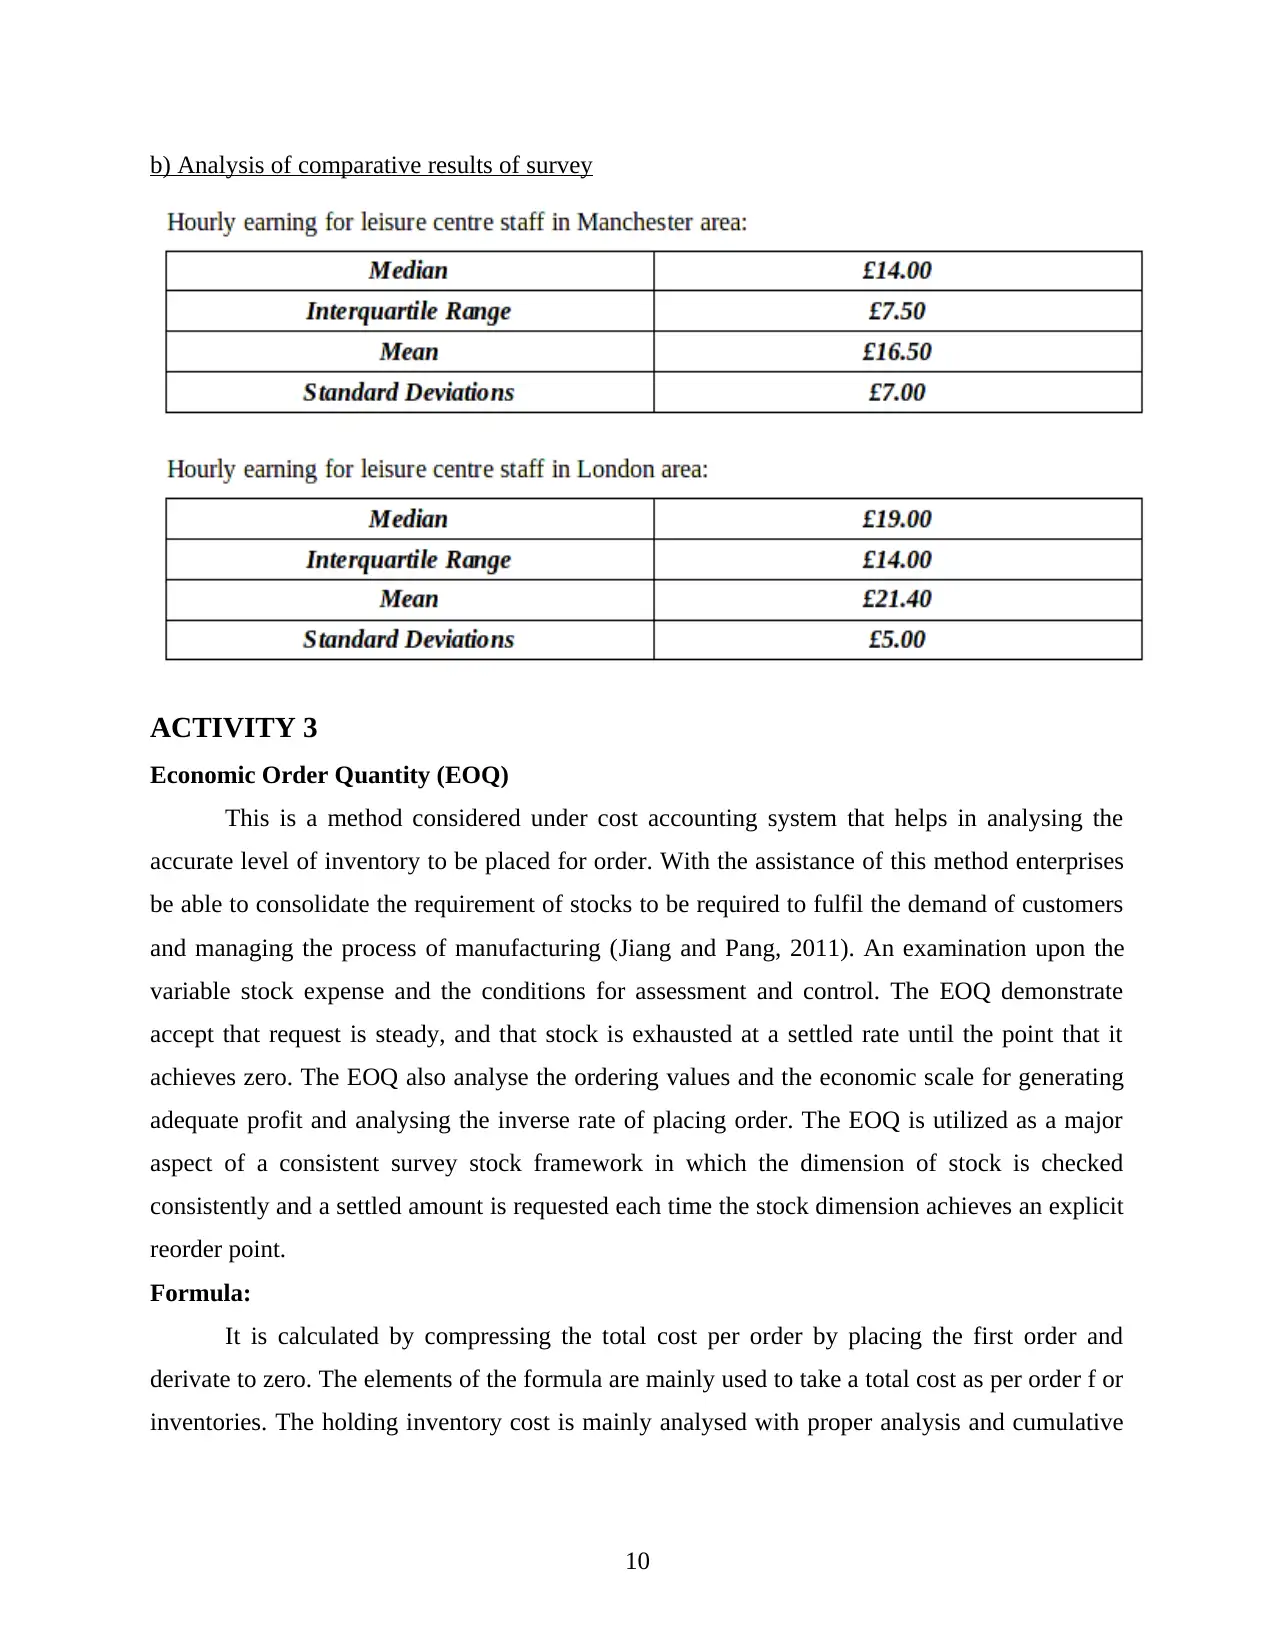
b) Analysis of comparative results of survey
ACTIVITY 3
Economic Order Quantity (EOQ)
This is a method considered under cost accounting system that helps in analysing the
accurate level of inventory to be placed for order. With the assistance of this method enterprises
be able to consolidate the requirement of stocks to be required to fulfil the demand of customers
and managing the process of manufacturing (Jiang and Pang, 2011). An examination upon the
variable stock expense and the conditions for assessment and control. The EOQ demonstrate
accept that request is steady, and that stock is exhausted at a settled rate until the point that it
achieves zero. The EOQ also analyse the ordering values and the economic scale for generating
adequate profit and analysing the inverse rate of placing order. The EOQ is utilized as a major
aspect of a consistent survey stock framework in which the dimension of stock is checked
consistently and a settled amount is requested each time the stock dimension achieves an explicit
reorder point.
Formula:
It is calculated by compressing the total cost per order by placing the first order and
derivate to zero. The elements of the formula are mainly used to take a total cost as per order f or
inventories. The holding inventory cost is mainly analysed with proper analysis and cumulative
10
⊘ This is a preview!⊘
Do you want full access?
Subscribe today to unlock all pages.
Trusted by 1+ million students worldwide
1 out of 19
Related Documents


Your All-in-One AI-Powered Toolkit for Academic Success.
+13062052269
info@desklib.com
Available 24*7 on WhatsApp / Email
![[object Object]](/_next/static/media/star-bottom.7253800d.svg)
Unlock your academic potential
Copyright © 2020–2026 A2Z Services. All Rights Reserved. Developed and managed by ZUCOL.