Statistical Report: Evaluating Business Data for Management
VerifiedAdded on 2021/02/21
|19
|2579
|147
Report
AI Summary
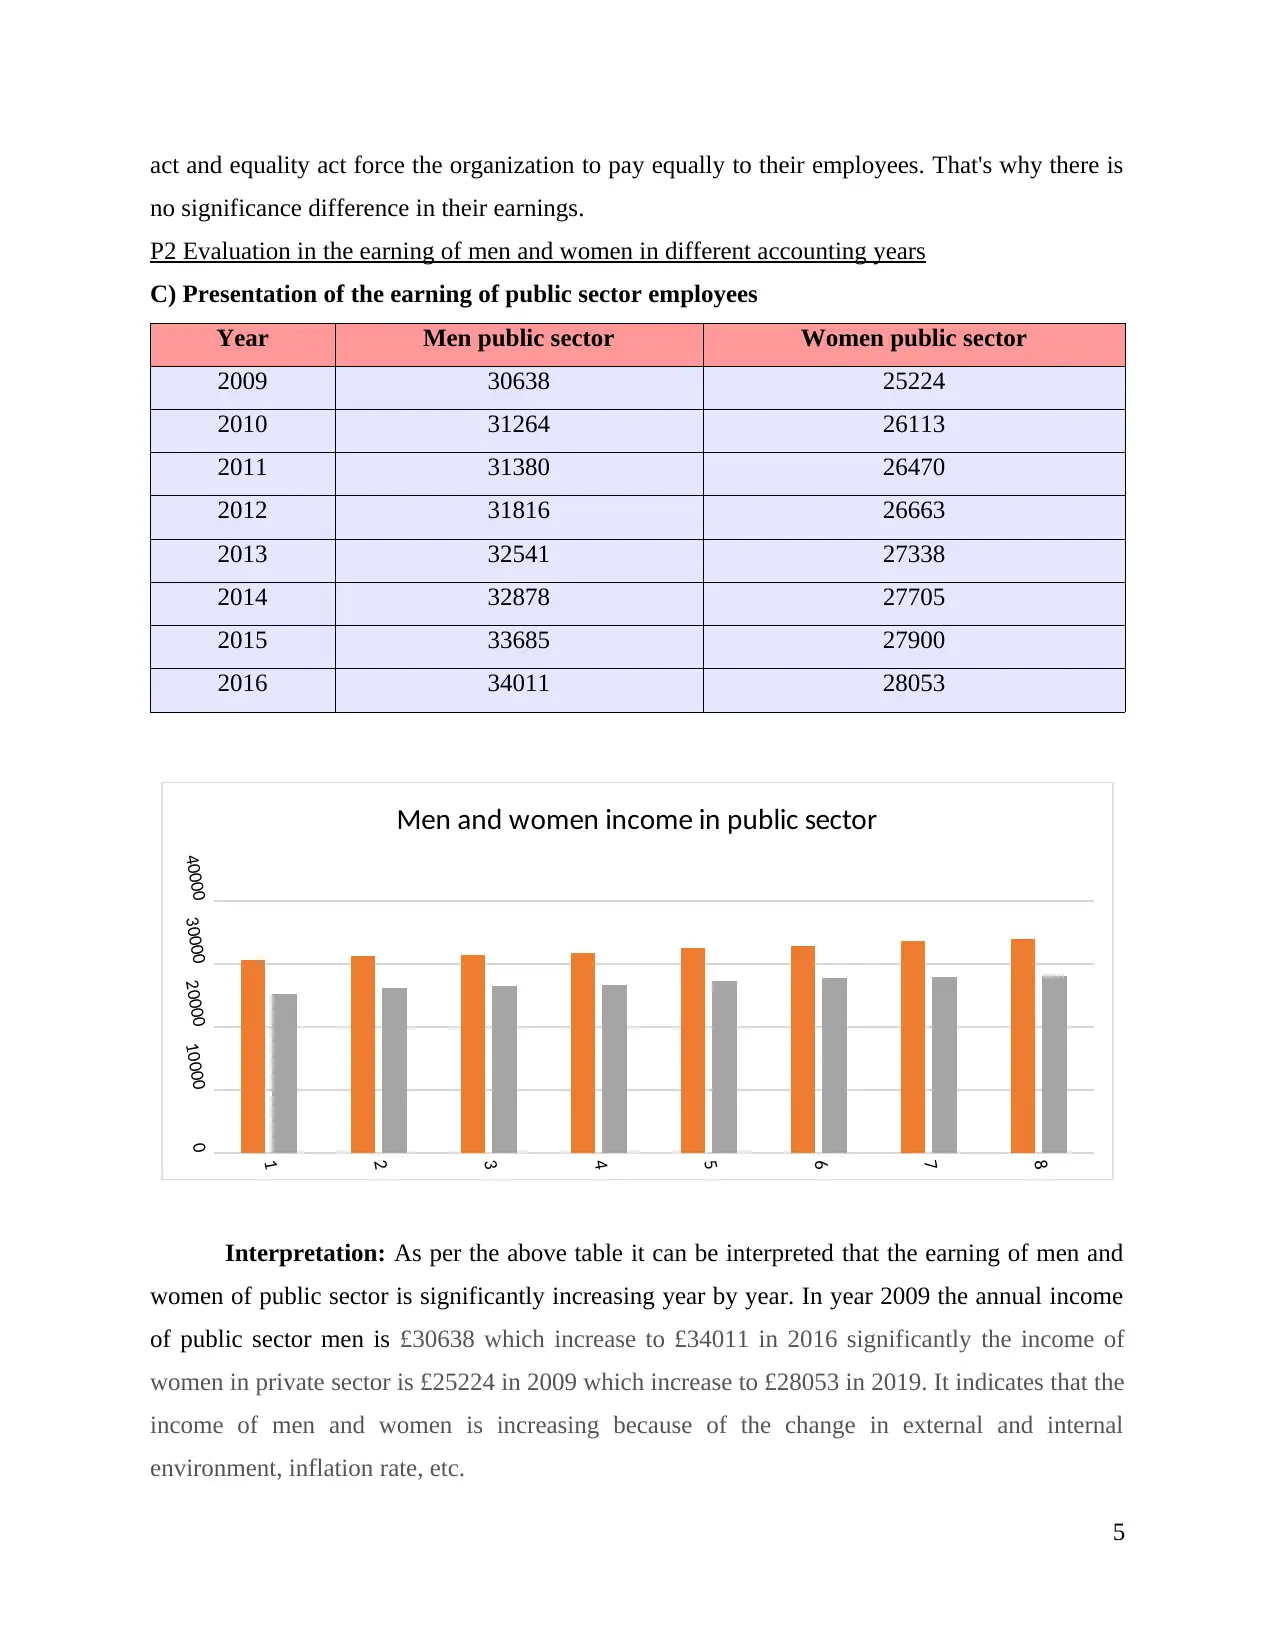
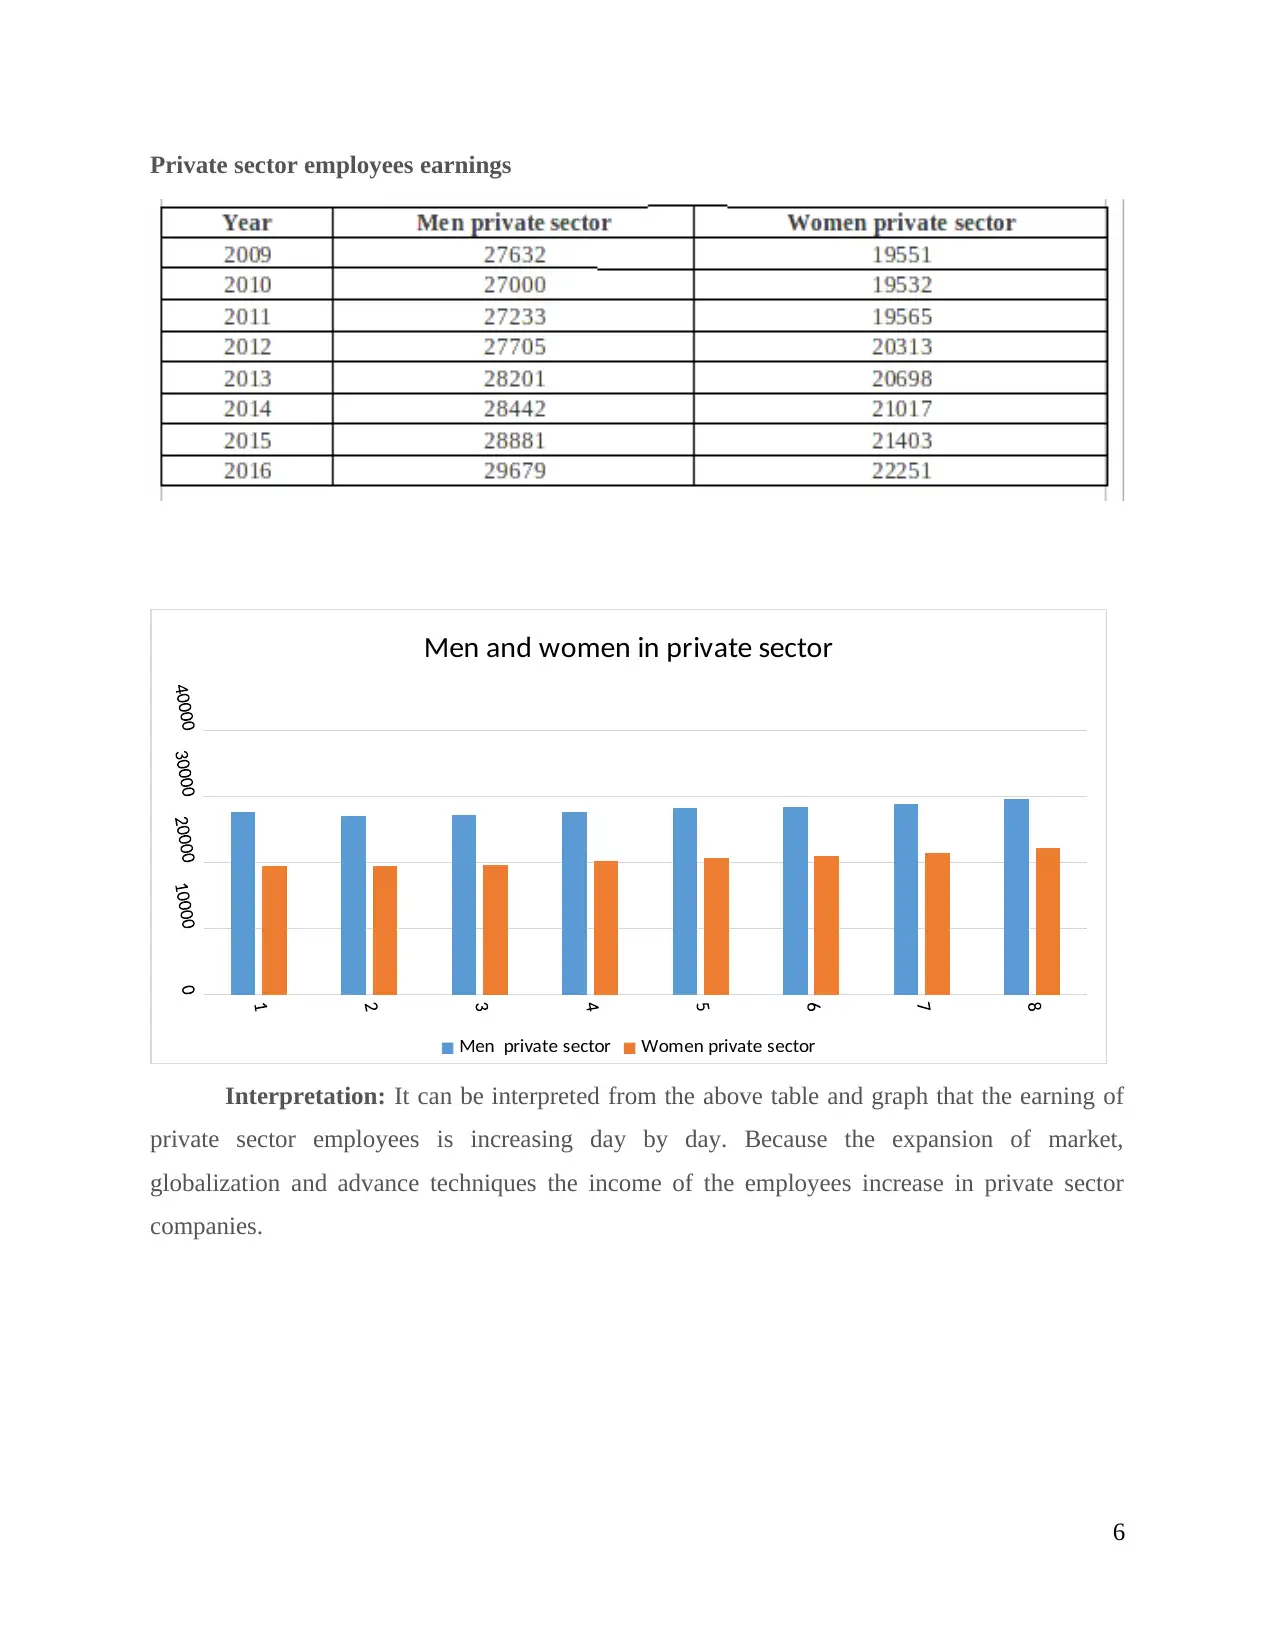
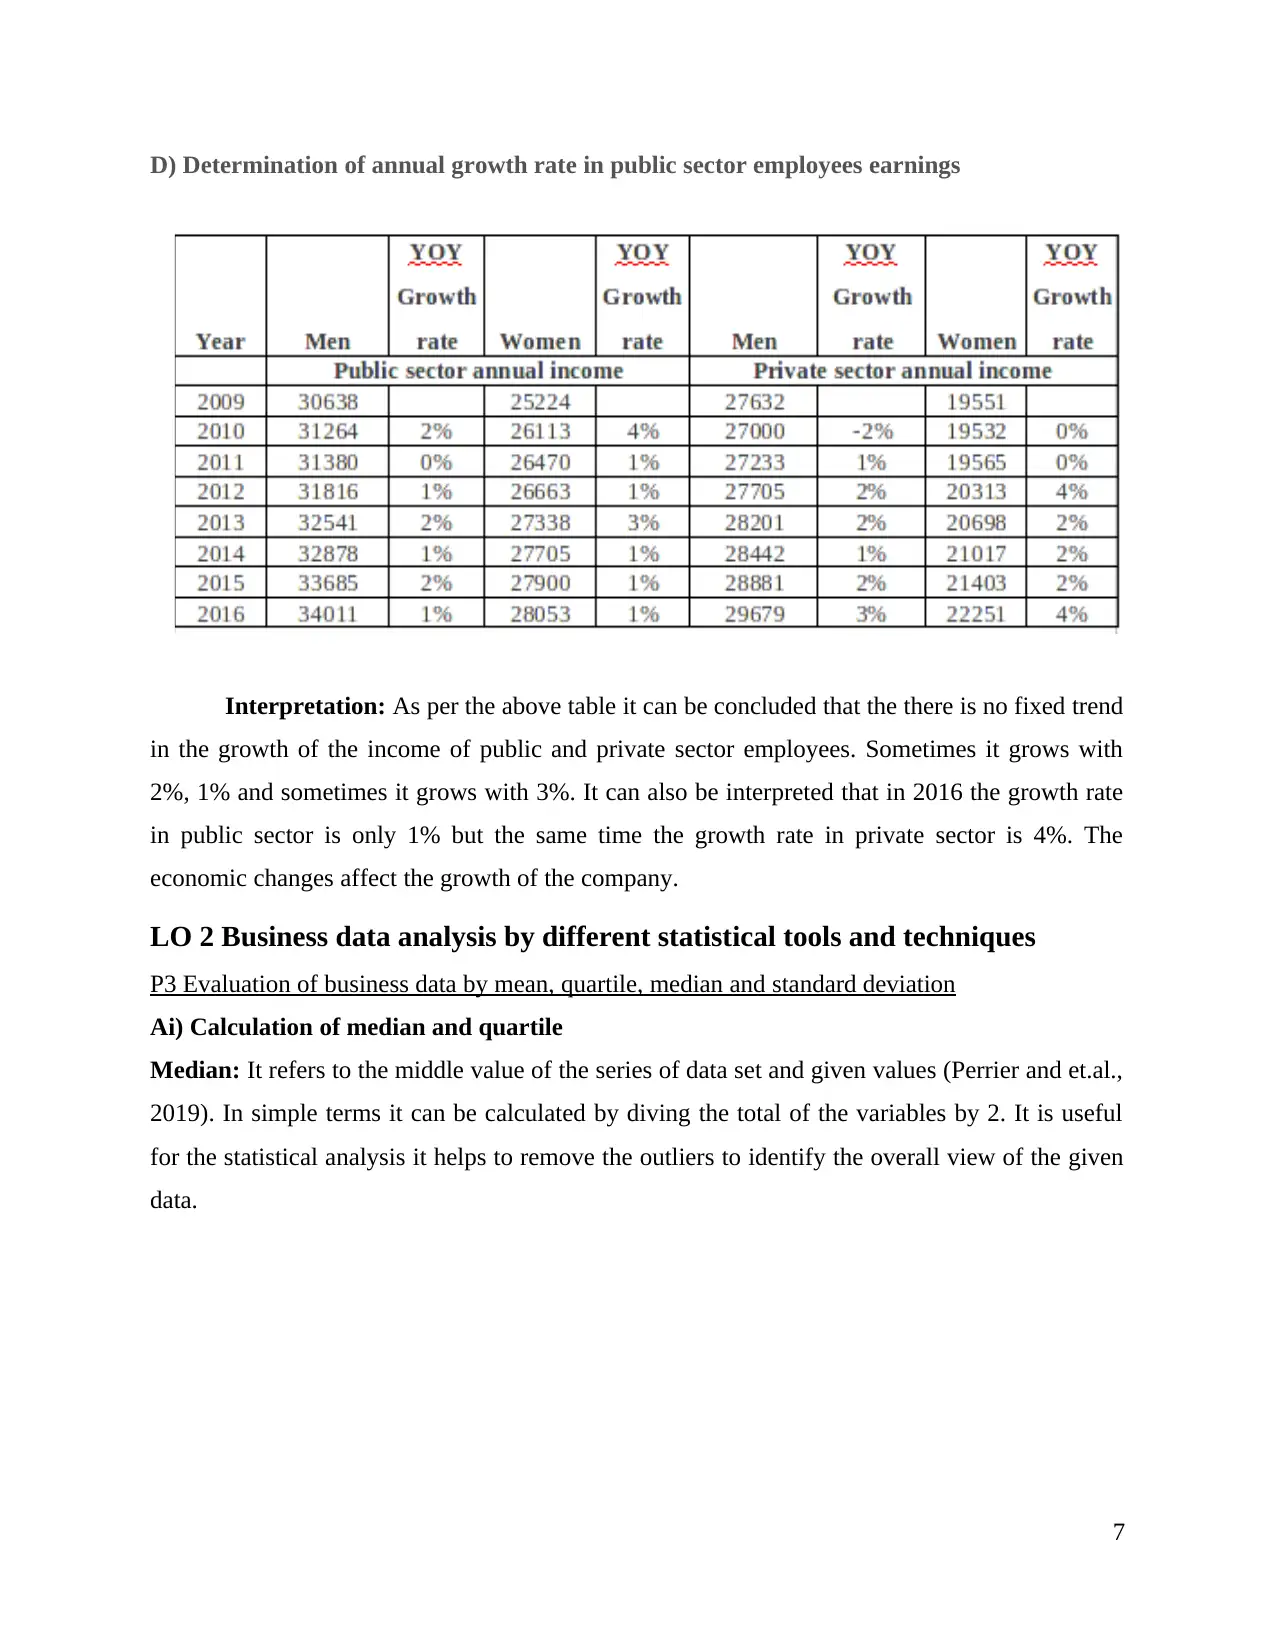
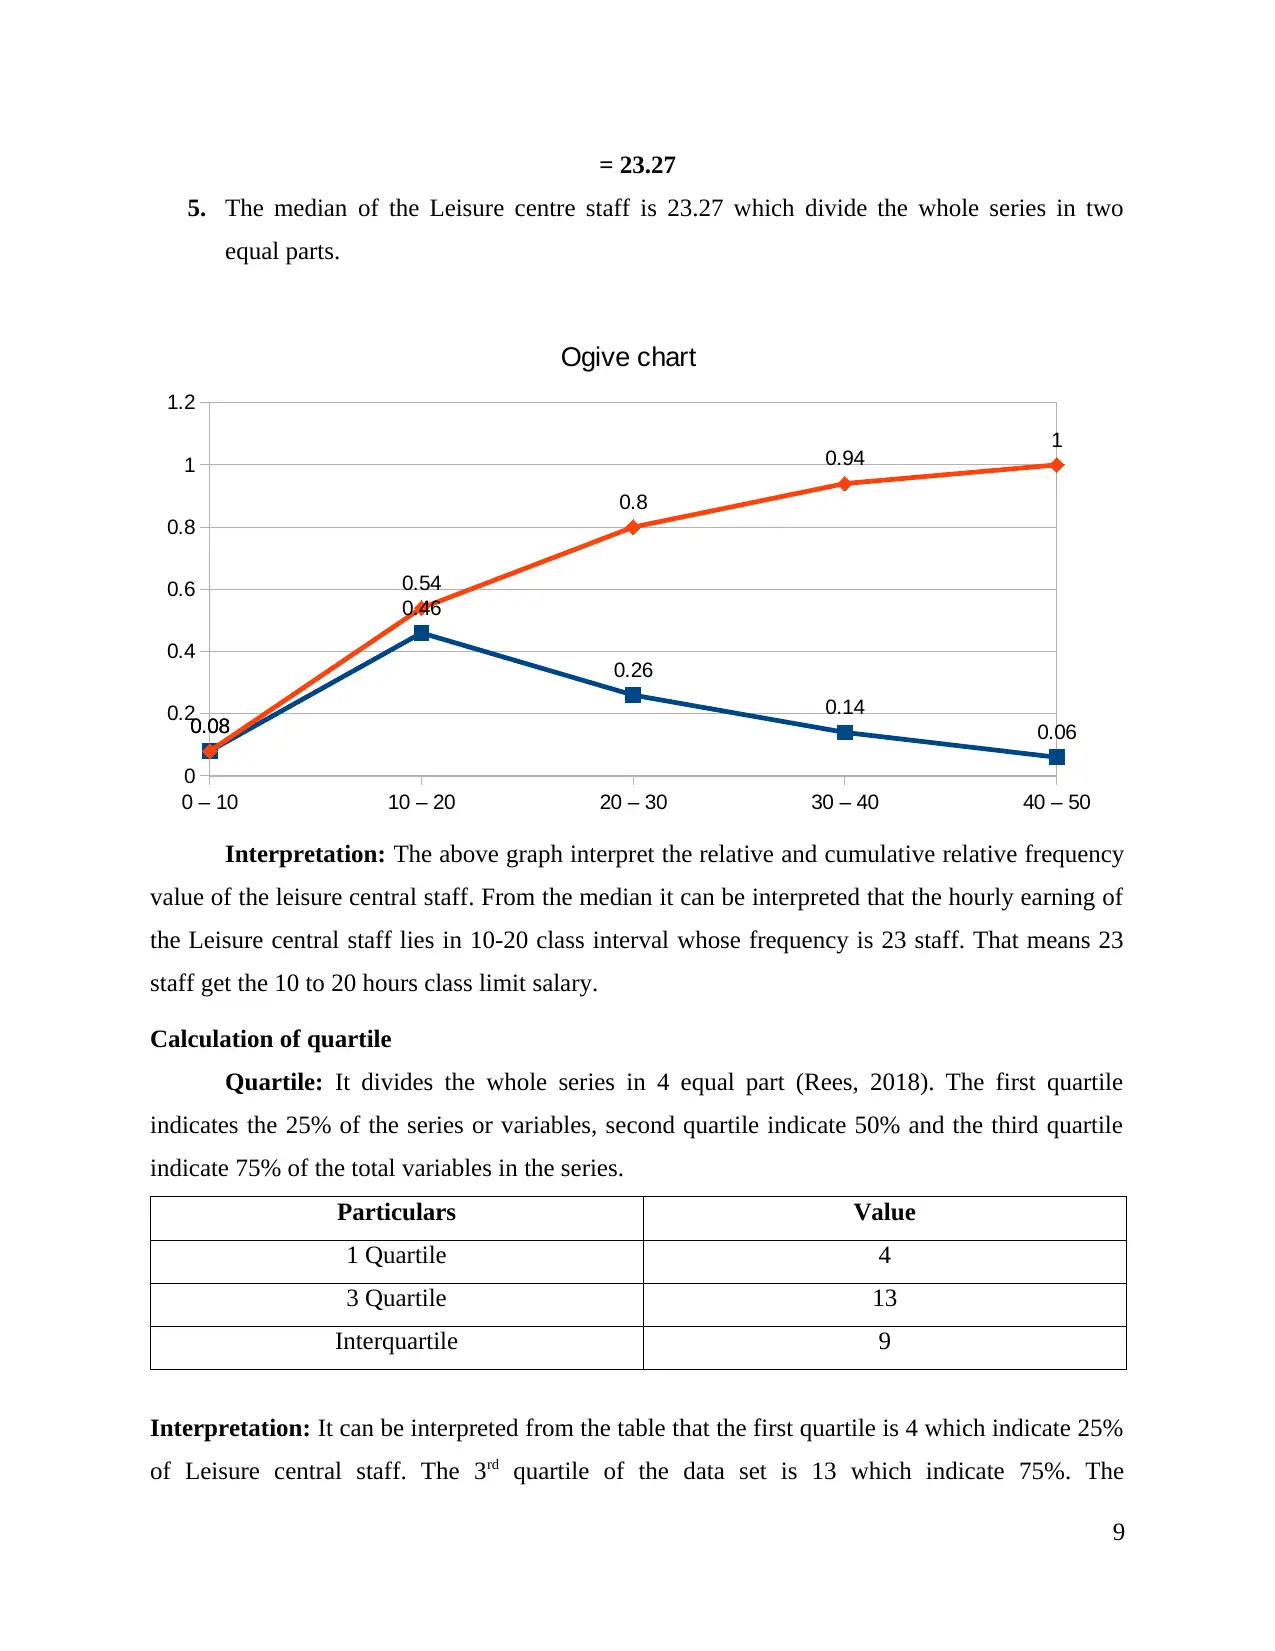
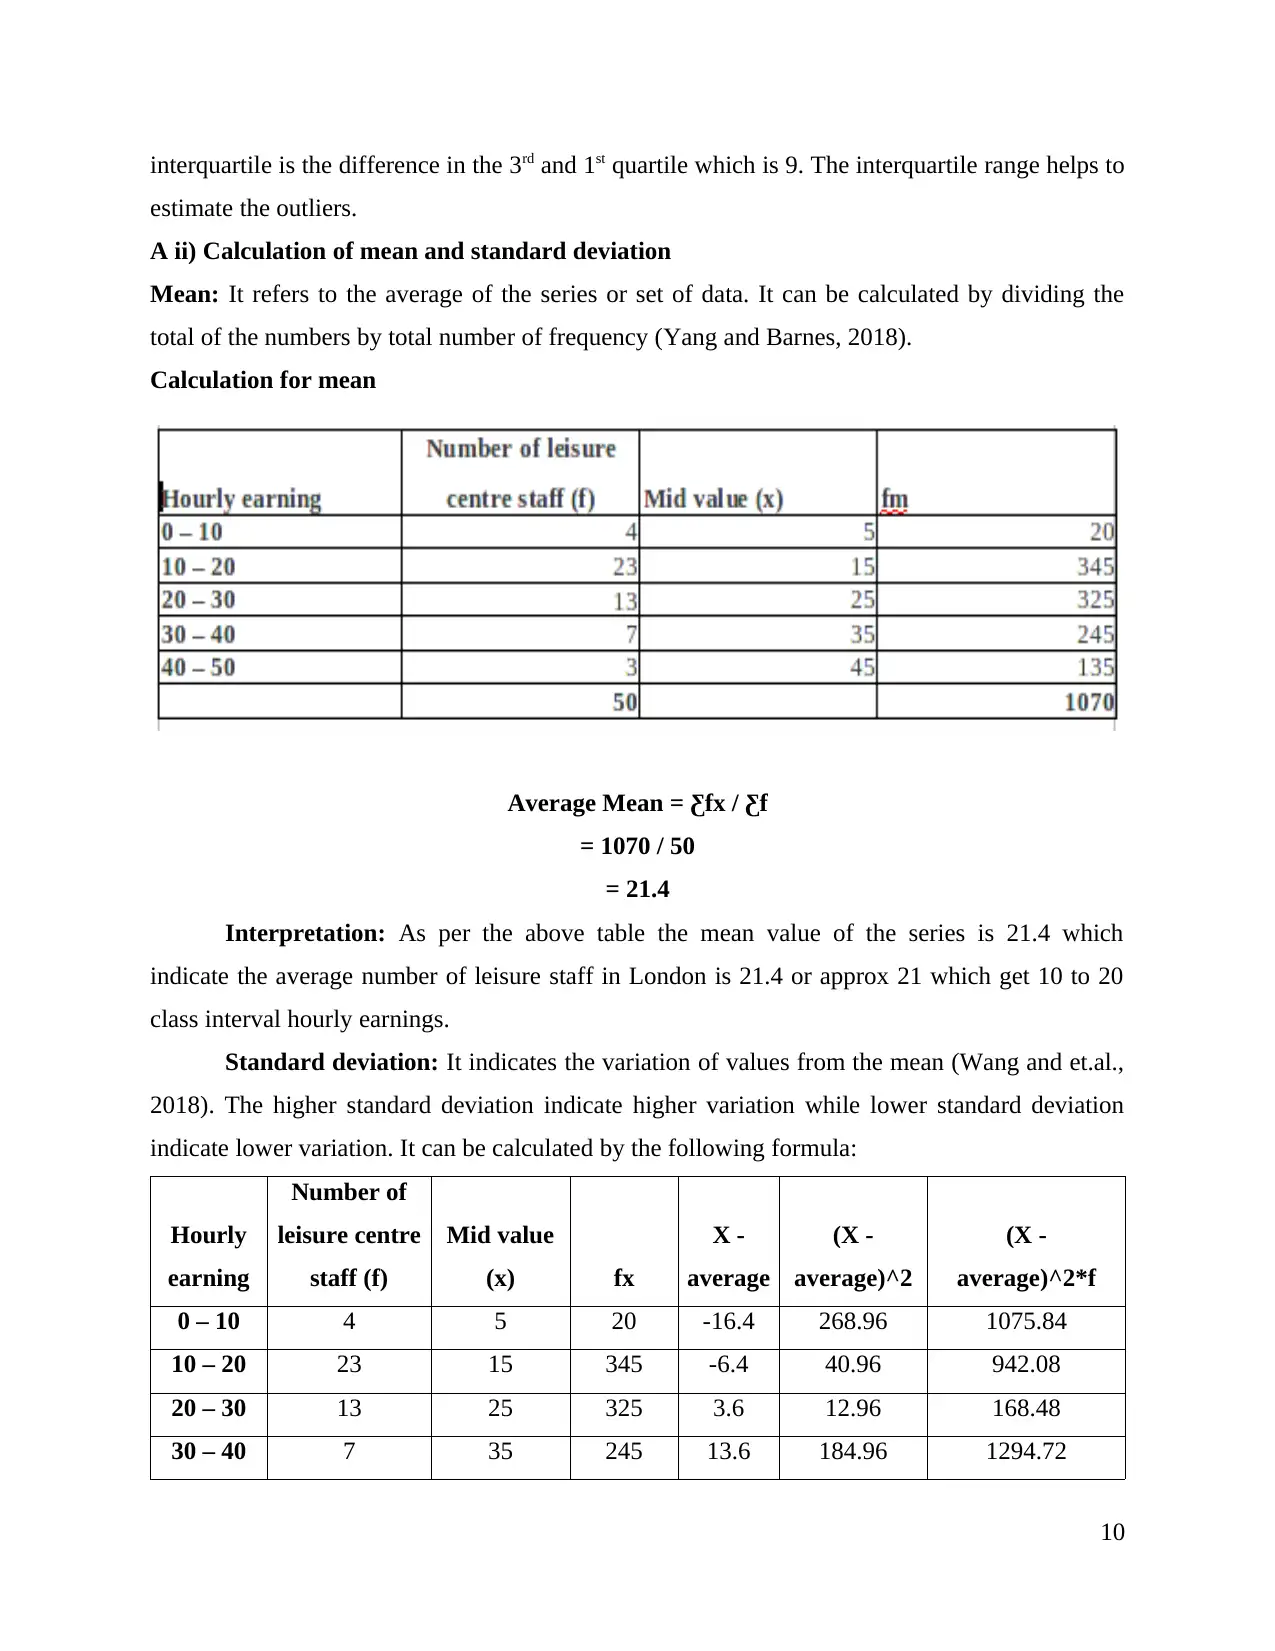
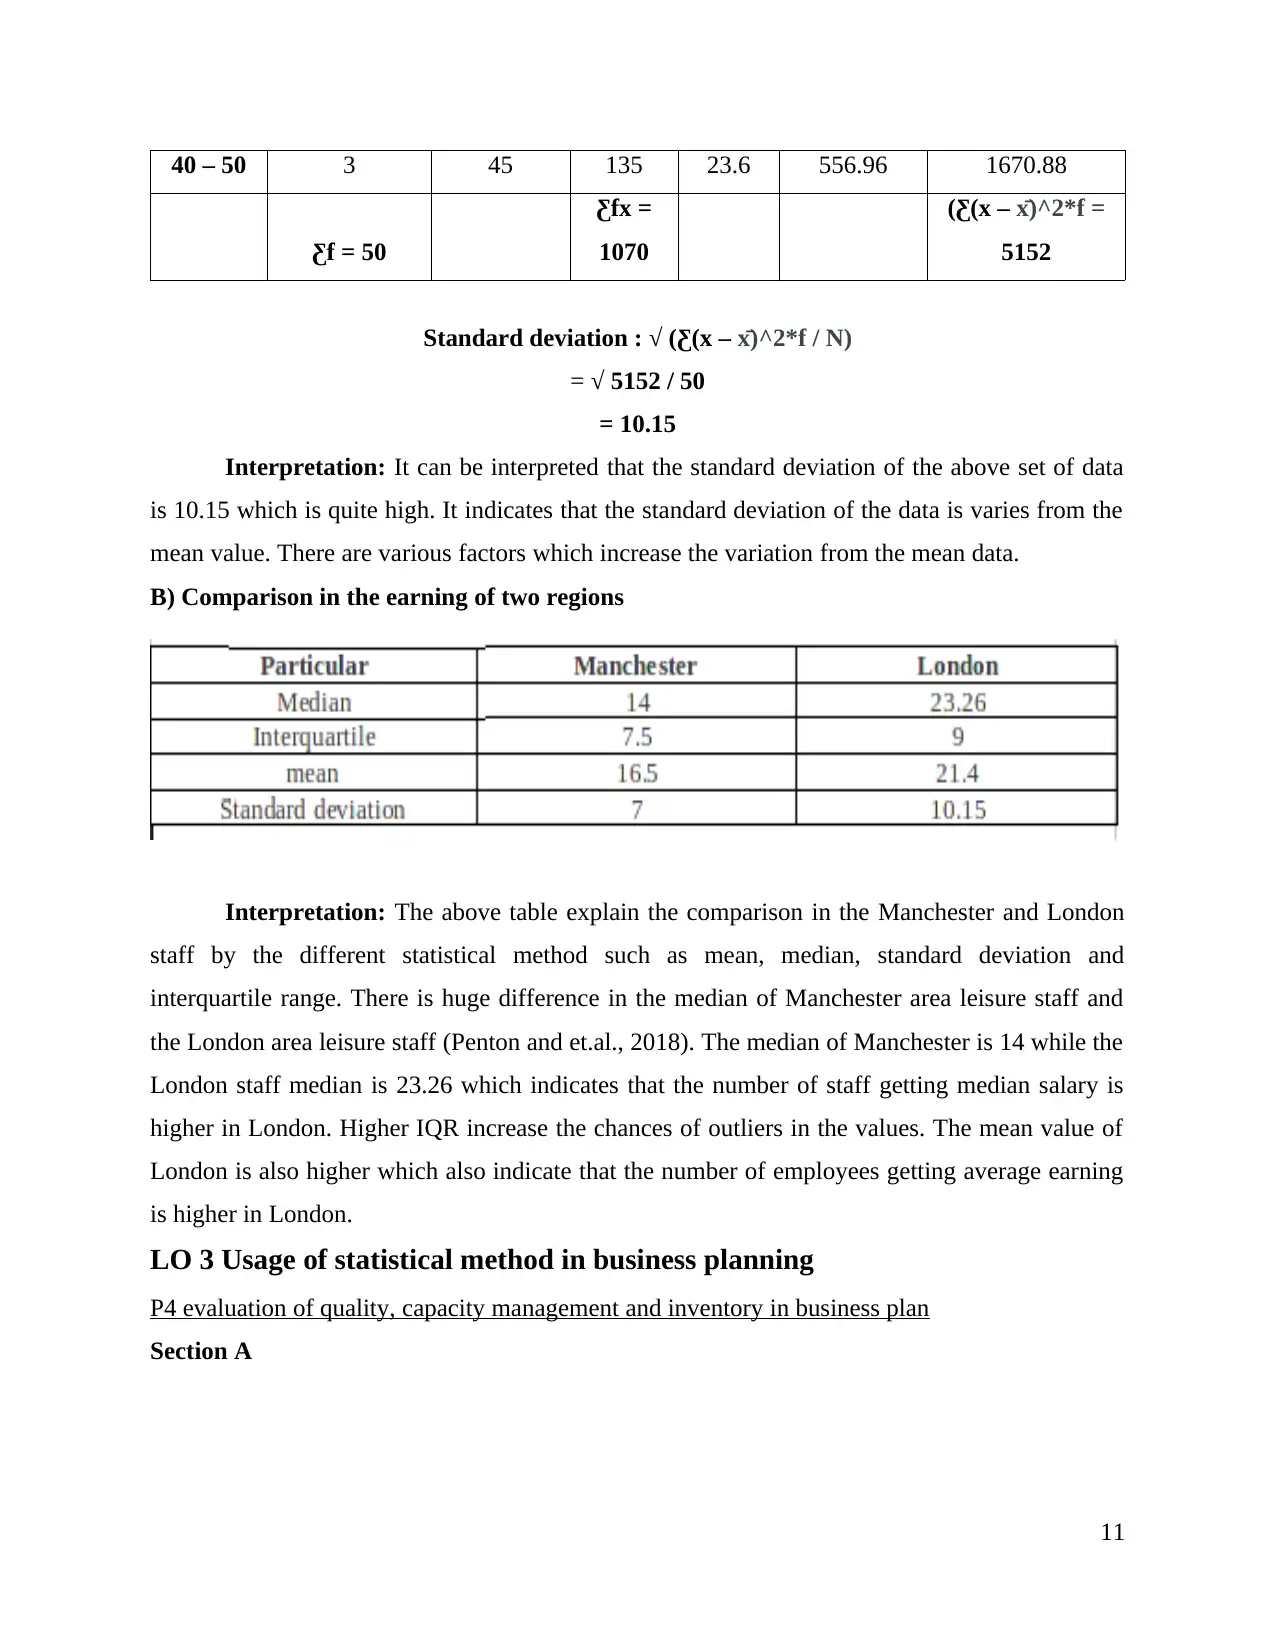
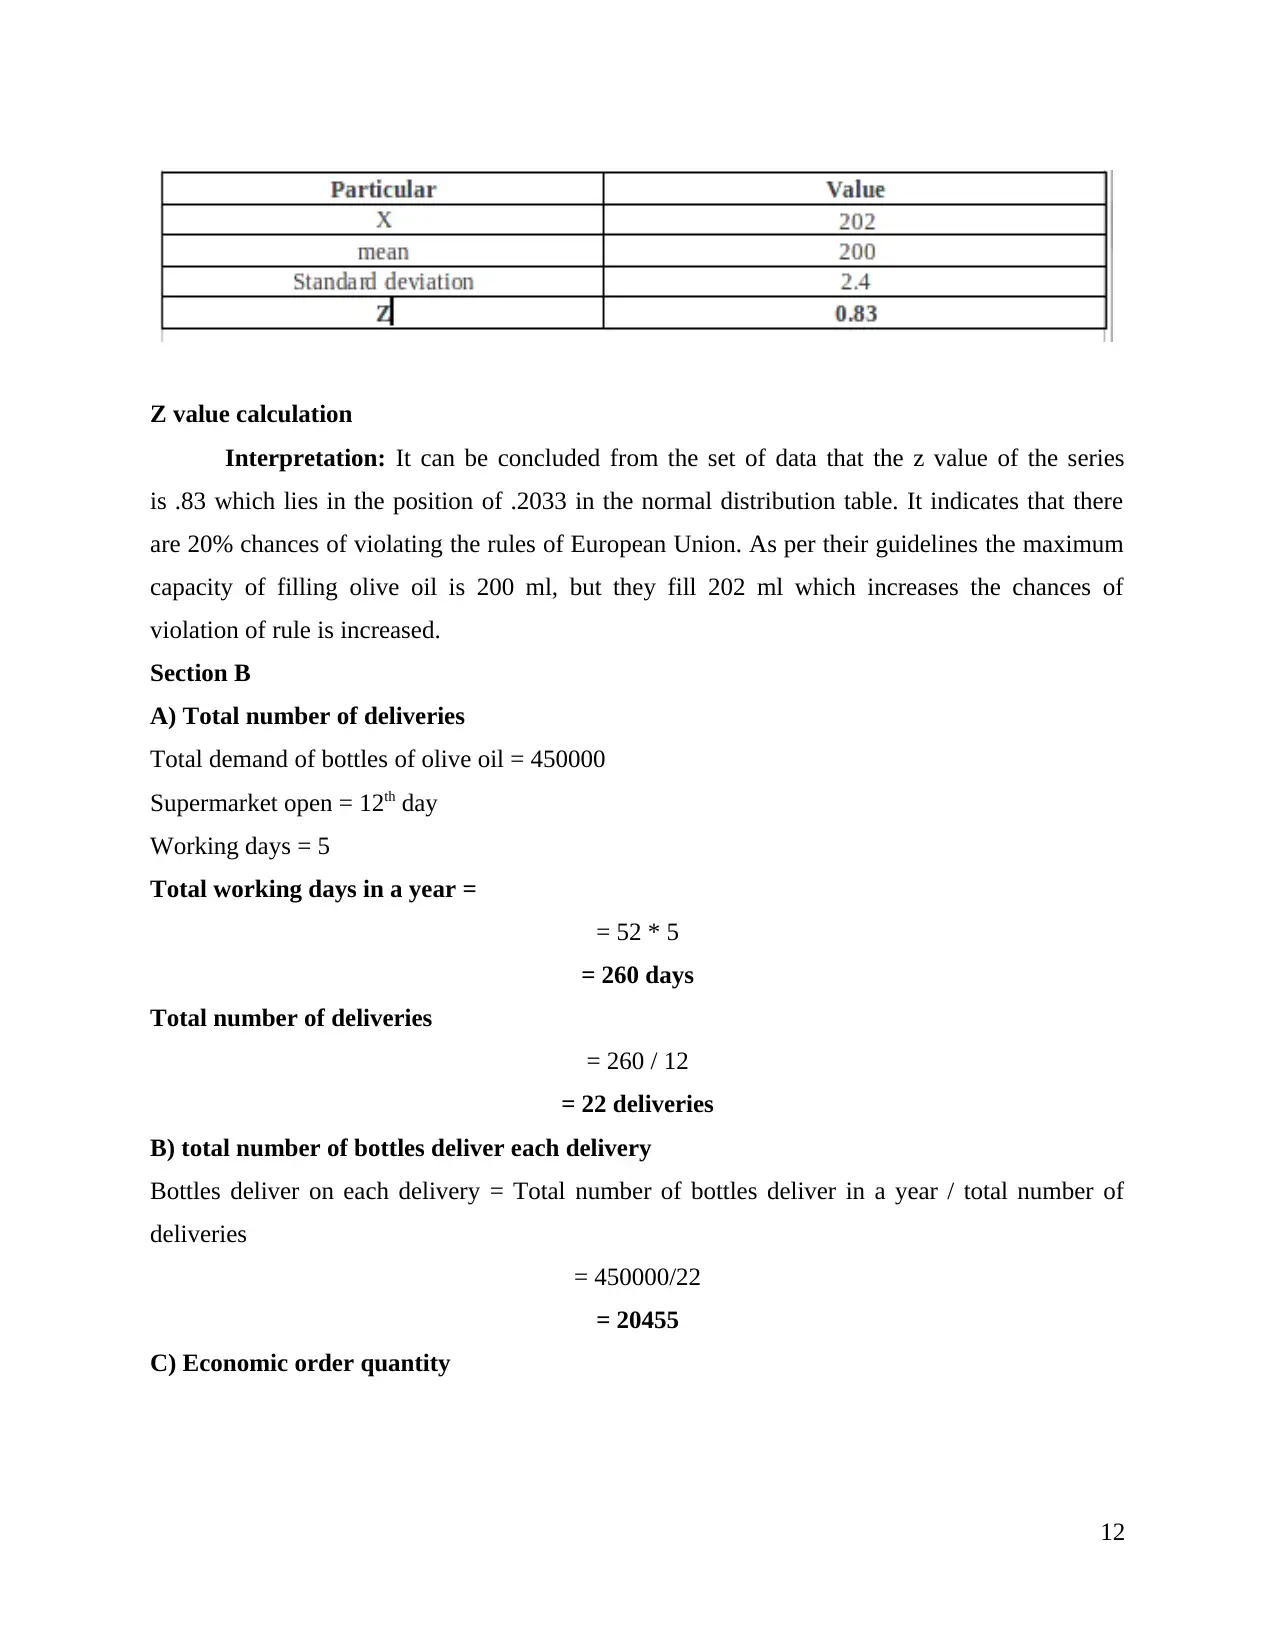
This report provides a comprehensive analysis of statistical methods applied to management, focusing on the evaluation of economic and business data. It begins with an examination of earnings in both public and private sectors, comparing men and women's incomes across different accounting years. The report utilizes various statistical tools, including mean, median, standard deviation, and interquartile range, to analyze business data. It also explores the application of economic order quantity (EOQ) in business planning, specifically in capacity management and inventory control. Furthermore, the report communicates findings through charts and graphs, illustrating trends and comparisons in earnings and other variables. The conclusion summarizes the key findings and insights derived from the statistical analysis, offering valuable information for management decision-making. The report covers different aspects of business data analysis, demonstrating the practical application of statistical techniques in a management context.
1 out of 19
Related Documents


Your All-in-One AI-Powered Toolkit for Academic Success.
+13062052269
info@desklib.com
Available 24*7 on WhatsApp / Email
![[object Object]](/_next/static/media/star-bottom.7253800d.svg)
Copyright © 2020–2026 A2Z Services. All Rights Reserved. Developed and managed by ZUCOL.