Statistics for Management: Business and Economic Data Analysis Report
VerifiedAdded on 2021/01/02
|21
|4438
|218
Report
AI Summary
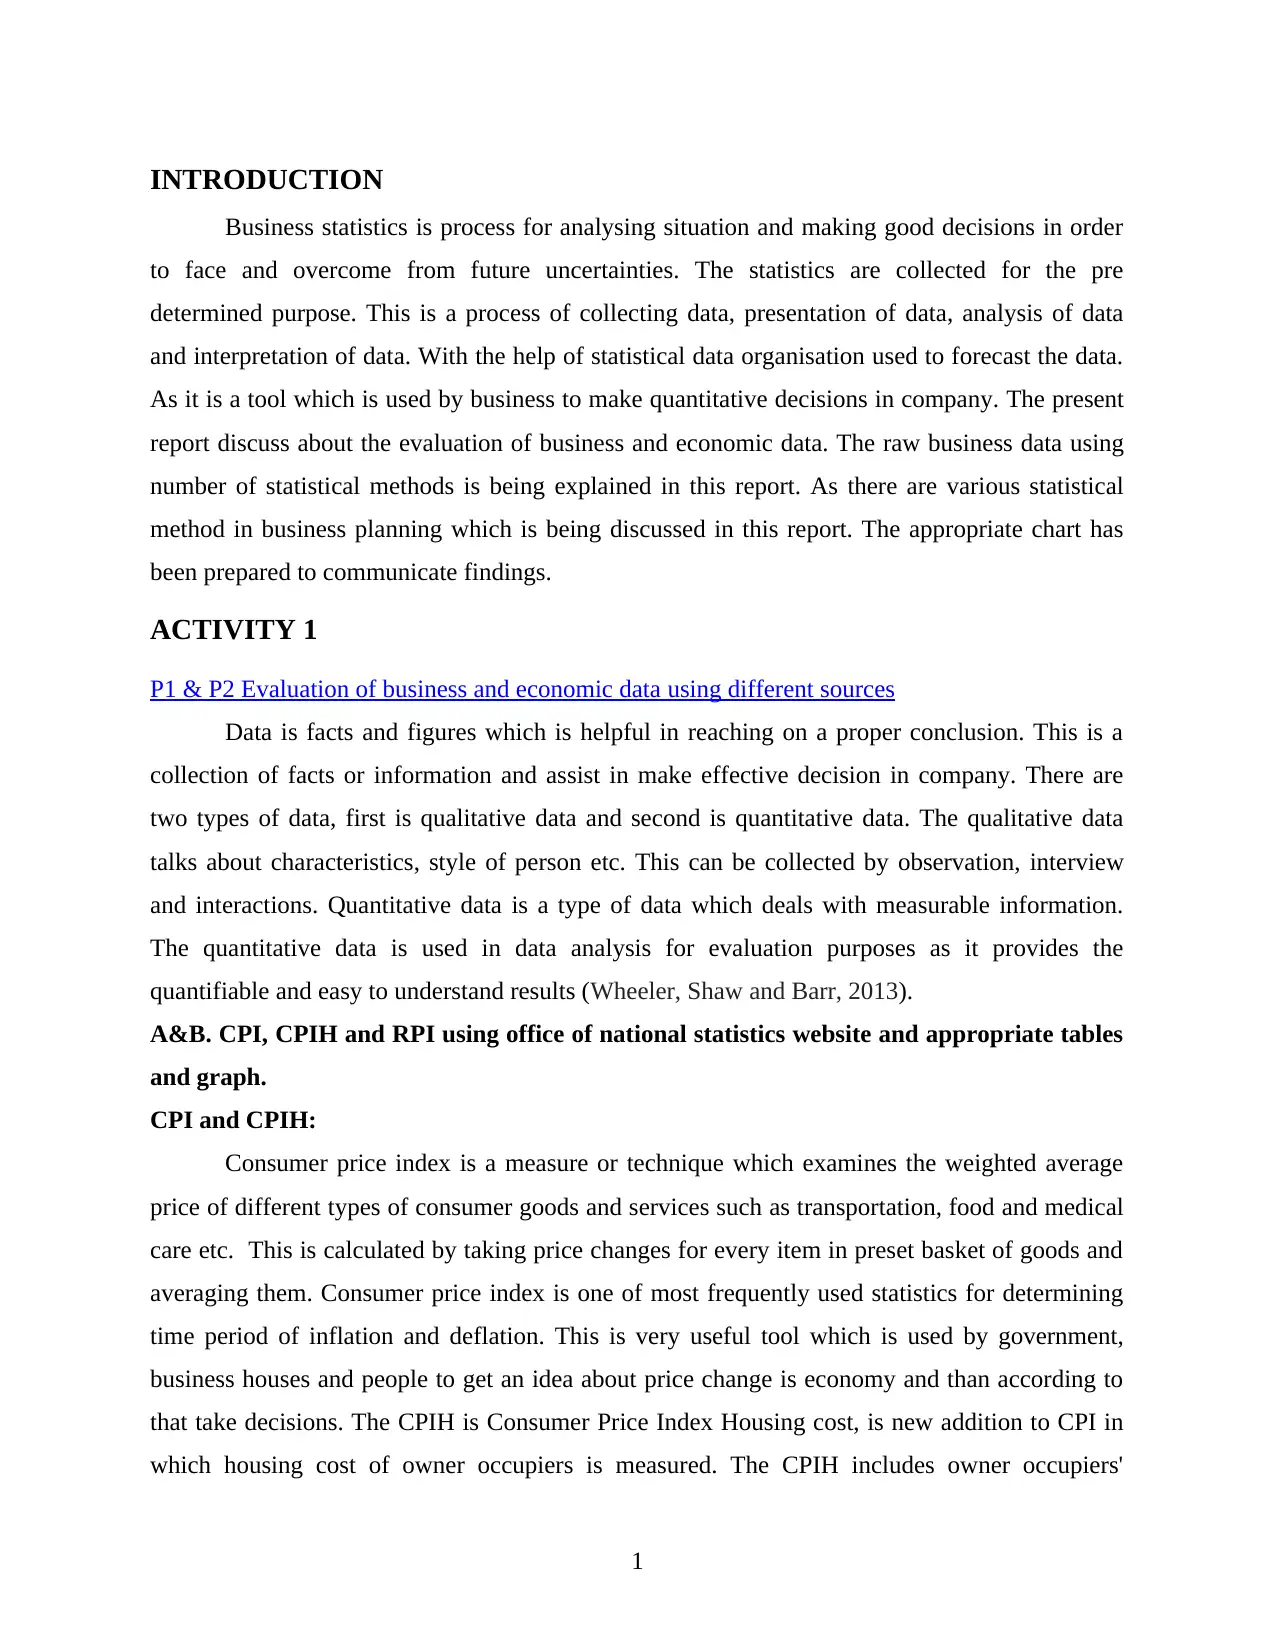
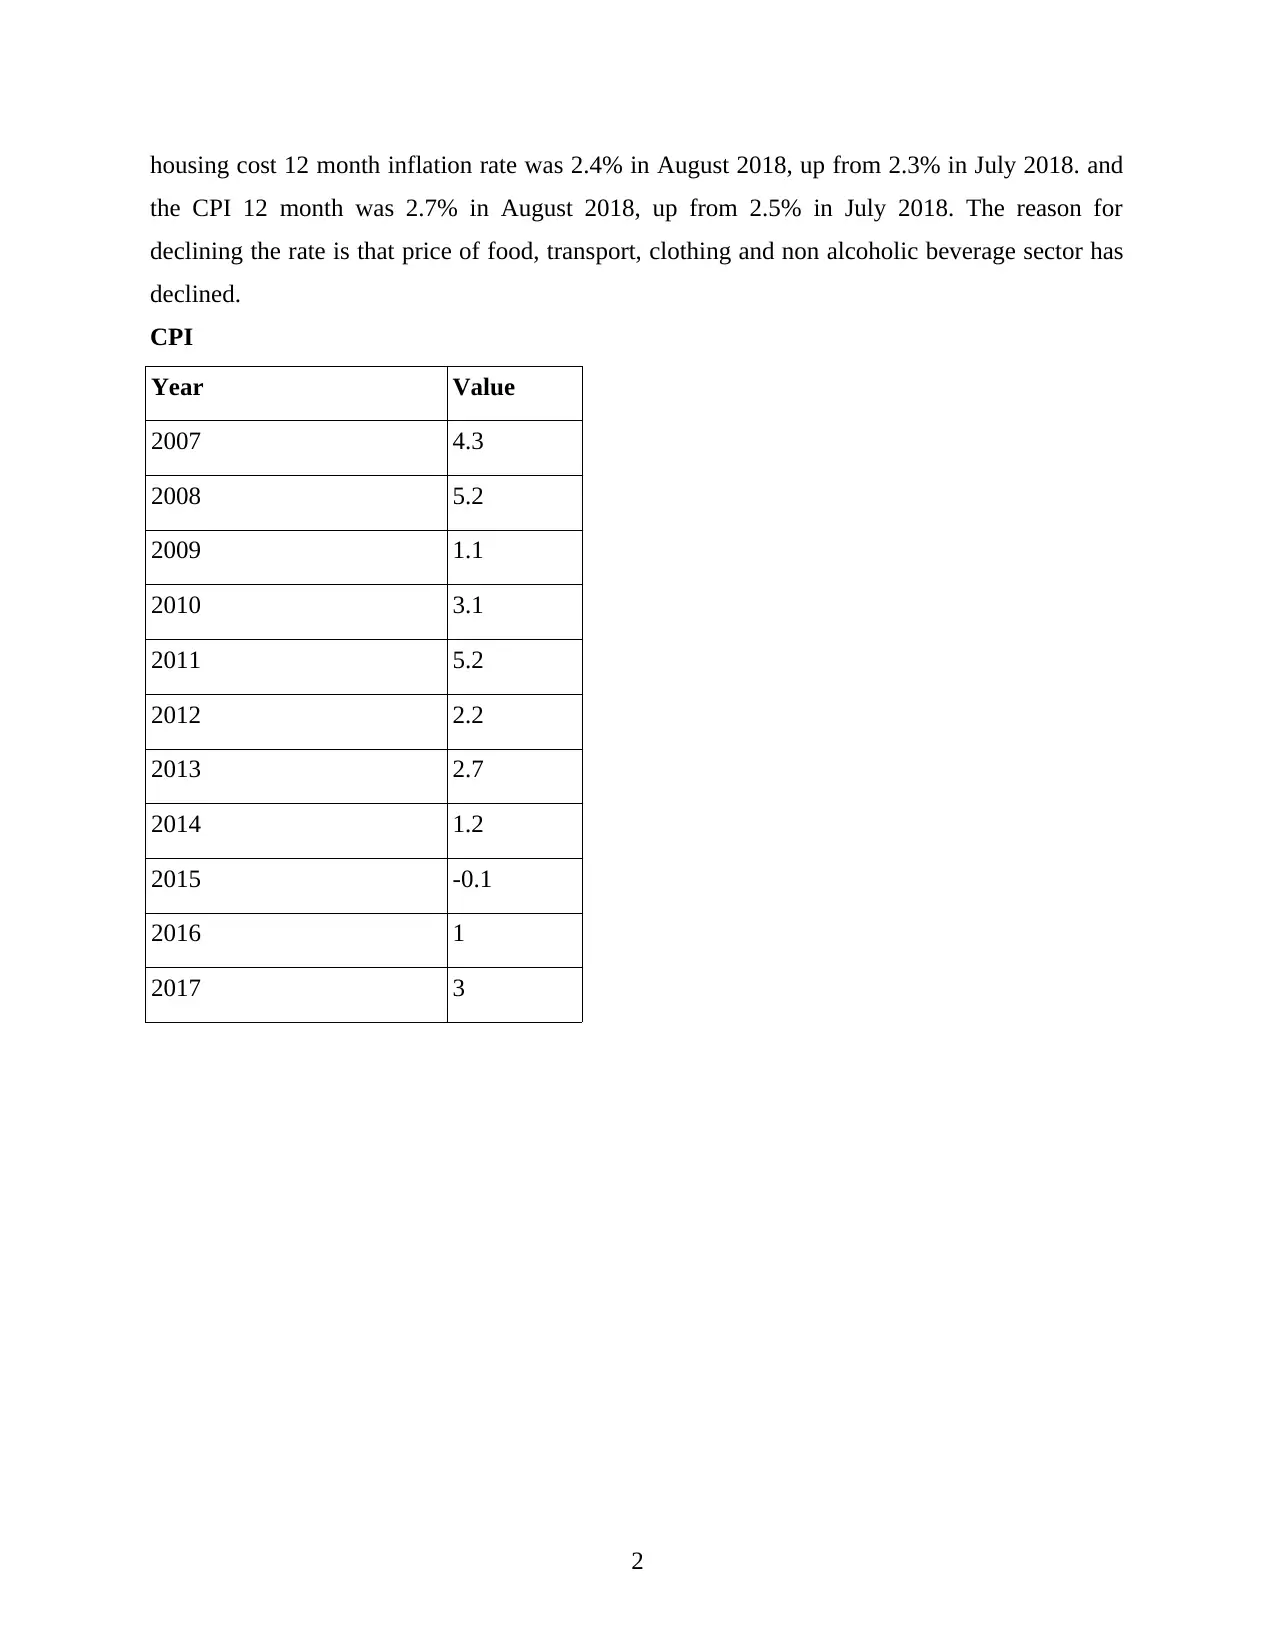
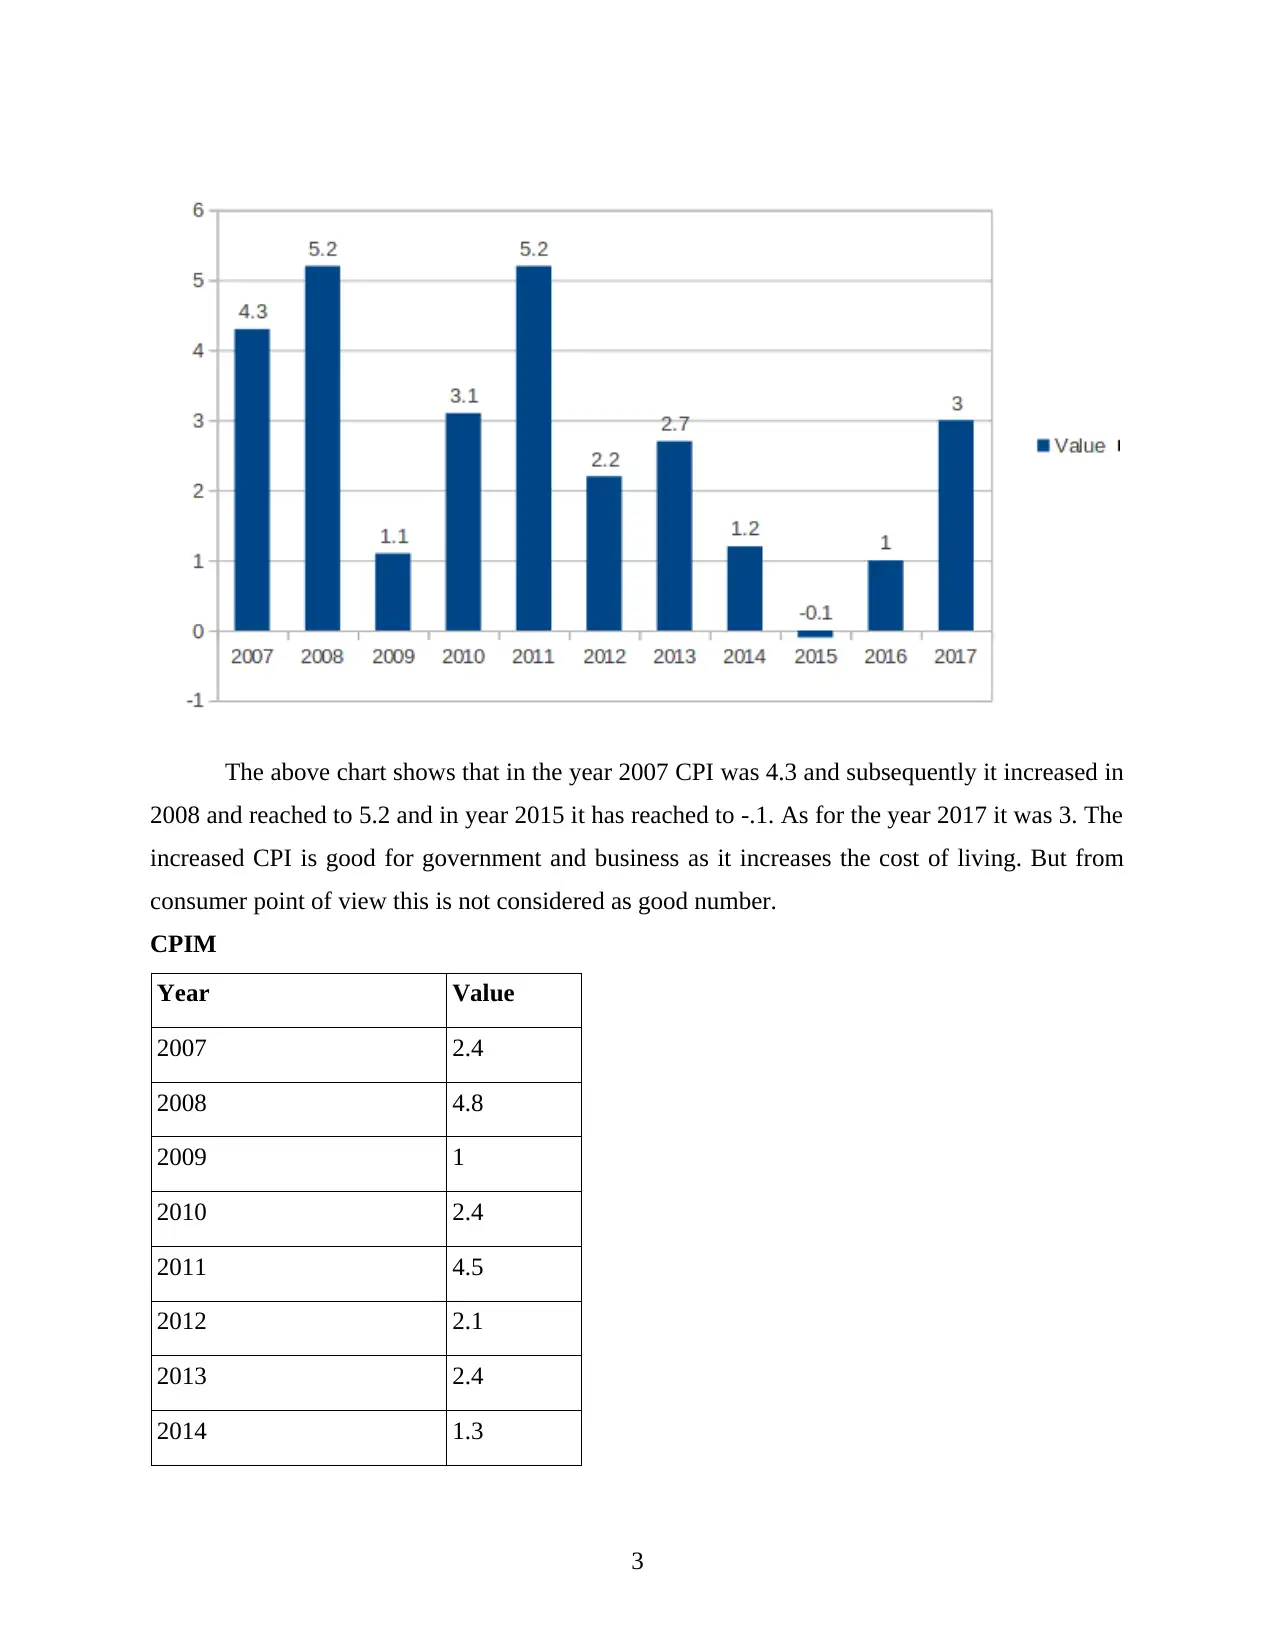
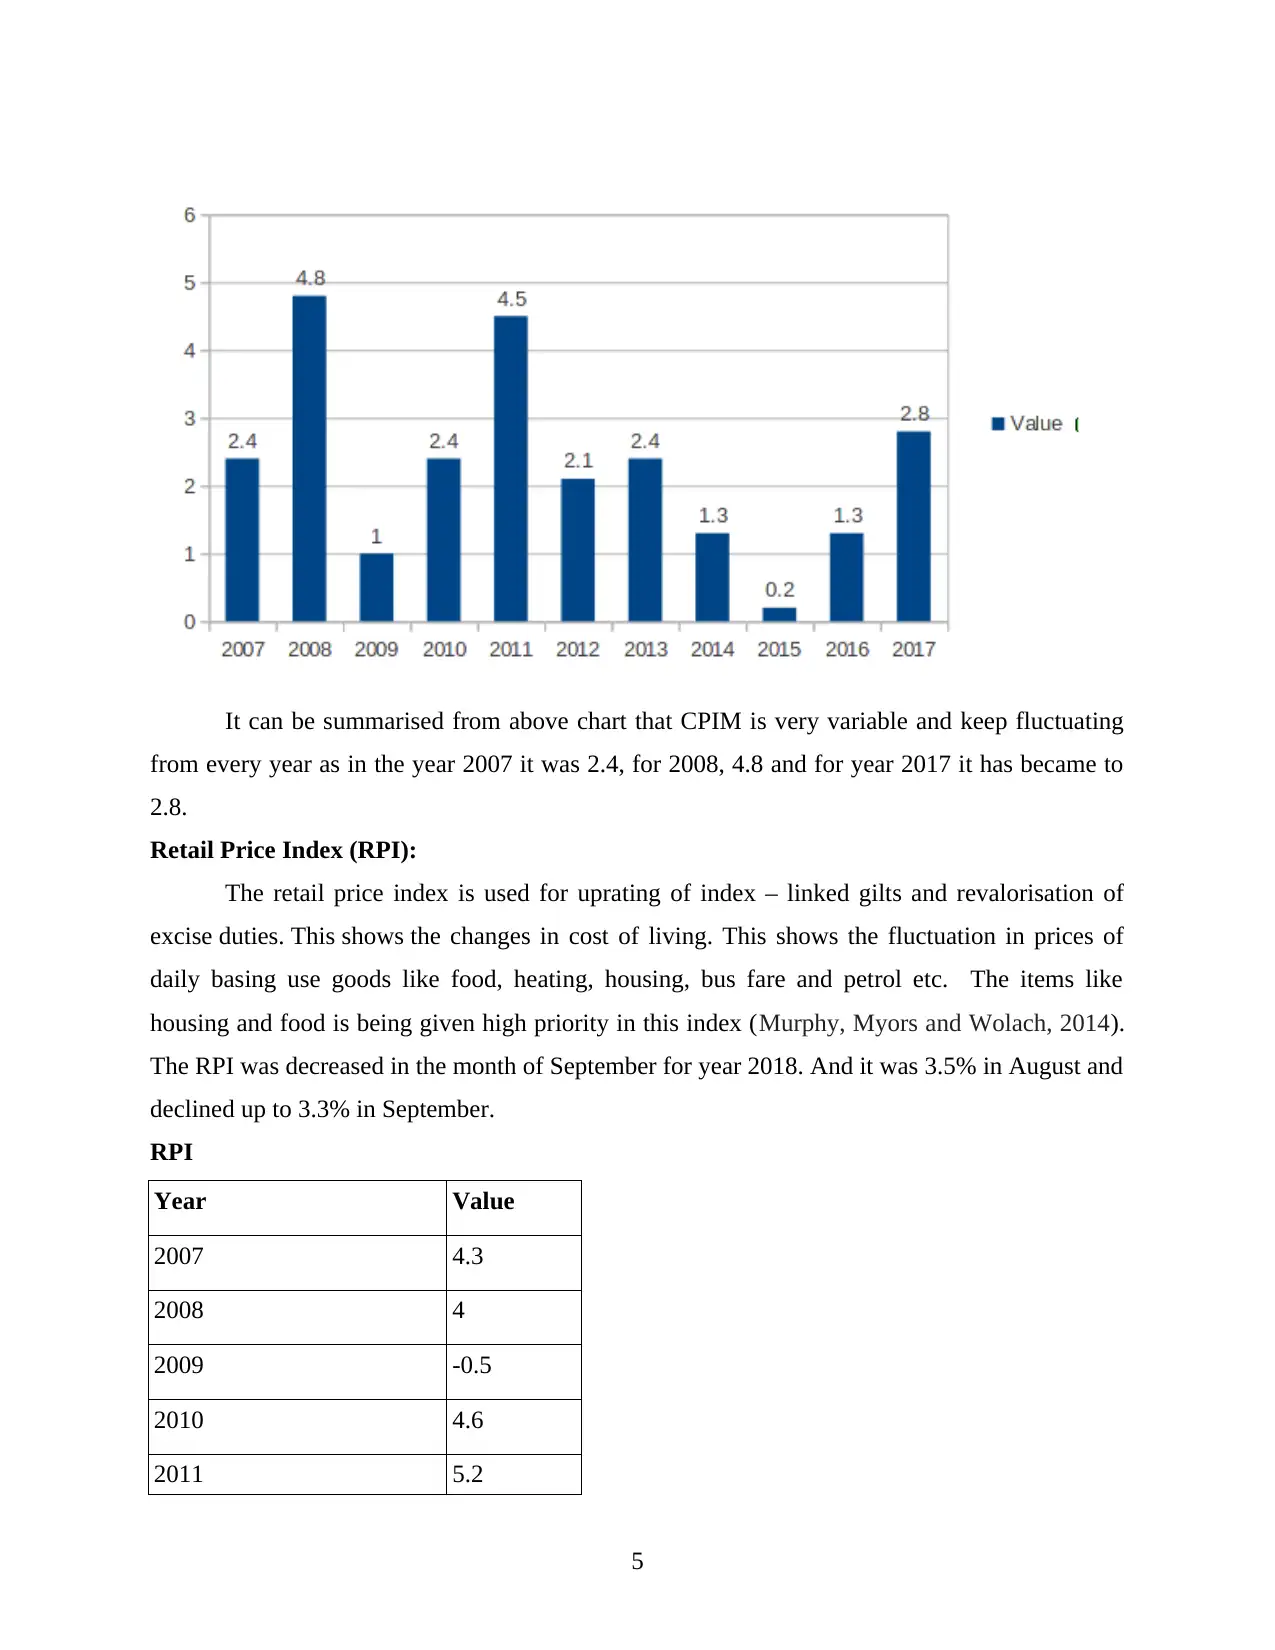
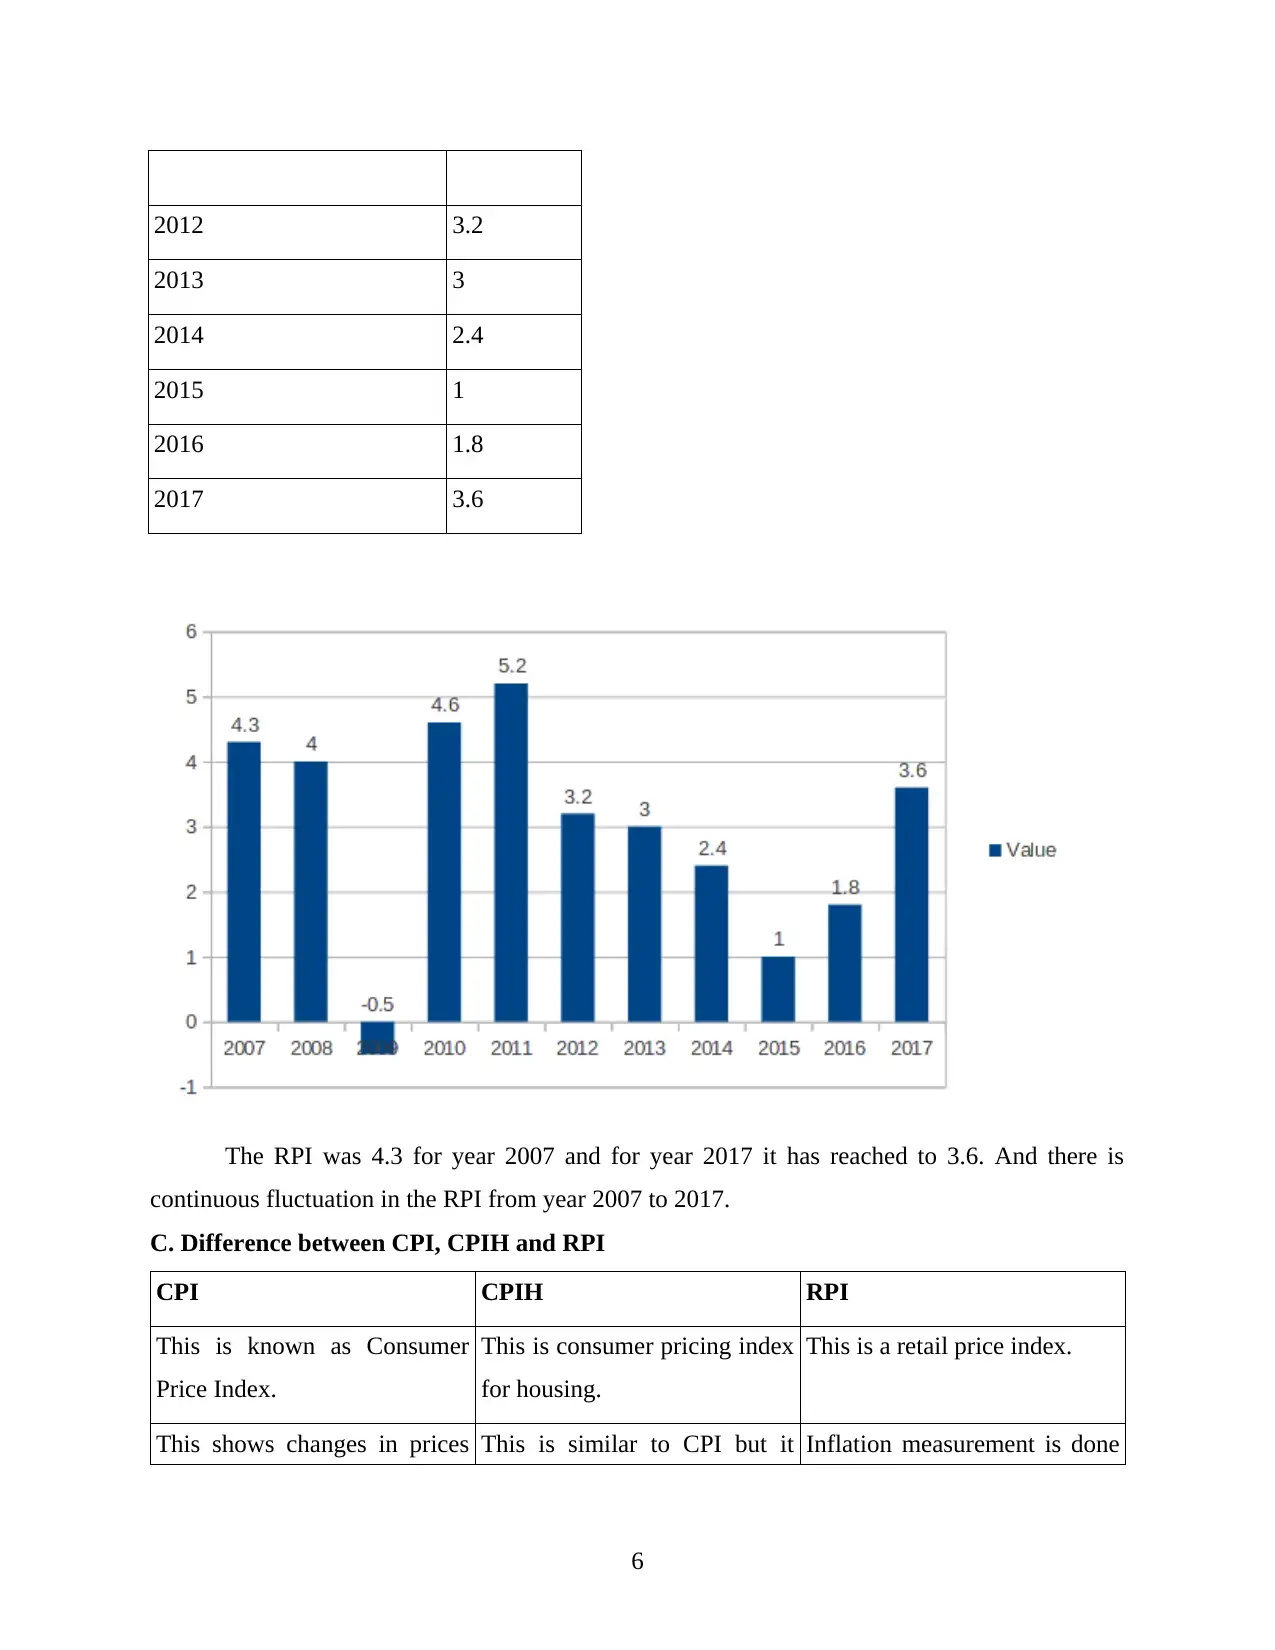
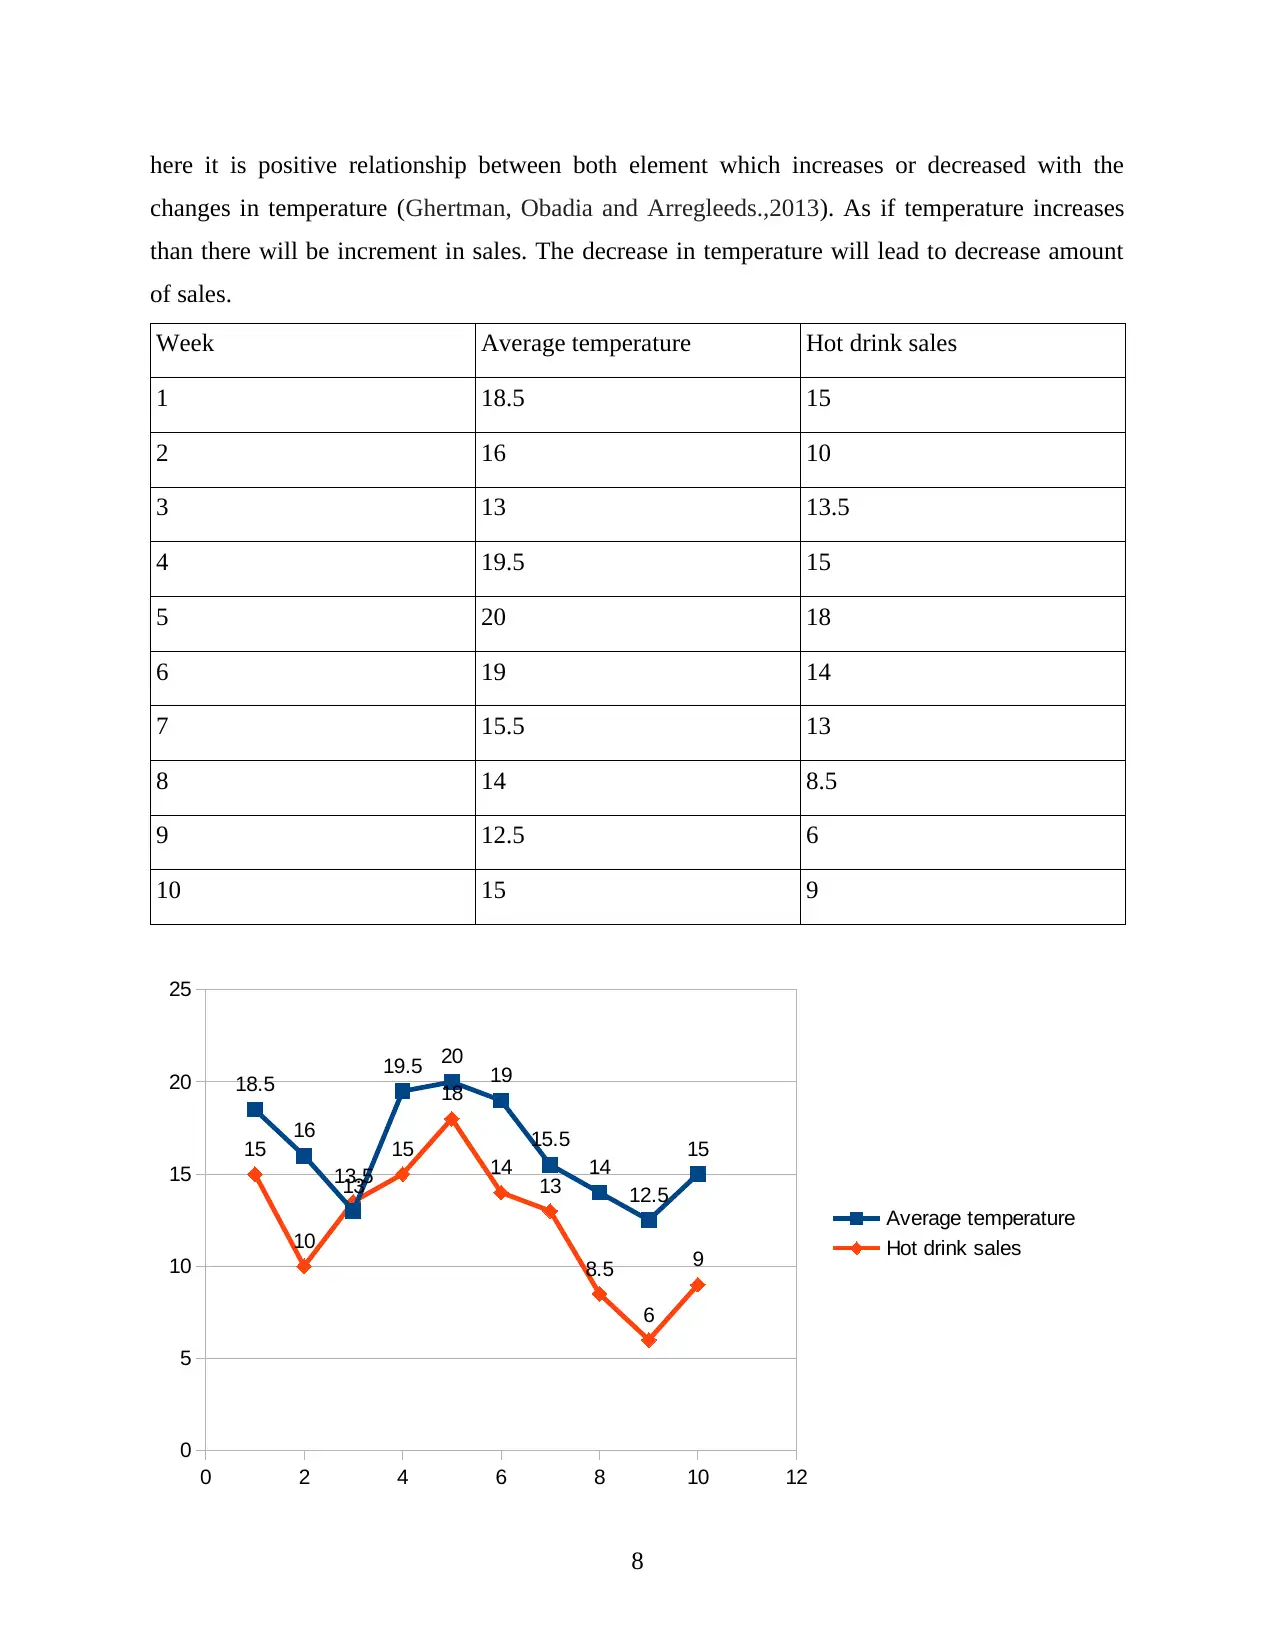
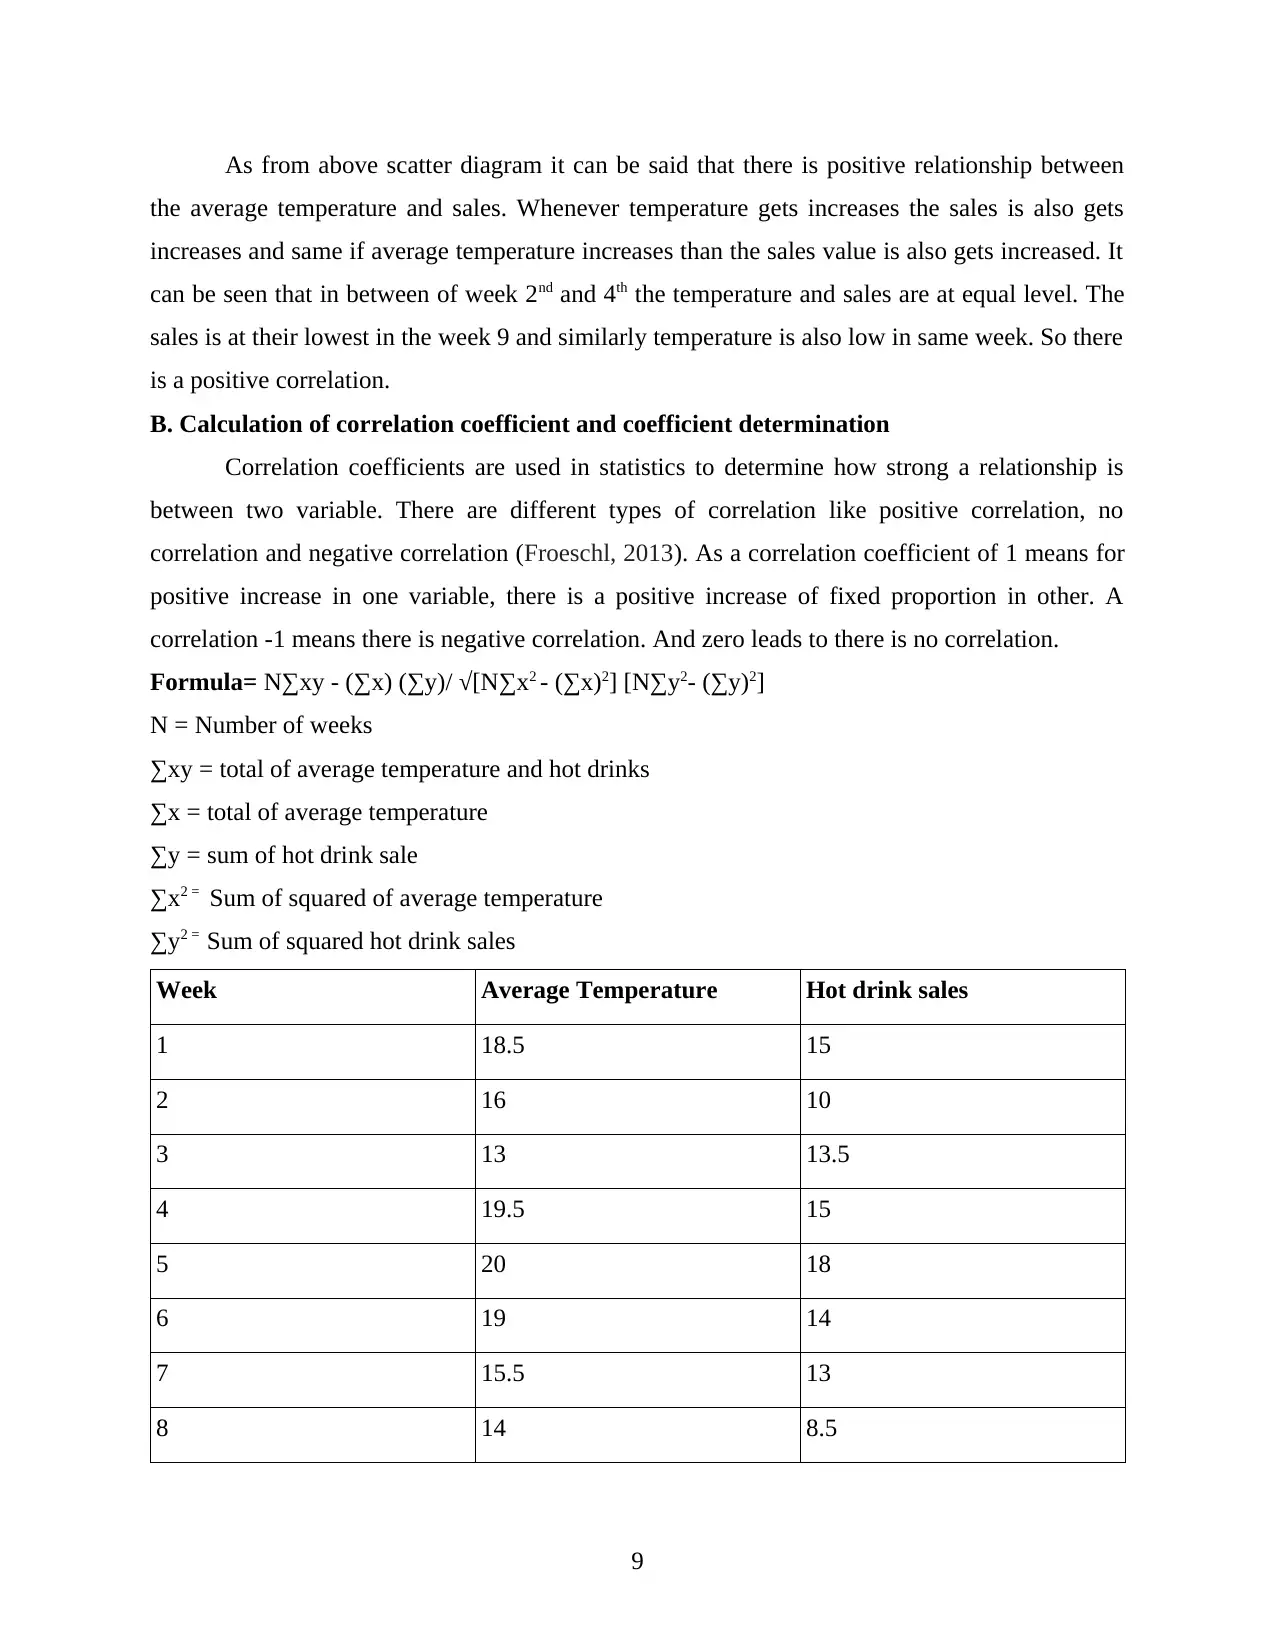
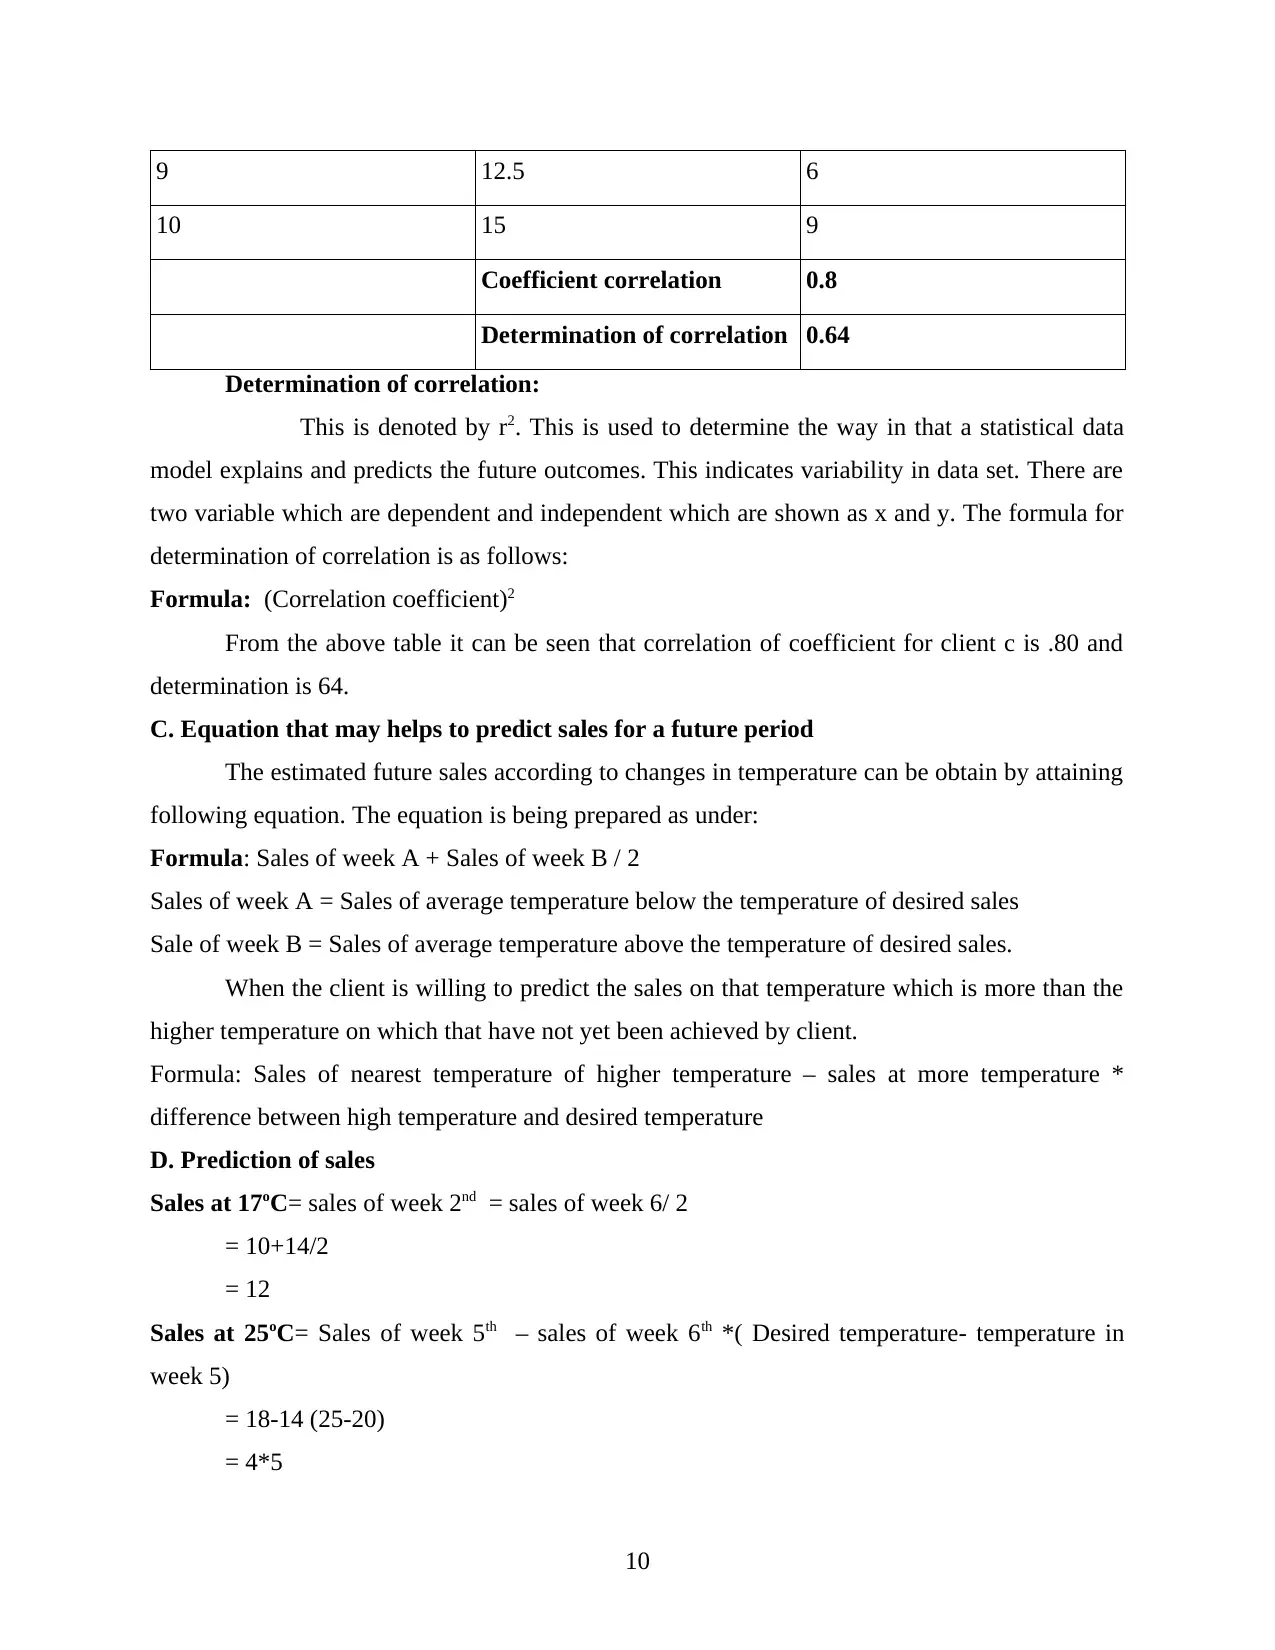
This report provides a comprehensive analysis of business and economic data using statistical methods. It begins with an introduction to business statistics, emphasizing its role in decision-making and forecasting. The report then delves into the evaluation of business and economic data, differentiating between qualitative and quantitative data, and explores the use of CPI, CPIH, and RPI from the Office of National Statistics website. It includes calculations of inflation rates and discusses the importance of inflation information for businesses. The report further analyzes raw business data using scatter diagrams to illustrate the relationship between hot drink sales and average weekly temperature, calculating correlation coefficients and coefficients of determination to predict future sales based on temperature fluctuations. The report concludes with an assessment of the reliability of these predictions, emphasizing the influence of both internal and external factors. The report provides a clear understanding of statistical techniques used in business planning and decision-making.

Statistics for Management
Paraphrase This Document
Need a fresh take? Get an instant paraphrase of this document with our AI Paraphraser

Table of Contents
INTRODUCTION...........................................................................................................................1
ACTIVITY 1....................................................................................................................................1
P1 & P2 Evaluation of business and economic data using different sources..............................1
..........................................................................................................................................................3
..........................................................................................................................................................4
ACTIVITY 2....................................................................................................................................6
P3 evaluation of qualitative and quantitative raw business data..................................................6
ACTIVITY 3....................................................................................................................................9
P4 Range of statistical method.....................................................................................................9
ACTIVITY 4..................................................................................................................................11
P5. Using of appropriate charts finding.....................................................................................11
CONCLUSION..............................................................................................................................16
REFERENCES..............................................................................................................................17

INTRODUCTION
Business statistics is process for analysing situation and making good decisions in order
to face and overcome from future uncertainties. The statistics are collected for the pre
determined purpose. This is a process of collecting data, presentation of data, analysis of data
and interpretation of data. With the help of statistical data organisation used to forecast the data.
As it is a tool which is used by business to make quantitative decisions in company. The present
report discuss about the evaluation of business and economic data. The raw business data using
number of statistical methods is being explained in this report. As there are various statistical
method in business planning which is being discussed in this report. The appropriate chart has
been prepared to communicate findings.
ACTIVITY 1
P1 & P2 Evaluation of business and economic data using different sources
Data is facts and figures which is helpful in reaching on a proper conclusion. This is a
collection of facts or information and assist in make effective decision in company. There are
two types of data, first is qualitative data and second is quantitative data. The qualitative data
talks about characteristics, style of person etc. This can be collected by observation, interview
and interactions. Quantitative data is a type of data which deals with measurable information.
The quantitative data is used in data analysis for evaluation purposes as it provides the
quantifiable and easy to understand results (Wheeler, Shaw and Barr, 2013).
A&B. CPI, CPIH and RPI using office of national statistics website and appropriate tables
and graph.
CPI and CPIH:
Consumer price index is a measure or technique which examines the weighted average
price of different types of consumer goods and services such as transportation, food and medical
care etc. This is calculated by taking price changes for every item in preset basket of goods and
averaging them. Consumer price index is one of most frequently used statistics for determining
time period of inflation and deflation. This is very useful tool which is used by government,
business houses and people to get an idea about price change is economy and than according to
that take decisions. The CPIH is Consumer Price Index Housing cost, is new addition to CPI in
which housing cost of owner occupiers is measured. The CPIH includes owner occupiers'
1
⊘ This is a preview!⊘
Do you want full access?
Subscribe today to unlock all pages.

Trusted by 1+ million students worldwide

housing cost 12 month inflation rate was 2.4% in August 2018, up from 2.3% in July 2018. and
the CPI 12 month was 2.7% in August 2018, up from 2.5% in July 2018. The reason for
declining the rate is that price of food, transport, clothing and non alcoholic beverage sector has
declined.
CPI
Year Value
2007 4.3
2008 5.2
2009 1.1
2010 3.1
2011 5.2
2012 2.2
2013 2.7
2014 1.2
2015 -0.1
2016 1
2017 3
2
Paraphrase This Document
Need a fresh take? Get an instant paraphrase of this document with our AI Paraphraser

The above chart shows that in the year 2007 CPI was 4.3 and subsequently it increased in
2008 and reached to 5.2 and in year 2015 it has reached to -.1. As for the year 2017 it was 3. The
increased CPI is good for government and business as it increases the cost of living. But from
consumer point of view this is not considered as good number.
CPIM
Year Value
2007 2.4
2008 4.8
2009 1
2010 2.4
2011 4.5
2012 2.1
2013 2.4
2014 1.3
3

2015 0.2
2016 1.3
2017 2.8
4
2016 1.3
2017 2.8
4
⊘ This is a preview!⊘
Do you want full access?
Subscribe today to unlock all pages.

Trusted by 1+ million students worldwide

It can be summarised from above chart that CPIM is very variable and keep fluctuating
from every year as in the year 2007 it was 2.4, for 2008, 4.8 and for year 2017 it has became to
2.8.
Retail Price Index (RPI):
The retail price index is used for uprating of index – linked gilts and revalorisation of
excise duties. This shows the changes in cost of living. This shows the fluctuation in prices of
daily basing use goods like food, heating, housing, bus fare and petrol etc. The items like
housing and food is being given high priority in this index (Murphy, Myors and Wolach, 2014).
The RPI was decreased in the month of September for year 2018. And it was 3.5% in August and
declined up to 3.3% in September.
RPI
Year Value
2007 4.3
2008 4
2009 -0.5
2010 4.6
2011 5.2
5
Paraphrase This Document
Need a fresh take? Get an instant paraphrase of this document with our AI Paraphraser

2012 3.2
2013 3
2014 2.4
2015 1
2016 1.8
2017 3.6
The RPI was 4.3 for year 2007 and for year 2017 it has reached to 3.6. And there is
continuous fluctuation in the RPI from year 2007 to 2017.
C. Difference between CPI, CPIH and RPI
CPI CPIH RPI
This is known as Consumer
Price Index.
This is consumer pricing index
for housing.
This is a retail price index.
This shows changes in prices This is similar to CPI but it Inflation measurement is done
6

of daily use goods in market. measures housing cost of
owner occupies (Keller, 2015).
by this RPI.
This is particularly used by
business house and
government in order to
measure inflation.
This facilitate changes in
average residential rates.
The change in cost of cost of
retail goods or services.
D. Calculation of inflation rate with the help of consumer price index:
The consumer price index is helpful in calculation of inflation on monthly or annually
basis. If consumer price index is continuously decreasing than it will have impact on inflation
rate of country and there will be result in variability in inflation rates. The change rate is given
name of percentage rate to determine inflation. The CPI for 2017 has increased in compare to
2016 which is 1. So overall difference is of 2% which has result in increase of inflation rate.
E. Why it is important to have information of inflation:
This is important for every organisation to have information regarding the inflation rate
as this has direct impact in business operations. The information of inflation can helps
organisation to determine the prices of goods and services accordingly. As if business managers
have adequate information regarding inflation than they can make proper strategy for different
situation (Hipel and Fang eds., 2013).
M1 Evaluation of sources other than NSO with regard to gender pay
This has been observed that gender pay gap is increasing in UK from last some time. As
companies and firms are paying more to male staff member in compare to female staff. This is
reason that females are contributing less to CPI in UK. The gender pay gap was recorded at
around 88% to 89% in UK.
ACTIVITY 2
P3 evaluation of qualitative and quantitative raw business data
a. Scatter diagram and relation between hot drink sales and average weekly temperature
Scatter plot is two-d data visualization which used points to represent the values obtained
for two various variables. Under this one plotted along the x-axis and other one is y-axis. In this
report the scatter diagrams are used to evaluate relationship between average temperature and hot
drink sales. The diagram helps to analyse positive or negative relation between both elements. As
7
⊘ This is a preview!⊘
Do you want full access?
Subscribe today to unlock all pages.

Trusted by 1+ million students worldwide

here it is positive relationship between both element which increases or decreased with the
changes in temperature (Ghertman, Obadia and Arregleeds.,2013). As if temperature increases
than there will be increment in sales. The decrease in temperature will lead to decrease amount
of sales.
Week Average temperature Hot drink sales
1 18.5 15
2 16 10
3 13 13.5
4 19.5 15
5 20 18
6 19 14
7 15.5 13
8 14 8.5
9 12.5 6
10 15 9
0 2 4 6 8 10 12
0
5
10
15
20
25
15
10
13.5
15
18
14 13
8.5
6
9
18.5
16
13
19.5 20 19
15.5
14
12.5
15
Average temperature
Hot drink sales
8
Paraphrase This Document
Need a fresh take? Get an instant paraphrase of this document with our AI Paraphraser

As from above scatter diagram it can be said that there is positive relationship between
the average temperature and sales. Whenever temperature gets increases the sales is also gets
increases and same if average temperature increases than the sales value is also gets increased. It
can be seen that in between of week 2nd and 4th the temperature and sales are at equal level. The
sales is at their lowest in the week 9 and similarly temperature is also low in same week. So there
is a positive correlation.
B. Calculation of correlation coefficient and coefficient determination
Correlation coefficients are used in statistics to determine how strong a relationship is
between two variable. There are different types of correlation like positive correlation, no
correlation and negative correlation (Froeschl, 2013). As a correlation coefficient of 1 means for
positive increase in one variable, there is a positive increase of fixed proportion in other. A
correlation -1 means there is negative correlation. And zero leads to there is no correlation.
Formula= N∑xy - (∑x) (∑y)/ √[N∑x2 - (∑x)2] [N∑y2- (∑y)2]
N = Number of weeks
∑xy = total of average temperature and hot drinks
∑x = total of average temperature
∑y = sum of hot drink sale
∑x2 = Sum of squared of average temperature
∑y2 = Sum of squared hot drink sales
Week Average Temperature Hot drink sales
1 18.5 15
2 16 10
3 13 13.5
4 19.5 15
5 20 18
6 19 14
7 15.5 13
8 14 8.5
9

9 12.5 6
10 15 9
Coefficient correlation 0.8
Determination of correlation 0.64
Determination of correlation:
This is denoted by r2. This is used to determine the way in that a statistical data
model explains and predicts the future outcomes. This indicates variability in data set. There are
two variable which are dependent and independent which are shown as x and y. The formula for
determination of correlation is as follows:
Formula: (Correlation coefficient)2
From the above table it can be seen that correlation of coefficient for client c is .80 and
determination is 64.
C. Equation that may helps to predict sales for a future period
The estimated future sales according to changes in temperature can be obtain by attaining
following equation. The equation is being prepared as under:
Formula: Sales of week A + Sales of week B / 2
Sales of week A = Sales of average temperature below the temperature of desired sales
Sale of week B = Sales of average temperature above the temperature of desired sales.
When the client is willing to predict the sales on that temperature which is more than the
higher temperature on which that have not yet been achieved by client.
Formula: Sales of nearest temperature of higher temperature – sales at more temperature *
difference between high temperature and desired temperature
D. Prediction of sales
Sales at 17oC= sales of week 2nd = sales of week 6/ 2
= 10+14/2
= 12
Sales at 25oC= Sales of week 5th – sales of week 6th *( Desired temperature- temperature in
week 5)
= 18-14 (25-20)
= 4*5
10
⊘ This is a preview!⊘
Do you want full access?
Subscribe today to unlock all pages.

Trusted by 1+ million students worldwide
1 out of 21
Related Documents

Your All-in-One AI-Powered Toolkit for Academic Success.
+13062052269
info@desklib.com
Available 24*7 on WhatsApp / Email
Unlock your academic potential
Copyright © 2020–2025 A2Z Services. All Rights Reserved. Developed and managed by ZUCOL.