ECON 940 - Statistics for Decision Making: Car Preference Analysis
VerifiedAdded on 2023/06/10
|30
|5649
|175
Report
AI Summary
This report presents a statistical analysis of luxury car preferences (BMW, Mercedes, and Lexus) based on a survey conducted in 2012. The analysis explores the relationship between buyer demographics (age, income, and education) and car preference. Descriptive statistics and graphical representations are used to analyze the distribution of age, income, and education levels among buyers of each car brand. Hypothesis testing is employed to determine if there are significant differences in the average age, income, and education levels of buyers across different car brands. The report finds that Mercedes is the most favored car overall, and purchasing decisions are influenced by age, income, and education levels. The study concludes with recommendations for the Automobile Association to better understand consumer profiles and target potential buyers effectively. Desklib provides access to similar solved assignments and resources for students.
Running Head: STATISTICS FOR DECISION MAKING
Statistics for Decision Making
Name of the Student:
Name of the University:
Author note
Statistics for Decision Making
Name of the Student:
Name of the University:
Author note
Paraphrase This Document
Need a fresh take? Get an instant paraphrase of this document with our AI Paraphraser

1STATISTICS FOR DECISION MAKING
Executive Summary:
Luxury cars are one of the main source of showcasing the persona of the human being,
however, as per the latest survey by the Nelson Perera during 2012 there is much amount of
ambiguity regarding the same. As per the survey, there are factors like age, income, education
that alters the preference of the buyers and among all the car producers MBW, Mercedes and
Lexus is the most popular luxury car makers among people. This report is aimed to discuss the
recent car survey data with the aid of the statistical tools and software like Excel. For better
understanding of the preference for buying cars, the report will consider different hypothesis and
depict the data with the graphical presentation. From the analysis, it can be seen that the
Mercedes is one of the most favoured car among all the three alternative of luxury cars.
Purchasing of the same is influenced by the age, income and education level. Whereas, the above
analysis has also showcased that there is considerable amount if importance of education, age
and income on the selection of luxury car.
2STATISTICS FOR DECISION MAKING
Table of Contents
Introduction:....................................................................................................................................3
Business Problem:.......................................................................................................................3
Statistical Problem:......................................................................................................................3
Analysis:..........................................................................................................................................5
Different age group statistical output analysis:...........................................................................5
Analysis of statistical data of different income groups:............................................................11
Analysis of different education years:.......................................................................................17
Significant difference of the average ages of the buyers:..........................................................23
Significant difference in mean household income:...................................................................23
Significant difference in average years of education:................................................................24
Preference of car of older people:..............................................................................................26
Recommendation and conclusion:.................................................................................................27
Reference:......................................................................................................................................29
⊘ This is a preview!⊘
Do you want full access?
Subscribe today to unlock all pages.
Trusted by 1+ million students worldwide
3STATISTICS FOR DECISION MAKING
Introduction:
This report is aimed to discuss the recent car survey data with the aid of the statistical
tools and software like Excel. For better understanding of the preference for buying cars, the
report will consider different hypothesis and depict the data with the graphical presentation.
Moving forward, the report will portray the impact of the finding and recommendations will be
given to gauge to enhance the present situation.
Business Problem:
As per the given context, it can be seen that the Automobile Association attempted to
predict the demand of luxury cars utilising the survey performed by Nelson Perera during the
year 2012. In order to direct the survey, various factors that can alter the preference of the buyer
and change the demand of the cars has been chosen. The business problem in this case lies within
the relation between age, education years of the buyer, and income with the car purchasing
preference (Zhang and Kim 2013). To be more specific, objective of the business is to determine
three different models of consumer preference for purchasing cars depending upon the age of
consumer, education years of the buyer and income of the purchaser. It will help the Automobile
Association to establish consumer profile for different cars model and help the industry to mark
their prospect buyers.
Statistical Problem:
The business problem as per the direction need to be analysed with the help of statistical
tool and theories. In order to perform statistical interpretation of the given data, distribution of
income, education years of the consumer and age will be utilised. In addition to this, shape of the
distribution, location, will be judged with the help of dispersions and central tendency (Dotsch et
al. 2017). In order to determine whether there is any association between the willingness to buy
Paraphrase This Document
Need a fresh take? Get an instant paraphrase of this document with our AI Paraphraser
4STATISTICS FOR DECISION MAKING
Lexus, Mercedes or BMW with the age of the consumer, income of the purchaser and
educational year of the buyer. Considering the case study, it can be seen that there is much
amount of ambiguity regarding the consumer preference of buying Mercedes and for this
purpose Logistics regression has been performed and it has tested, whether older people who
have high income and higher level of education prefer Mercedes over other luxury car brands or
not (Chatterjee and Hadi 2015). Apart from this, in order to mitigate the question of relation
regarding income, average education years with the car purchasing, the report has considered
hypothesis testing that will allow the researcher to provide concrete evidence and consumer
profiling.
5STATISTICS FOR DECISION MAKING
Analysis:
Different age group statistical output analysis:
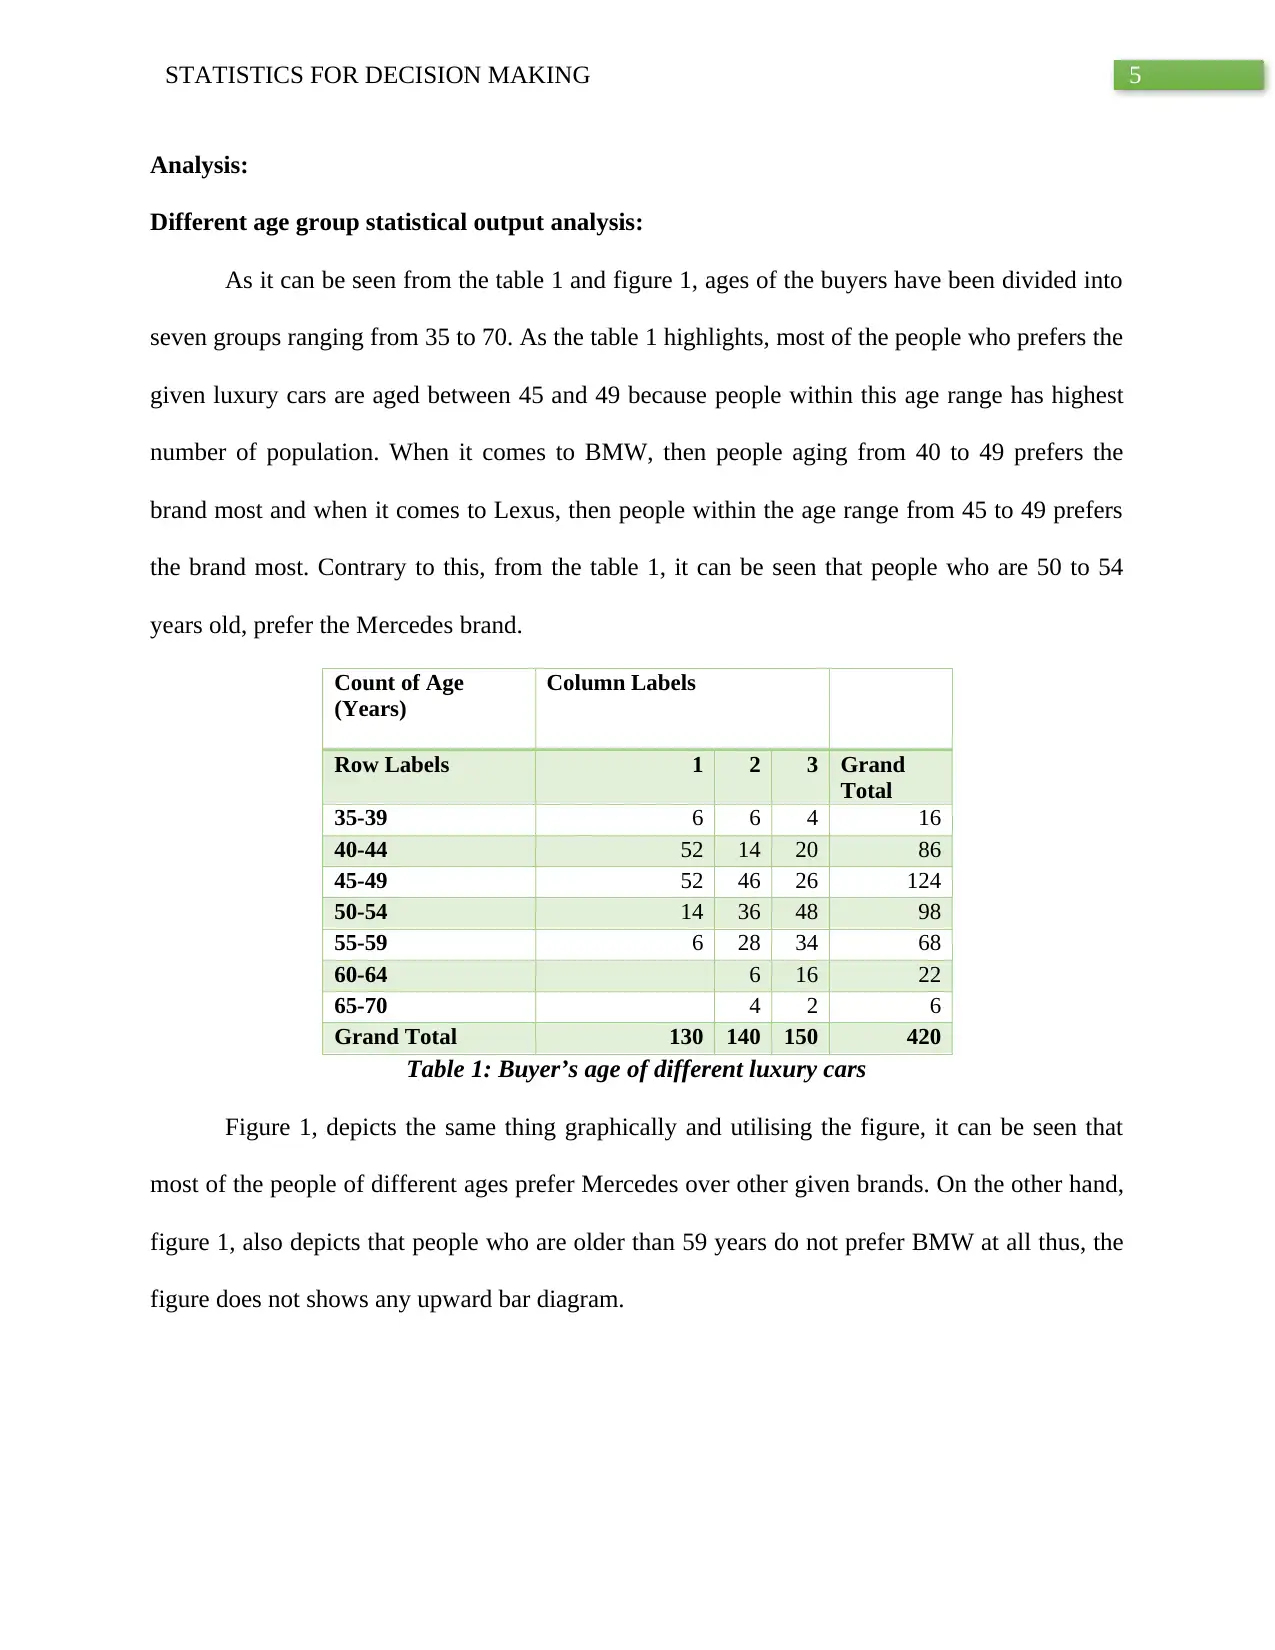
As it can be seen from the table 1 and figure 1, ages of the buyers have been divided into
seven groups ranging from 35 to 70. As the table 1 highlights, most of the people who prefers the
given luxury cars are aged between 45 and 49 because people within this age range has highest
number of population. When it comes to BMW, then people aging from 40 to 49 prefers the
brand most and when it comes to Lexus, then people within the age range from 45 to 49 prefers
the brand most. Contrary to this, from the table 1, it can be seen that people who are 50 to 54
years old, prefer the Mercedes brand.
Count of Age
(Years)
Column Labels
Row Labels 1 2 3 Grand
Total
35-39 6 6 4 16
40-44 52 14 20 86
45-49 52 46 26 124
50-54 14 36 48 98
55-59 6 28 34 68
60-64 6 16 22
65-70 4 2 6
Grand Total 130 140 150 420
Table 1: Buyer’s age of different luxury cars
Figure 1, depicts the same thing graphically and utilising the figure, it can be seen that
most of the people of different ages prefer Mercedes over other given brands. On the other hand,
figure 1, also depicts that people who are older than 59 years do not prefer BMW at all thus, the
figure does not shows any upward bar diagram.
Analysis:
Different age group statistical output analysis:
As it can be seen from the table 1 and figure 1, ages of the buyers have been divided into
seven groups ranging from 35 to 70. As the table 1 highlights, most of the people who prefers the
given luxury cars are aged between 45 and 49 because people within this age range has highest
number of population. When it comes to BMW, then people aging from 40 to 49 prefers the
brand most and when it comes to Lexus, then people within the age range from 45 to 49 prefers
the brand most. Contrary to this, from the table 1, it can be seen that people who are 50 to 54
years old, prefer the Mercedes brand.
Count of Age
(Years)
Column Labels
Row Labels 1 2 3 Grand
Total
35-39 6 6 4 16
40-44 52 14 20 86
45-49 52 46 26 124
50-54 14 36 48 98
55-59 6 28 34 68
60-64 6 16 22
65-70 4 2 6
Grand Total 130 140 150 420
Table 1: Buyer’s age of different luxury cars
Figure 1, depicts the same thing graphically and utilising the figure, it can be seen that
most of the people of different ages prefer Mercedes over other given brands. On the other hand,
figure 1, also depicts that people who are older than 59 years do not prefer BMW at all thus, the
figure does not shows any upward bar diagram.
⊘ This is a preview!⊘
Do you want full access?
Subscribe today to unlock all pages.
Trusted by 1+ million students worldwide
6STATISTICS FOR DECISION MAKING
35-39 40-44 45-49 50-54 55-59 60-64 65-70
0
10
20
30
40
50
60
1
2
3
Figure 1: Buyer’s age of different luxury cars
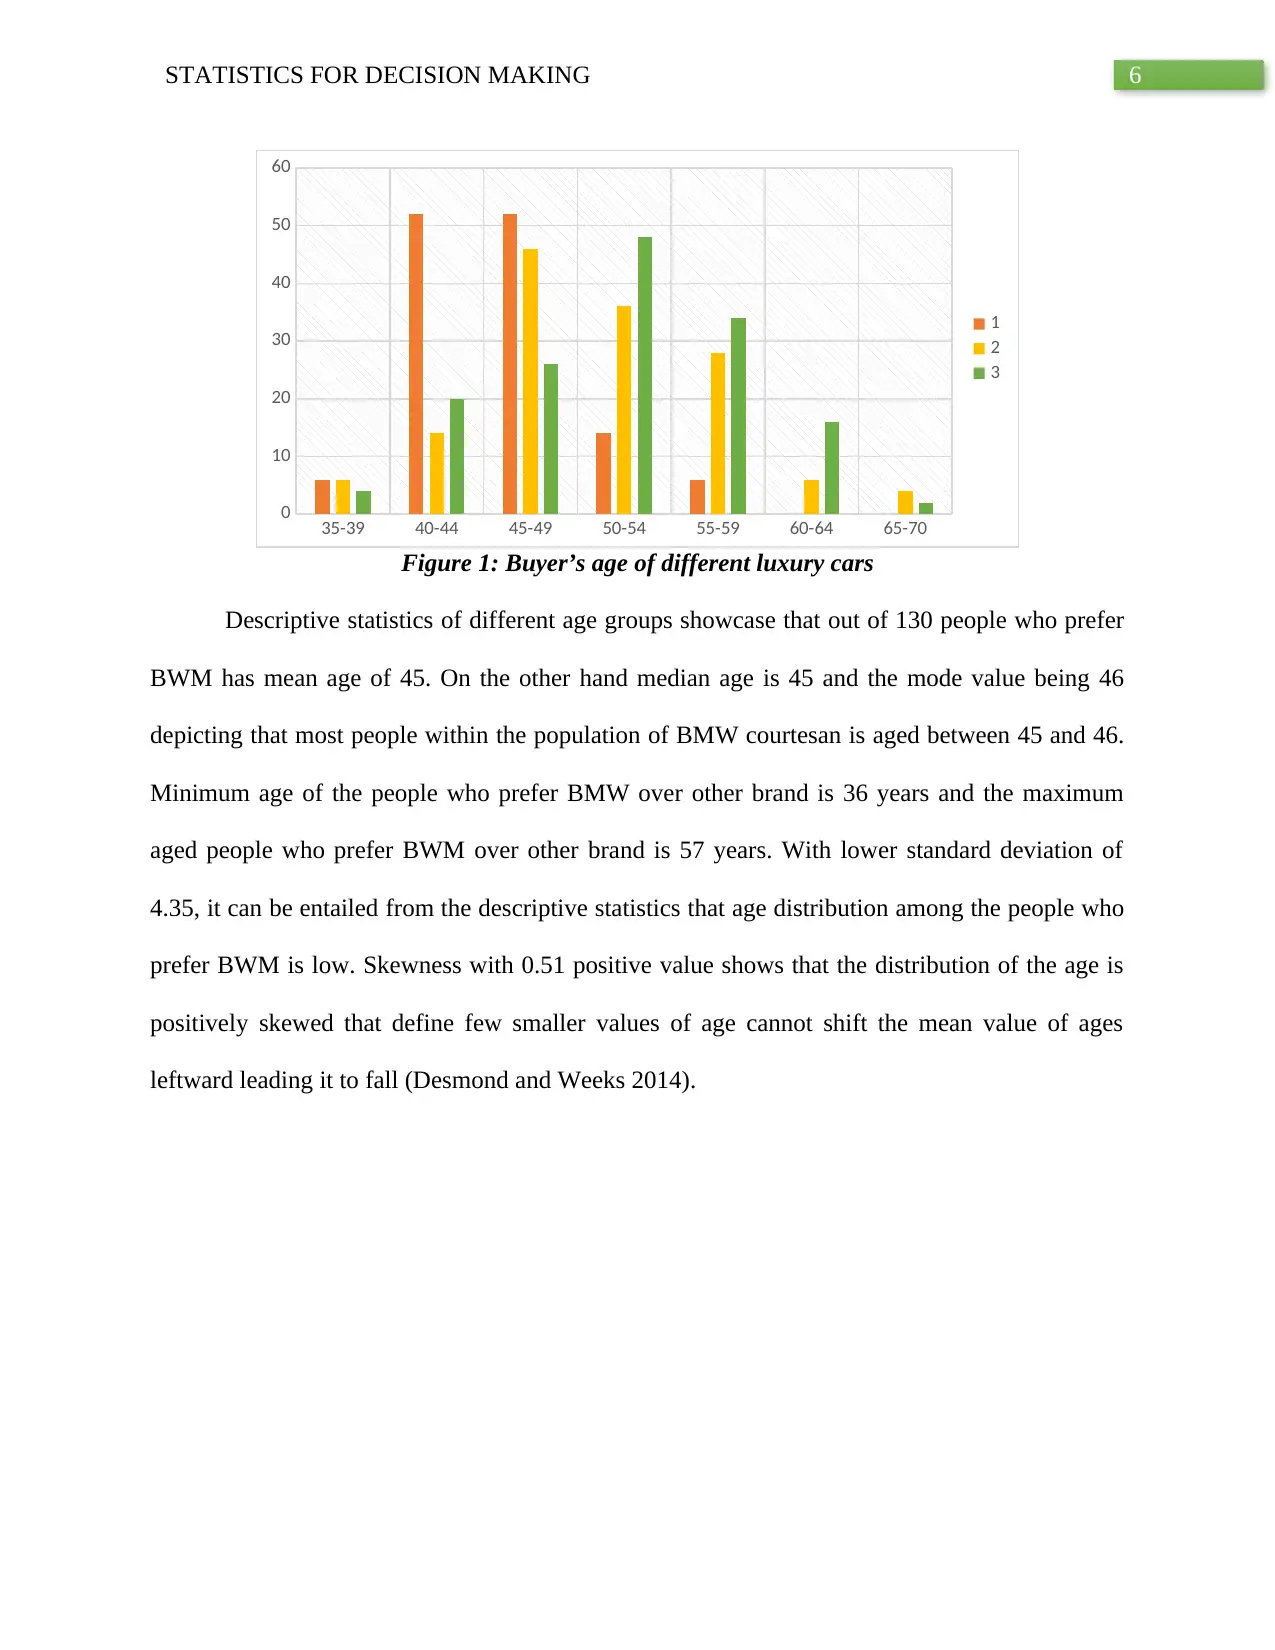
Descriptive statistics of different age groups showcase that out of 130 people who prefer
BWM has mean age of 45. On the other hand median age is 45 and the mode value being 46
depicting that most people within the population of BMW courtesan is aged between 45 and 46.
Minimum age of the people who prefer BMW over other brand is 36 years and the maximum
aged people who prefer BWM over other brand is 57 years. With lower standard deviation of
4.35, it can be entailed from the descriptive statistics that age distribution among the people who
prefer BWM is low. Skewness with 0.51 positive value shows that the distribution of the age is
positively skewed that define few smaller values of age cannot shift the mean value of ages
leftward leading it to fall (Desmond and Weeks 2014).
35-39 40-44 45-49 50-54 55-59 60-64 65-70
0
10
20
30
40
50
60
1
2
3
Figure 1: Buyer’s age of different luxury cars
Descriptive statistics of different age groups showcase that out of 130 people who prefer
BWM has mean age of 45. On the other hand median age is 45 and the mode value being 46
depicting that most people within the population of BMW courtesan is aged between 45 and 46.
Minimum age of the people who prefer BMW over other brand is 36 years and the maximum
aged people who prefer BWM over other brand is 57 years. With lower standard deviation of
4.35, it can be entailed from the descriptive statistics that age distribution among the people who
prefer BWM is low. Skewness with 0.51 positive value shows that the distribution of the age is
positively skewed that define few smaller values of age cannot shift the mean value of ages
leftward leading it to fall (Desmond and Weeks 2014).
Paraphrase This Document
Need a fresh take? Get an instant paraphrase of this document with our AI Paraphraser
7STATISTICS FOR DECISION MAKING
Age (Years) (1)
Mean 45.21538
Standard Error 0.381908
Median 45
Mode 46
Standard
Deviation
4.354423
Sample Variance 18.961
Kurtosis 0.04742
Skewness 0.508655
Range 21
Minimum 36
Maximum 57
Sum 5878
Count 130
Table 2: Descriptive Statistics for ages with preference for BMW
From the figure 2, it can also be seen that people who are aged between 40 and 47 prefer
BMW most, whereas, with rise in the age number of people preferring BMW over other brand
has been falling.
36-39 40-43 44-47 48-51 52-55 56-59
0
5
10
15
20
25
30
35
40
45
50
BMW
Figure 2: Age distribution of BMW buyers
8STATISTICS FOR DECISION MAKING
Age (Years) (2)
Mean 50.45714
Standard Error 0.515472
Median 50
Mode 55
Standard
Deviation
6.099147
Sample Variance 37.19959
Kurtosis 0.611214
Skewness 0.360262
Range 32
Minimum 36
Maximum 68
Sum 7064
Count 140
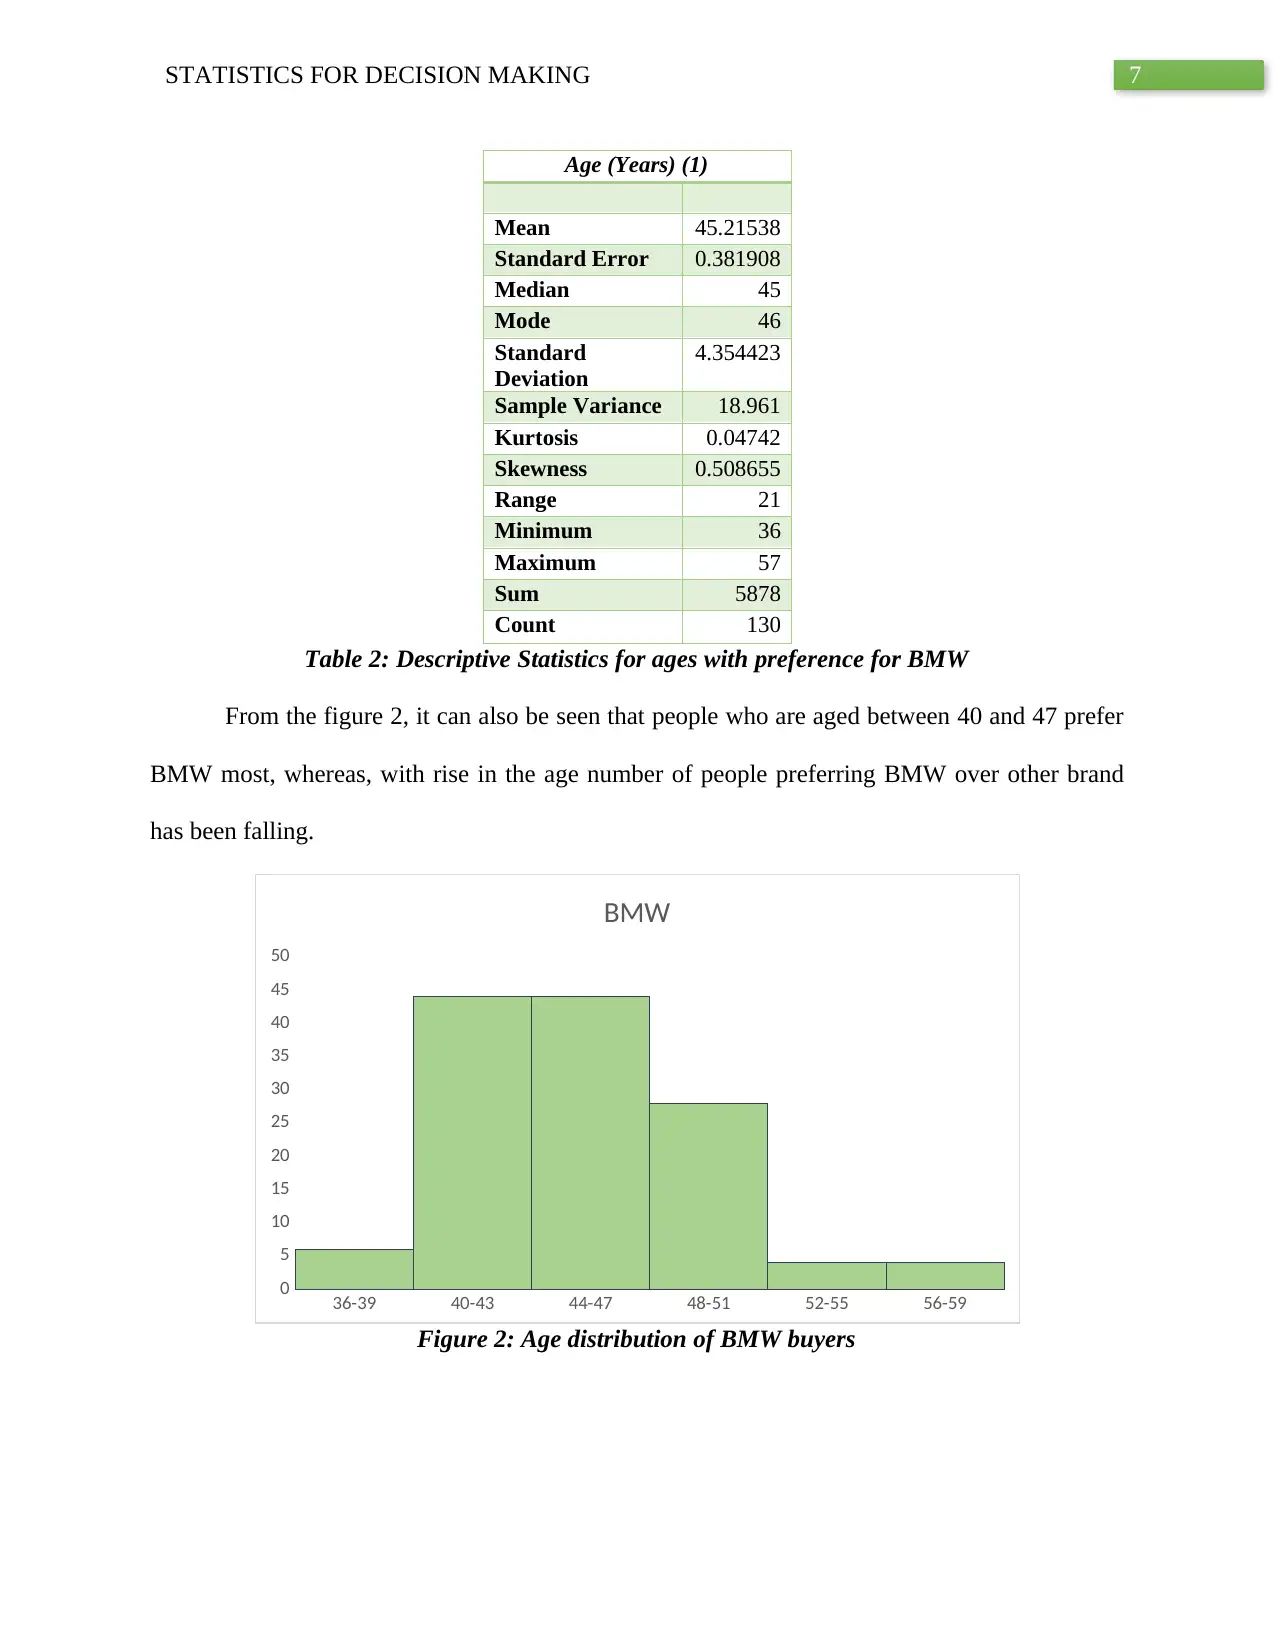
Table 3: Descriptive Statistics for ages with preference for Lexus
Moving forward, if the age distribution of people who prefer Lexus is observed, then it
can be seen that people who are 46 to 55 years old prefer the Lexus most. As the table 3
showcase, mean value of the population who prefer Lexus is 50 years and the median is also
same depicting symmetric distribution of ages. If mean and median are same, then it also implies
that Skewness will also be lower and considering the descriptive statistics table (table 3), it can
be seen that Skewness is 0.36 depicting the symmetric distribution of ages. People who are 36
years old and aged less than 69 years, prefer Lexus over other brands. Out of the given data, it
can be seen that total 140 people prefer Lexus over any other brand and it showcase that range
within the age distribution is 32.
Age (Years) (2)
Mean 50.45714
Standard Error 0.515472
Median 50
Mode 55
Standard
Deviation
6.099147
Sample Variance 37.19959
Kurtosis 0.611214
Skewness 0.360262
Range 32
Minimum 36
Maximum 68
Sum 7064
Count 140
Table 3: Descriptive Statistics for ages with preference for Lexus
Moving forward, if the age distribution of people who prefer Lexus is observed, then it
can be seen that people who are 46 to 55 years old prefer the Lexus most. As the table 3
showcase, mean value of the population who prefer Lexus is 50 years and the median is also
same depicting symmetric distribution of ages. If mean and median are same, then it also implies
that Skewness will also be lower and considering the descriptive statistics table (table 3), it can
be seen that Skewness is 0.36 depicting the symmetric distribution of ages. People who are 36
years old and aged less than 69 years, prefer Lexus over other brands. Out of the given data, it
can be seen that total 140 people prefer Lexus over any other brand and it showcase that range
within the age distribution is 32.
⊘ This is a preview!⊘
Do you want full access?
Subscribe today to unlock all pages.
Trusted by 1+ million students worldwide
9STATISTICS FOR DECISION MAKING
36-40 41-45 46-50 51-55 56-60 61-65 66-70
0
5
10
15
20
25
30
35
40
45
50
Lexus
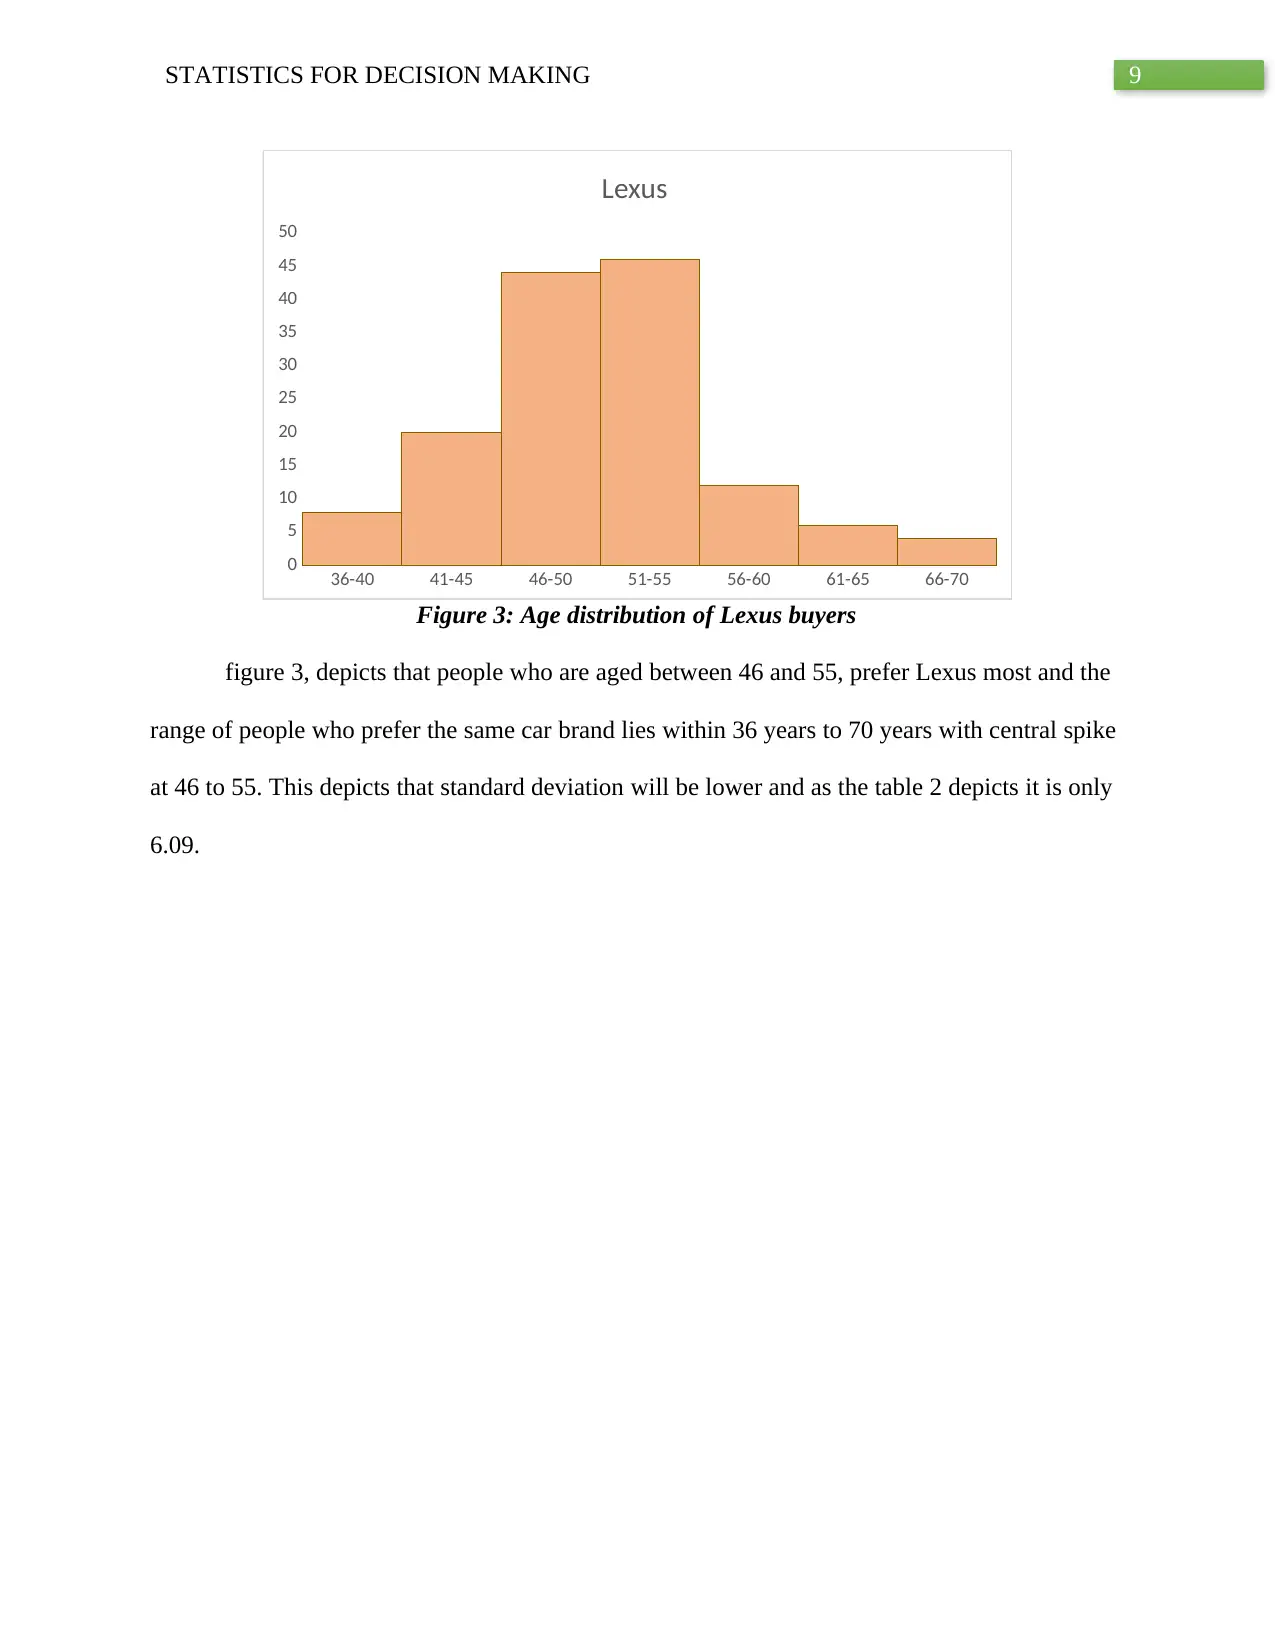
Figure 3: Age distribution of Lexus buyers
figure 3, depicts that people who are aged between 46 and 55, prefer Lexus most and the
range of people who prefer the same car brand lies within 36 years to 70 years with central spike
at 46 to 55. This depicts that standard deviation will be lower and as the table 2 depicts it is only
6.09.
36-40 41-45 46-50 51-55 56-60 61-65 66-70
0
5
10
15
20
25
30
35
40
45
50
Lexus
Figure 3: Age distribution of Lexus buyers
figure 3, depicts that people who are aged between 46 and 55, prefer Lexus most and the
range of people who prefer the same car brand lies within 36 years to 70 years with central spike
at 46 to 55. This depicts that standard deviation will be lower and as the table 2 depicts it is only
6.09.
Paraphrase This Document
Need a fresh take? Get an instant paraphrase of this document with our AI Paraphraser
10STATISTICS FOR DECISION MAKING
Age (Years)(3)
Mean 51.98667
Standard Error 0.55037
Median 53
Mode 53
Standard
Deviation
6.740628
Sample Variance 45.43606
Kurtosis -0.0195
Skewness -0.02894
Range 35
Minimum 35
Maximum 70
Sum 7798
Count 150
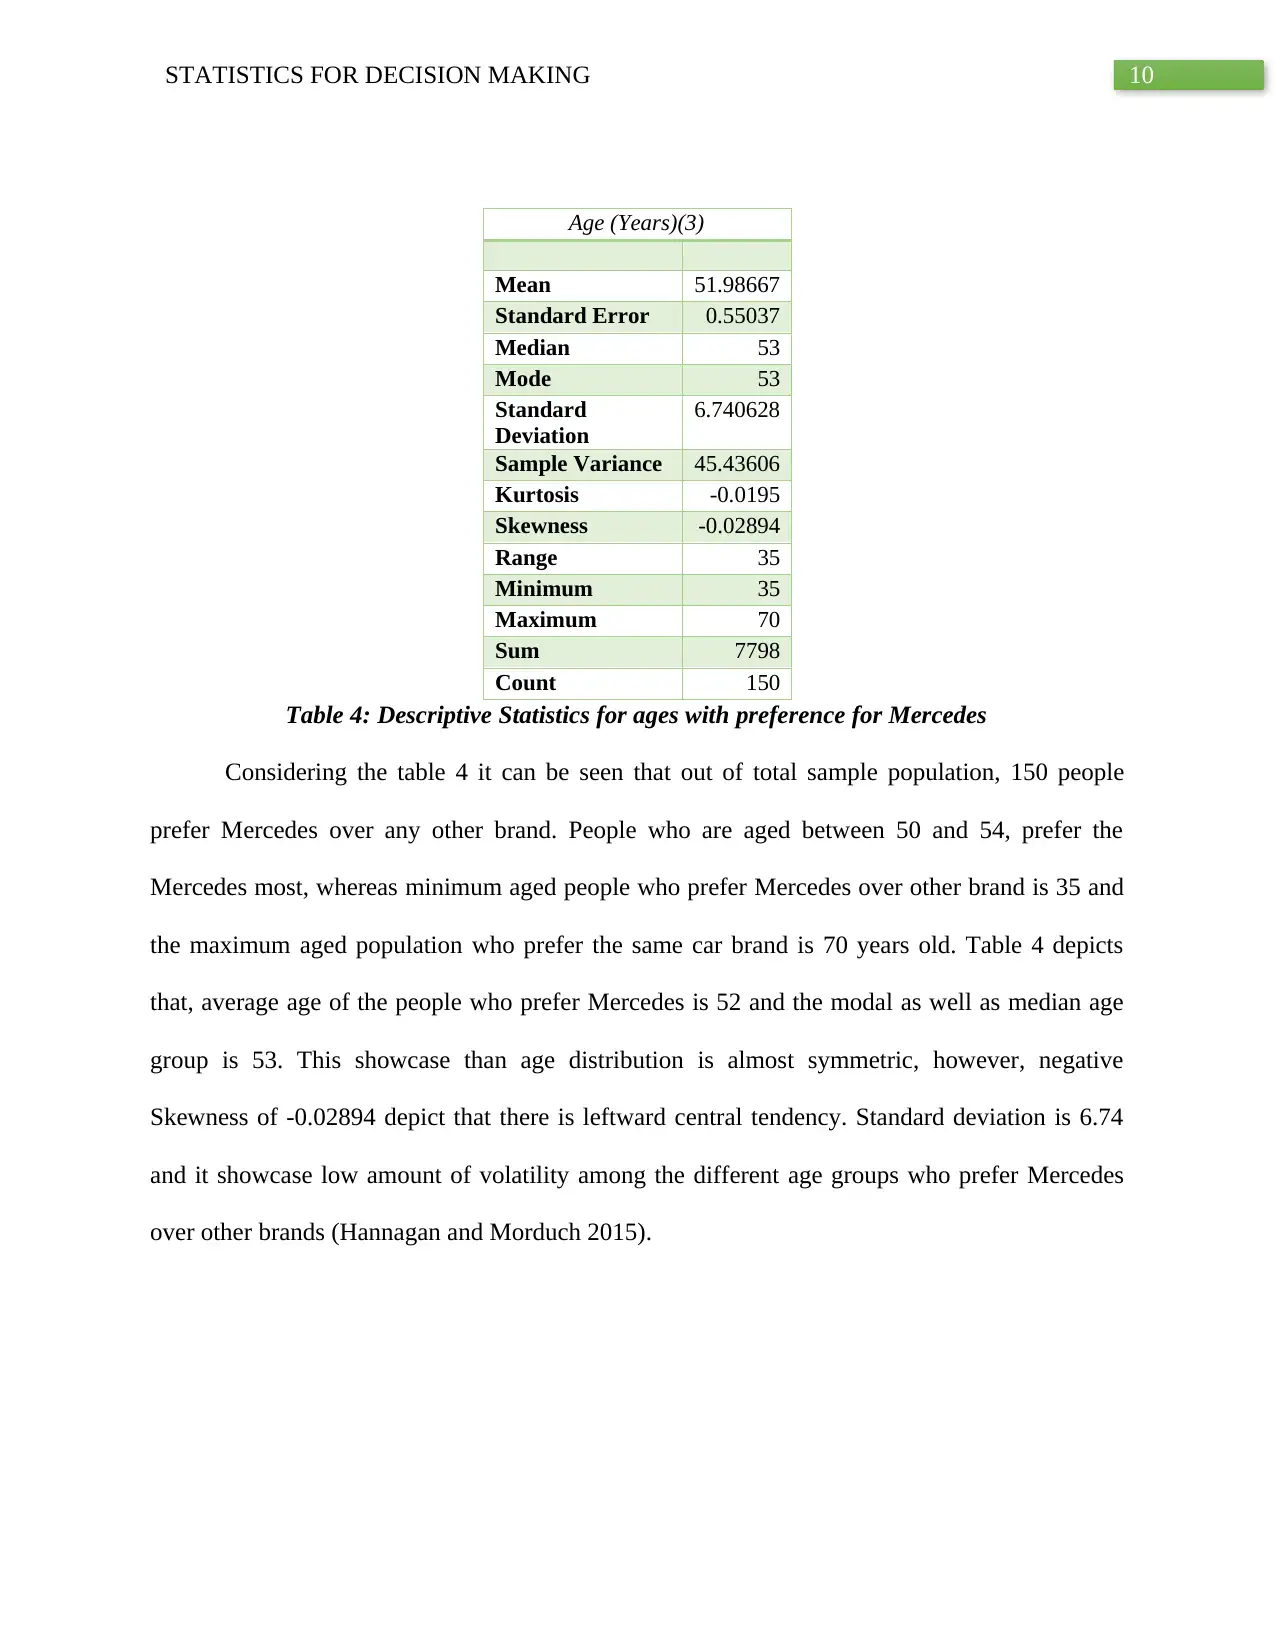
Table 4: Descriptive Statistics for ages with preference for Mercedes
Considering the table 4 it can be seen that out of total sample population, 150 people
prefer Mercedes over any other brand. People who are aged between 50 and 54, prefer the
Mercedes most, whereas minimum aged people who prefer Mercedes over other brand is 35 and
the maximum aged population who prefer the same car brand is 70 years old. Table 4 depicts
that, average age of the people who prefer Mercedes is 52 and the modal as well as median age
group is 53. This showcase than age distribution is almost symmetric, however, negative
Skewness of -0.02894 depict that there is leftward central tendency. Standard deviation is 6.74
and it showcase low amount of volatility among the different age groups who prefer Mercedes
over other brands (Hannagan and Morduch 2015).
Age (Years)(3)
Mean 51.98667
Standard Error 0.55037
Median 53
Mode 53
Standard
Deviation
6.740628
Sample Variance 45.43606
Kurtosis -0.0195
Skewness -0.02894
Range 35
Minimum 35
Maximum 70
Sum 7798
Count 150
Table 4: Descriptive Statistics for ages with preference for Mercedes
Considering the table 4 it can be seen that out of total sample population, 150 people
prefer Mercedes over any other brand. People who are aged between 50 and 54, prefer the
Mercedes most, whereas minimum aged people who prefer Mercedes over other brand is 35 and
the maximum aged population who prefer the same car brand is 70 years old. Table 4 depicts
that, average age of the people who prefer Mercedes is 52 and the modal as well as median age
group is 53. This showcase than age distribution is almost symmetric, however, negative
Skewness of -0.02894 depict that there is leftward central tendency. Standard deviation is 6.74
and it showcase low amount of volatility among the different age groups who prefer Mercedes
over other brands (Hannagan and Morduch 2015).
11STATISTICS FOR DECISION MAKING
35-39 40-44 45-49 50-54 55-59 60-64 65-70
0
10
20
30
40
50
60
Mercedes
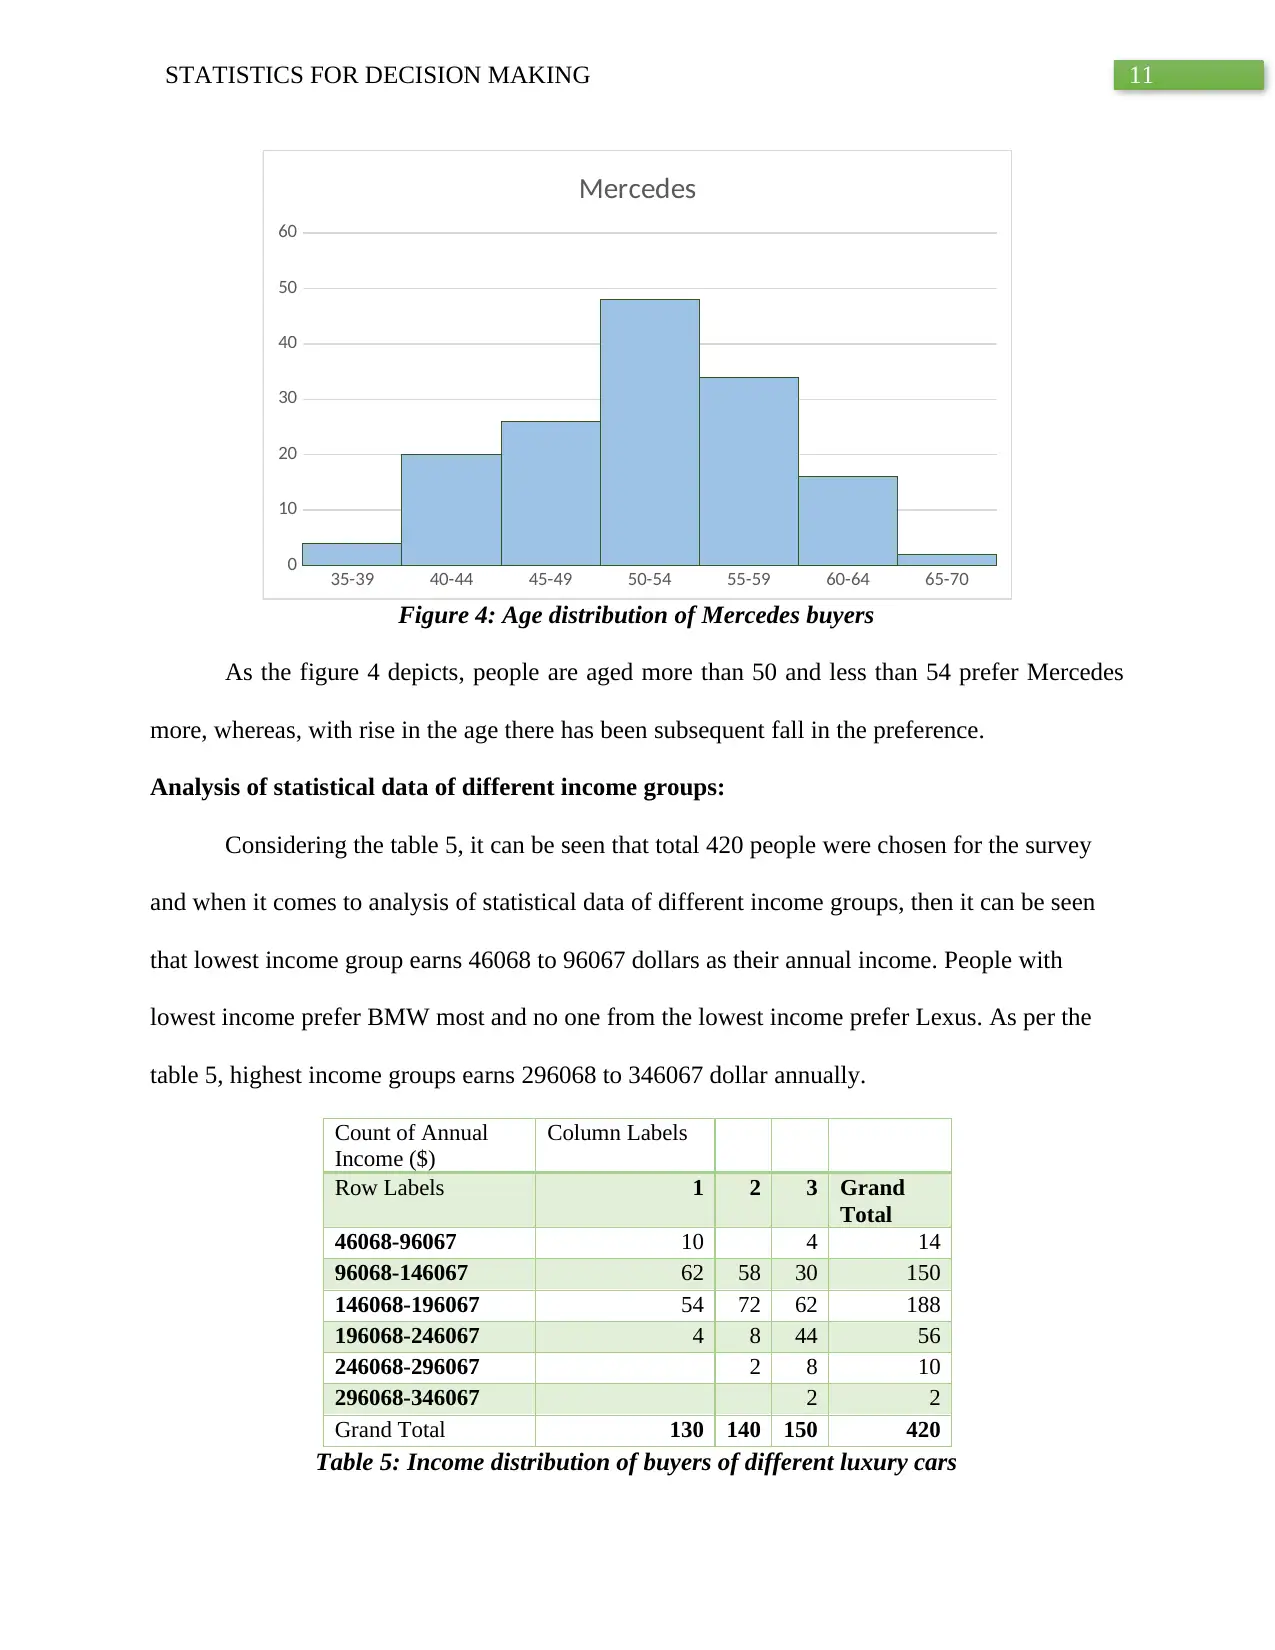
Figure 4: Age distribution of Mercedes buyers
As the figure 4 depicts, people are aged more than 50 and less than 54 prefer Mercedes
more, whereas, with rise in the age there has been subsequent fall in the preference.
Analysis of statistical data of different income groups:
Considering the table 5, it can be seen that total 420 people were chosen for the survey
and when it comes to analysis of statistical data of different income groups, then it can be seen
that lowest income group earns 46068 to 96067 dollars as their annual income. People with
lowest income prefer BMW most and no one from the lowest income prefer Lexus. As per the
table 5, highest income groups earns 296068 to 346067 dollar annually.
Count of Annual
Income ($)
Column Labels
Row Labels 1 2 3 Grand
Total
46068-96067 10 4 14
96068-146067 62 58 30 150
146068-196067 54 72 62 188
196068-246067 4 8 44 56
246068-296067 2 8 10
296068-346067 2 2
Grand Total 130 140 150 420
Table 5: Income distribution of buyers of different luxury cars
35-39 40-44 45-49 50-54 55-59 60-64 65-70
0
10
20
30
40
50
60
Mercedes
Figure 4: Age distribution of Mercedes buyers
As the figure 4 depicts, people are aged more than 50 and less than 54 prefer Mercedes
more, whereas, with rise in the age there has been subsequent fall in the preference.
Analysis of statistical data of different income groups:
Considering the table 5, it can be seen that total 420 people were chosen for the survey
and when it comes to analysis of statistical data of different income groups, then it can be seen
that lowest income group earns 46068 to 96067 dollars as their annual income. People with
lowest income prefer BMW most and no one from the lowest income prefer Lexus. As per the
table 5, highest income groups earns 296068 to 346067 dollar annually.
Count of Annual
Income ($)
Column Labels
Row Labels 1 2 3 Grand
Total
46068-96067 10 4 14
96068-146067 62 58 30 150
146068-196067 54 72 62 188
196068-246067 4 8 44 56
246068-296067 2 8 10
296068-346067 2 2
Grand Total 130 140 150 420
Table 5: Income distribution of buyers of different luxury cars
⊘ This is a preview!⊘
Do you want full access?
Subscribe today to unlock all pages.
Trusted by 1+ million students worldwide
1 out of 30
Related Documents


Your All-in-One AI-Powered Toolkit for Academic Success.
+13062052269
info@desklib.com
Available 24*7 on WhatsApp / Email
![[object Object]](/_next/static/media/star-bottom.7253800d.svg)
Unlock your academic potential
Copyright © 2020–2026 A2Z Services. All Rights Reserved. Developed and managed by ZUCOL.