MATH 200 Module 3 Case Assignment: Statistical Analysis and Solutions

Verified

Added on  2019/09/26

|7
|1109
|355
Homework Assignment
AI Summary
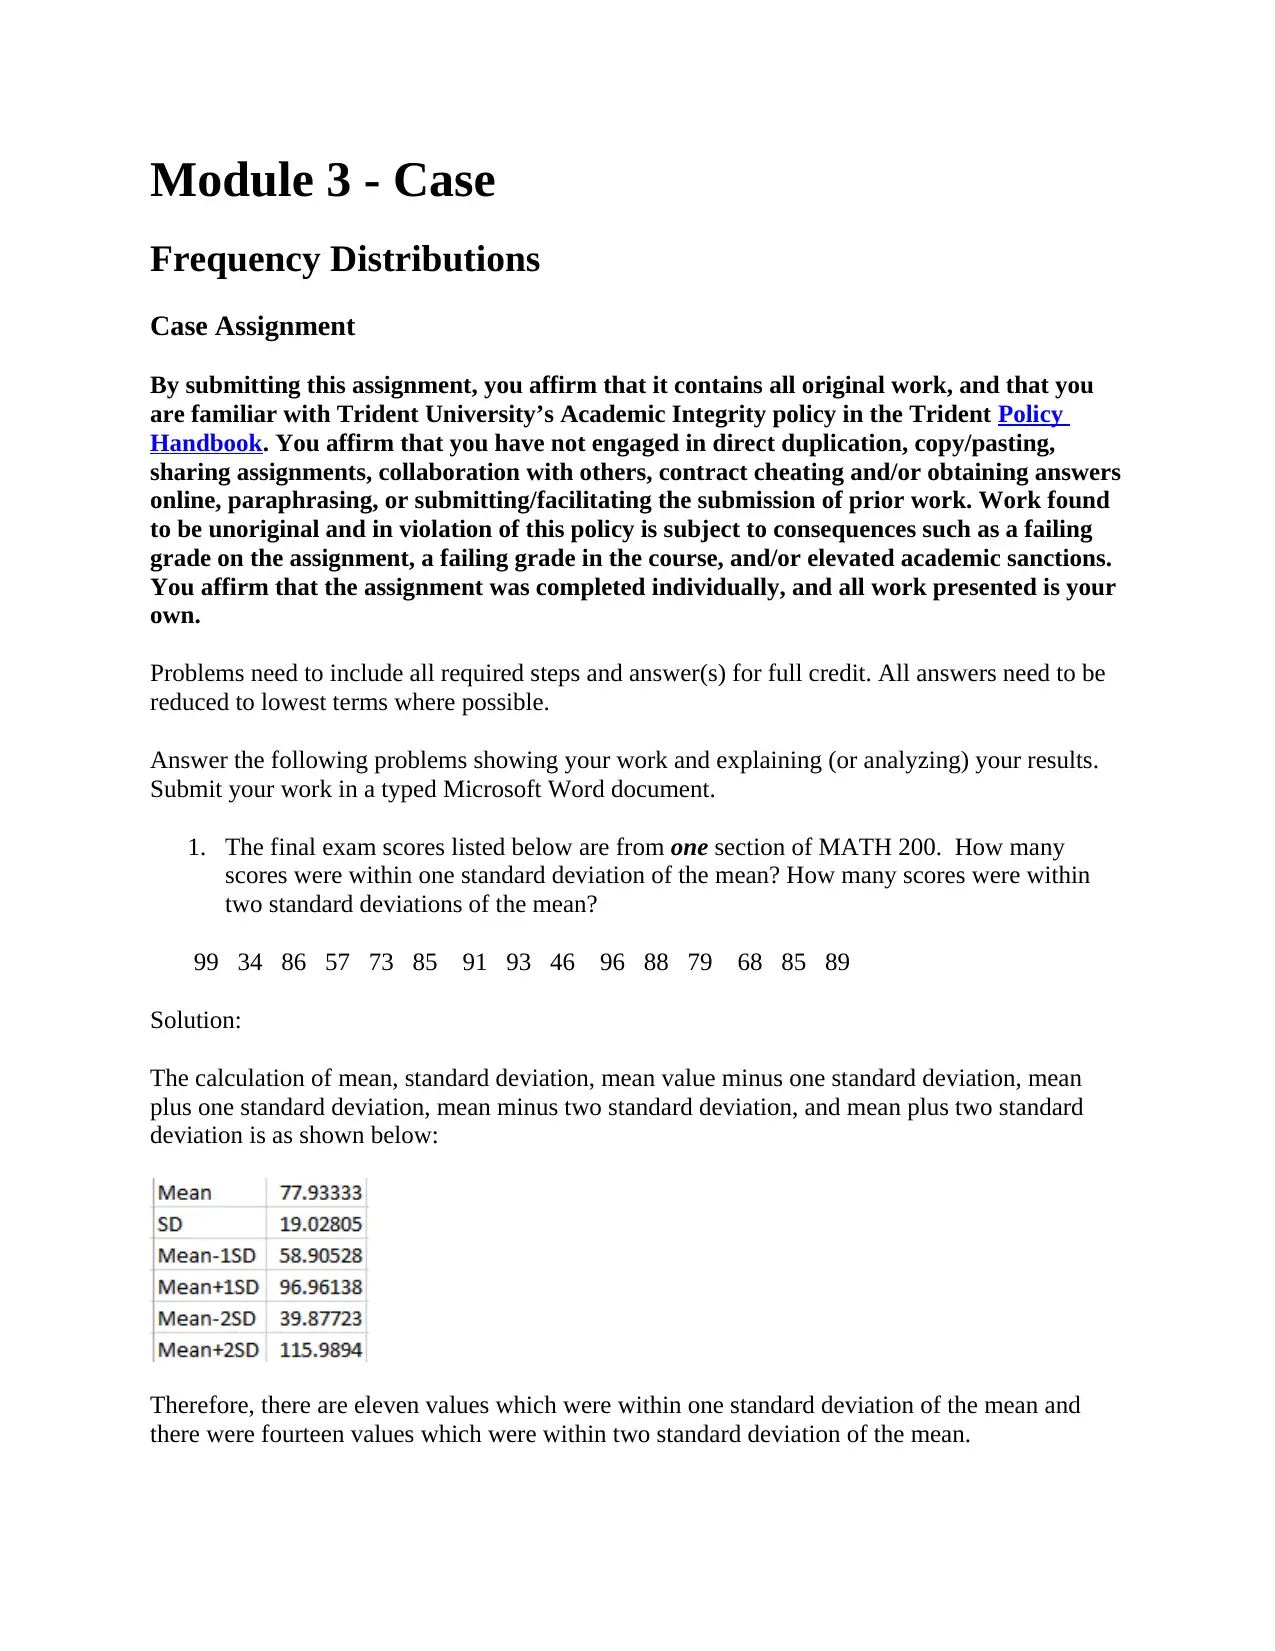
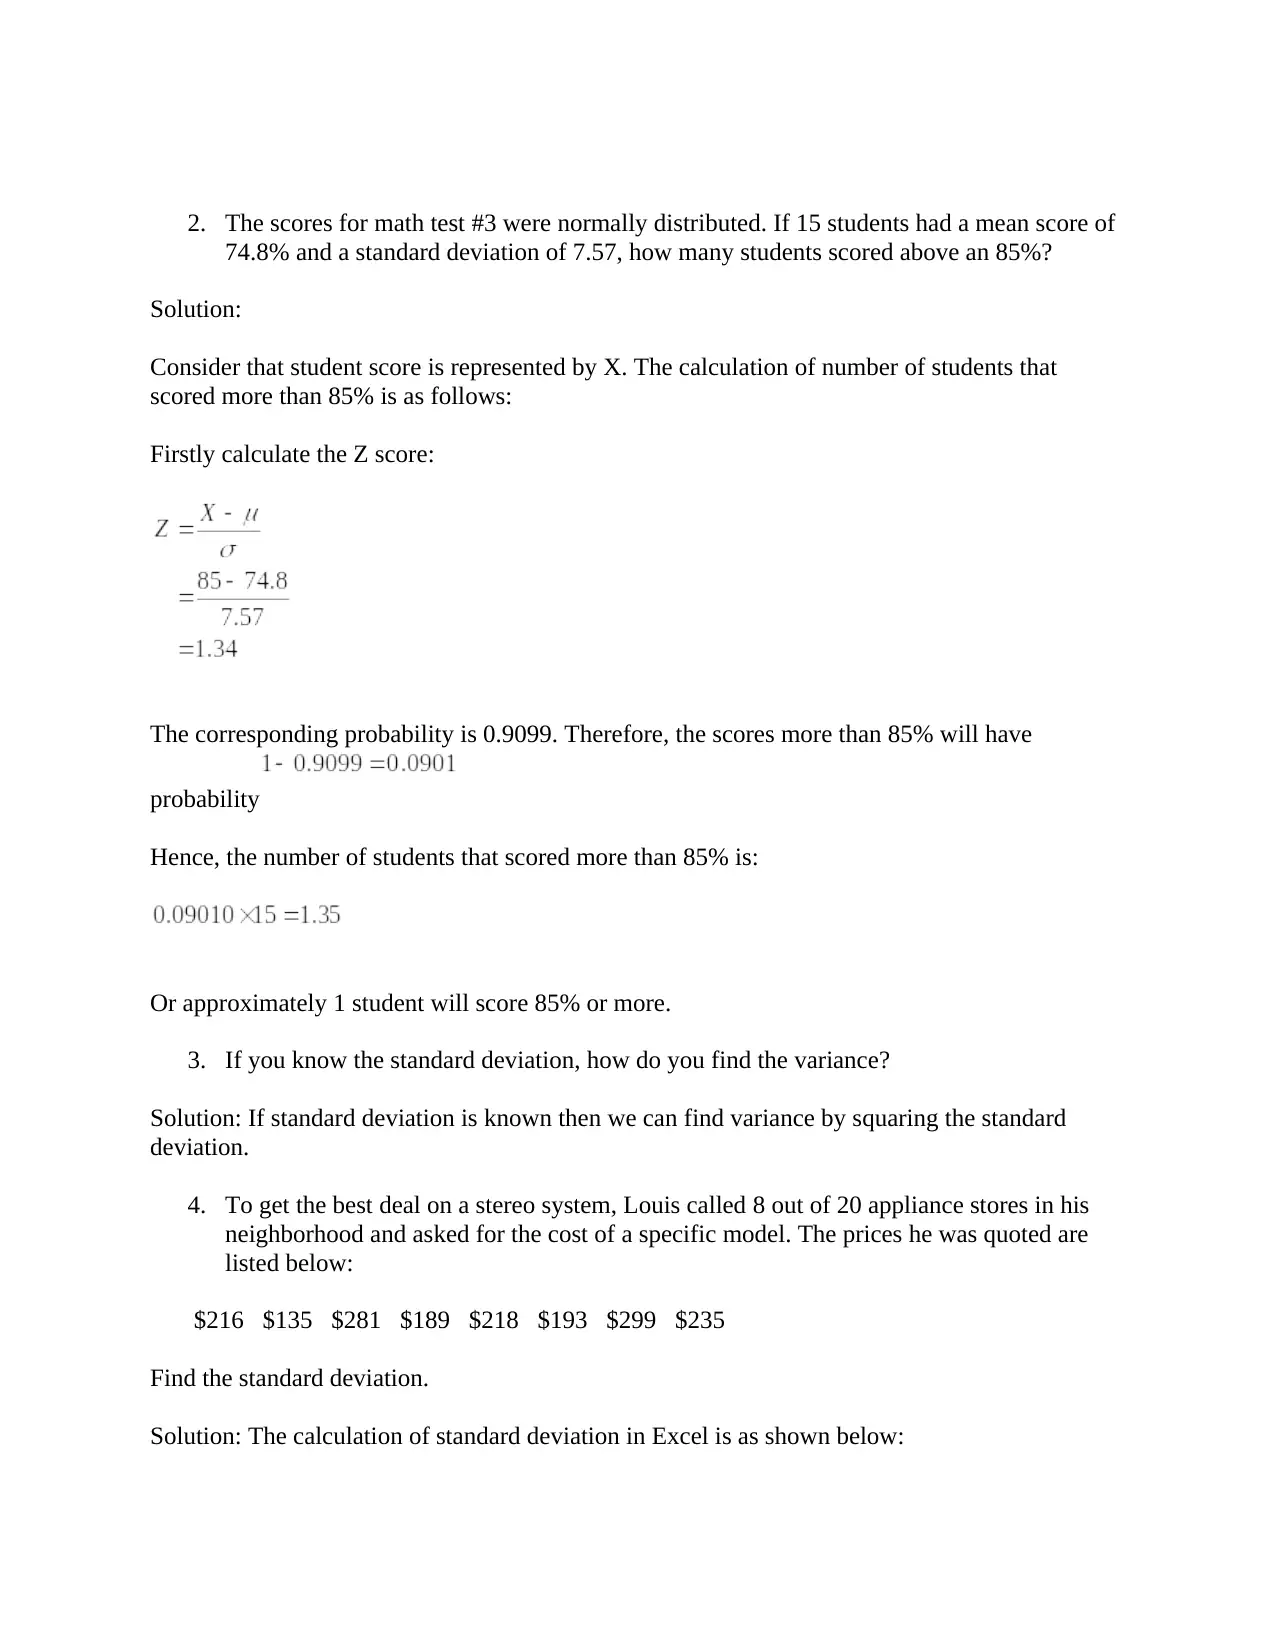
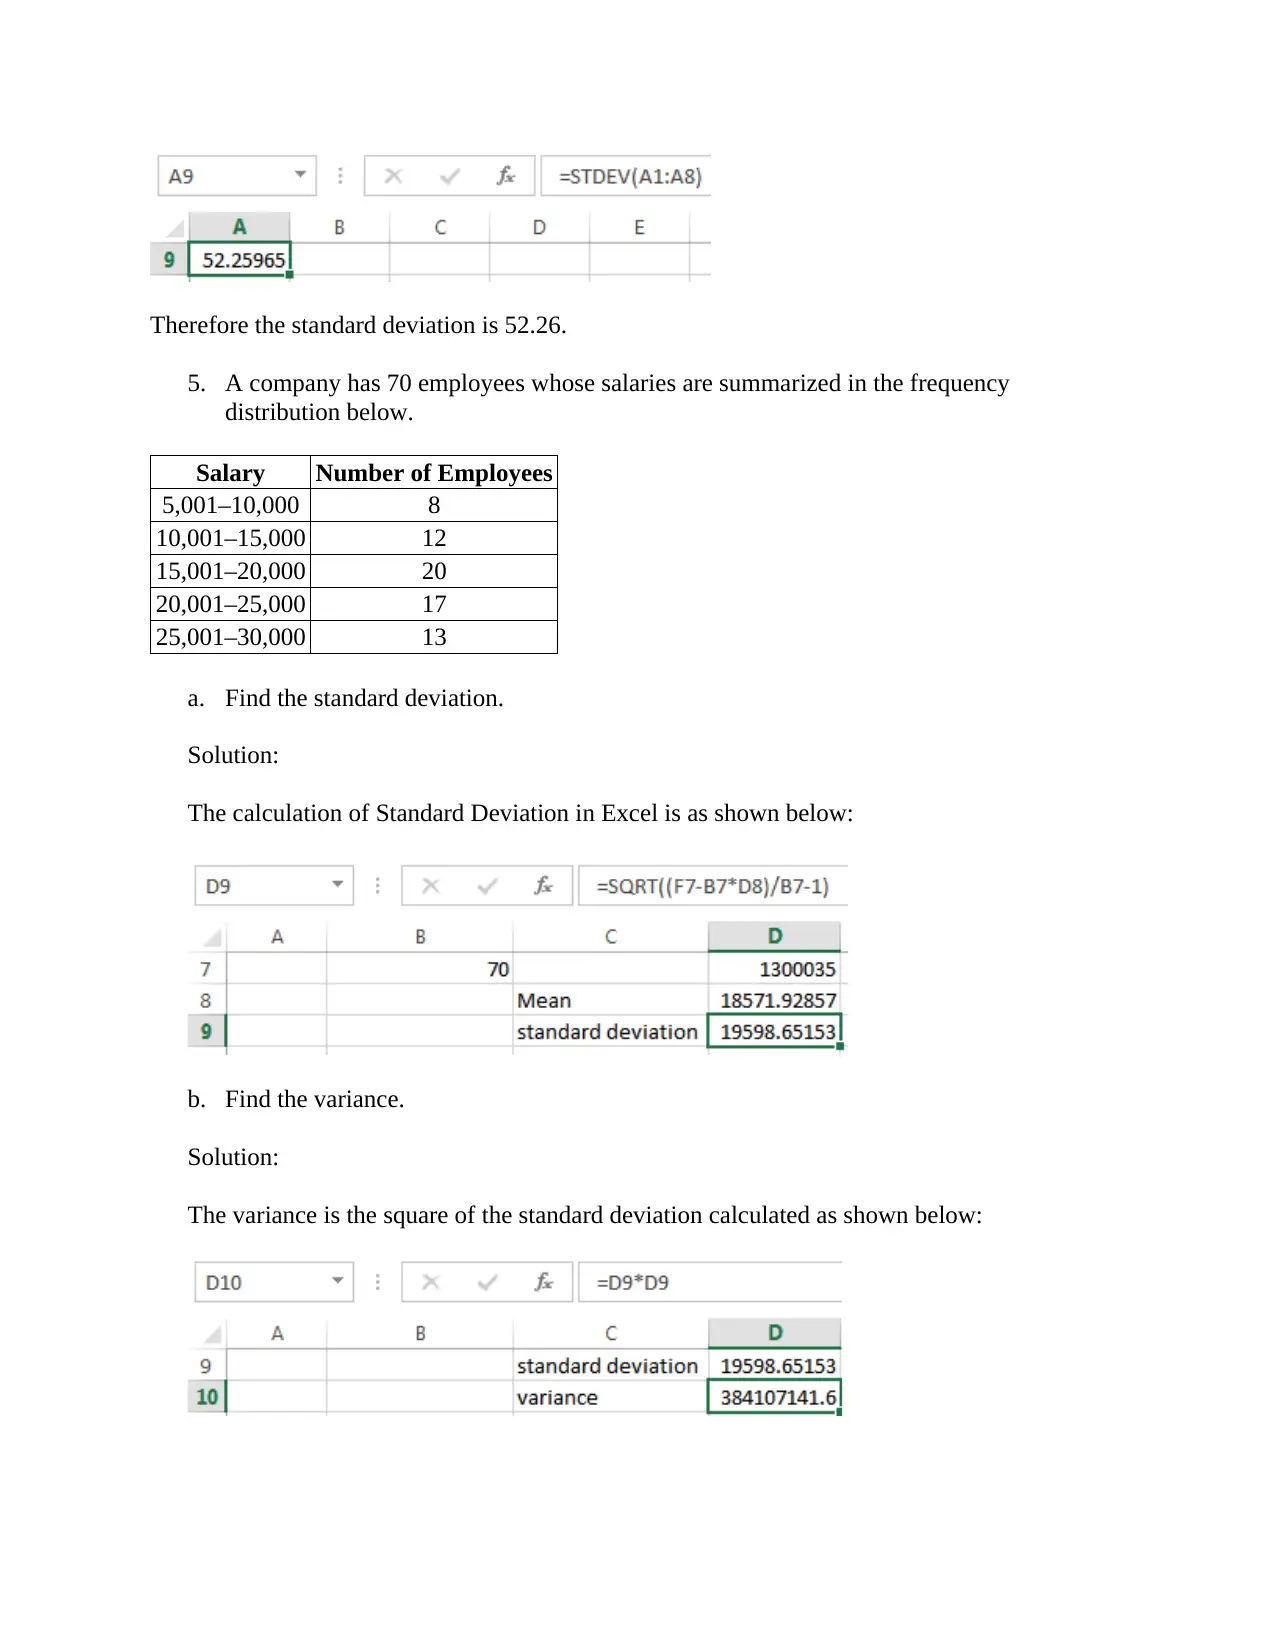
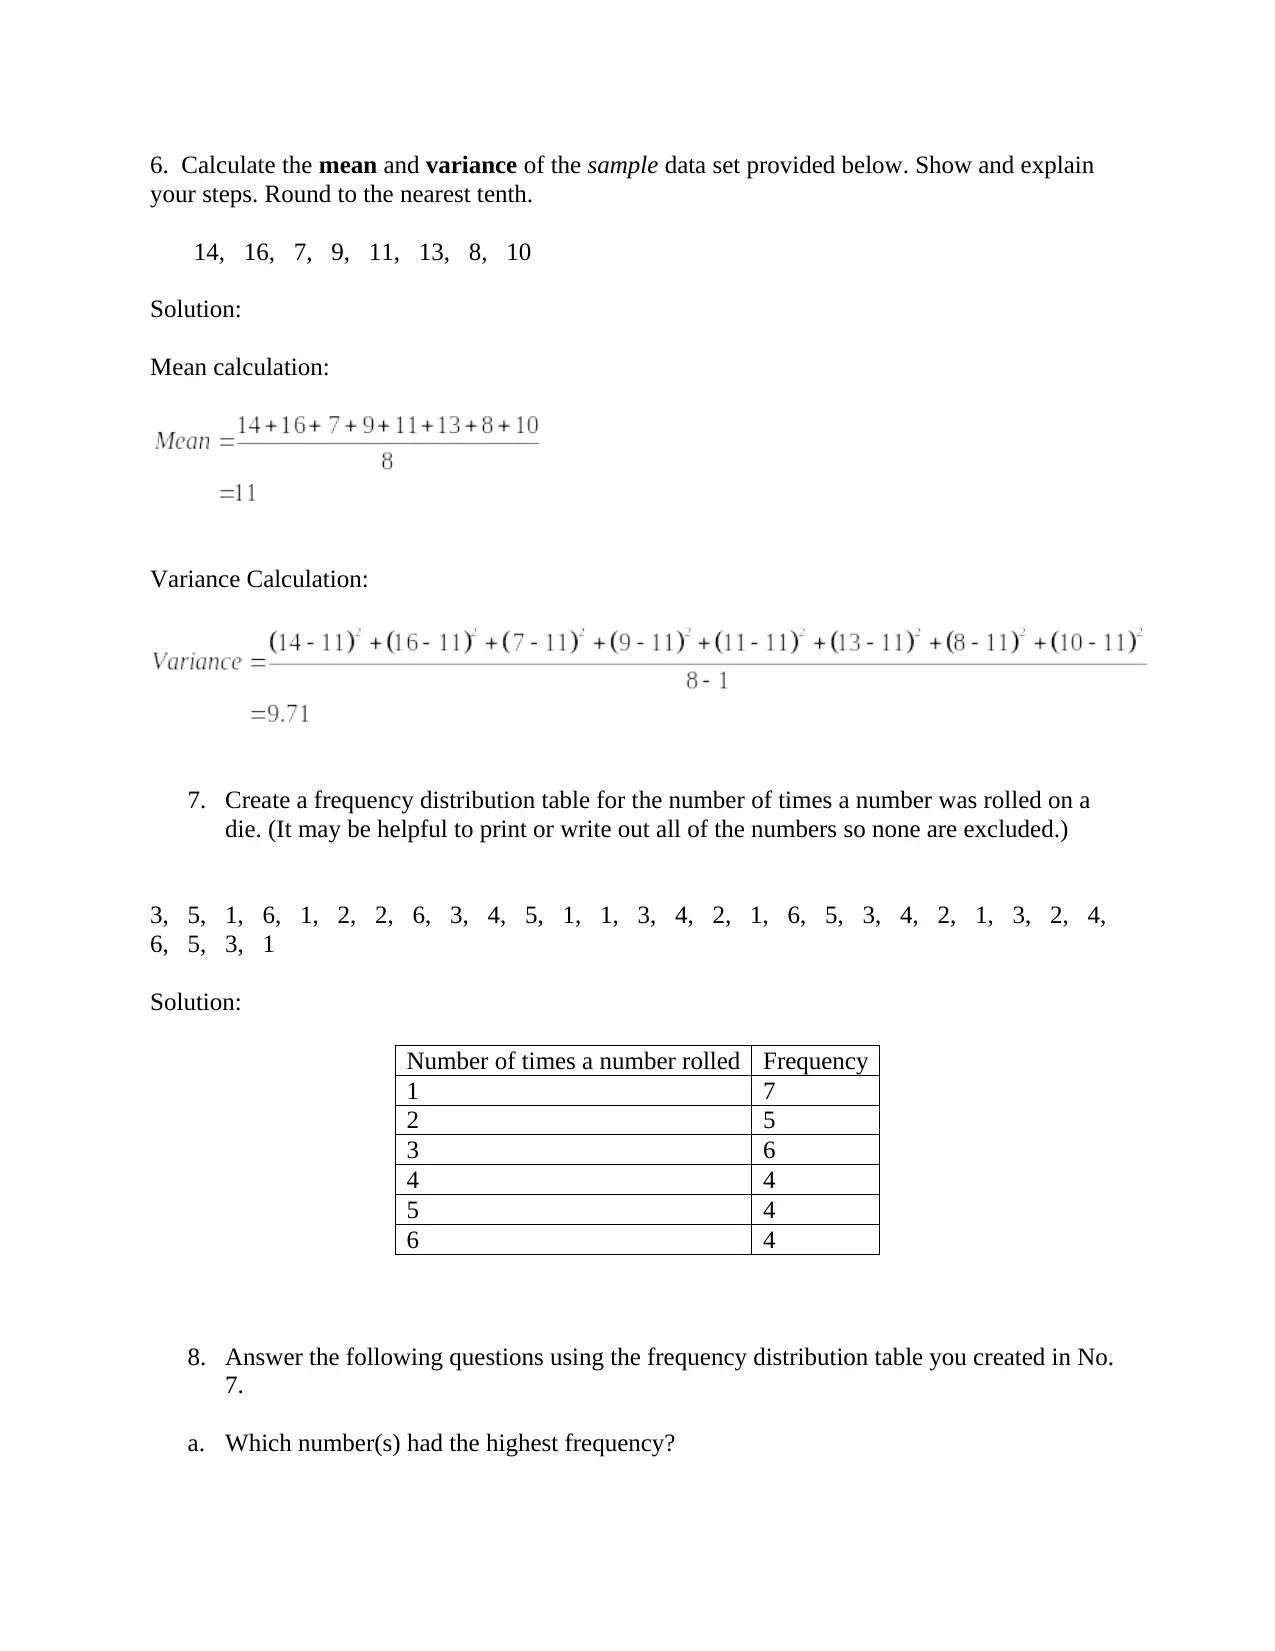
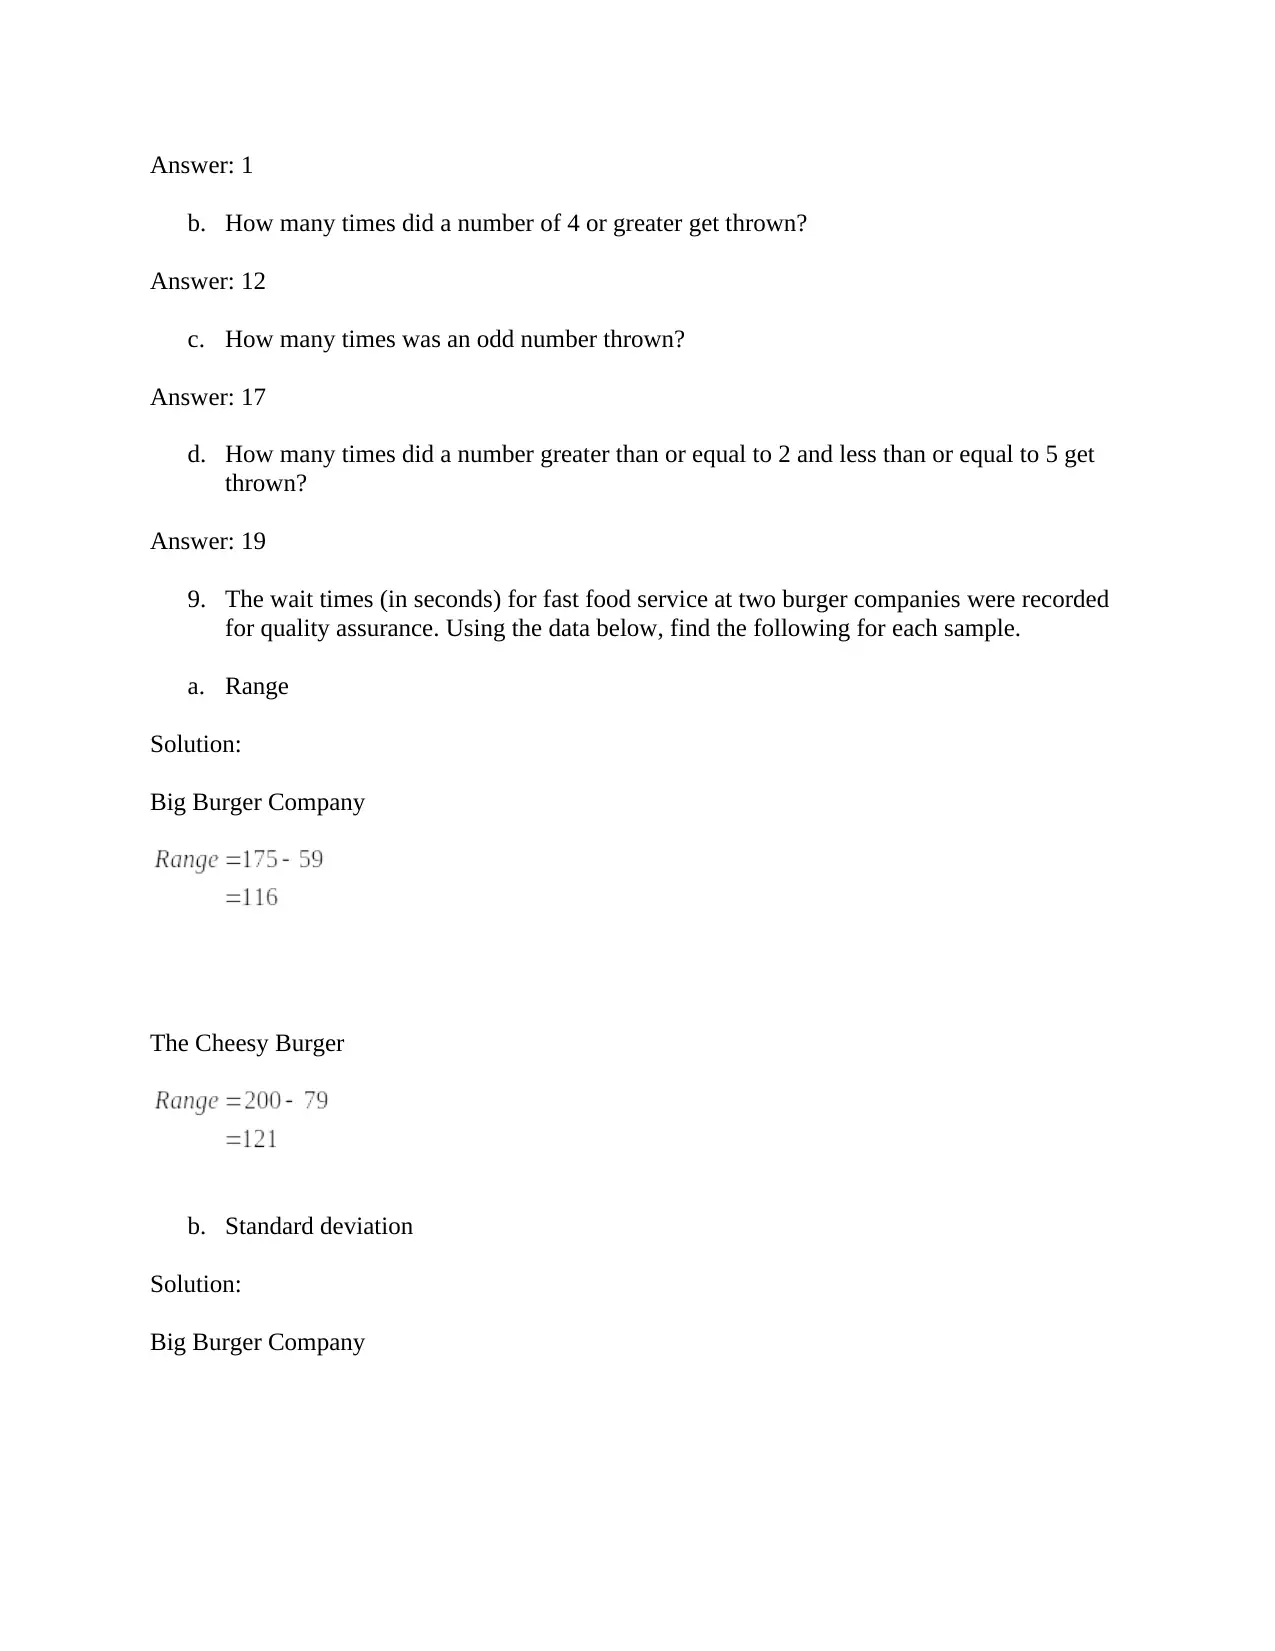
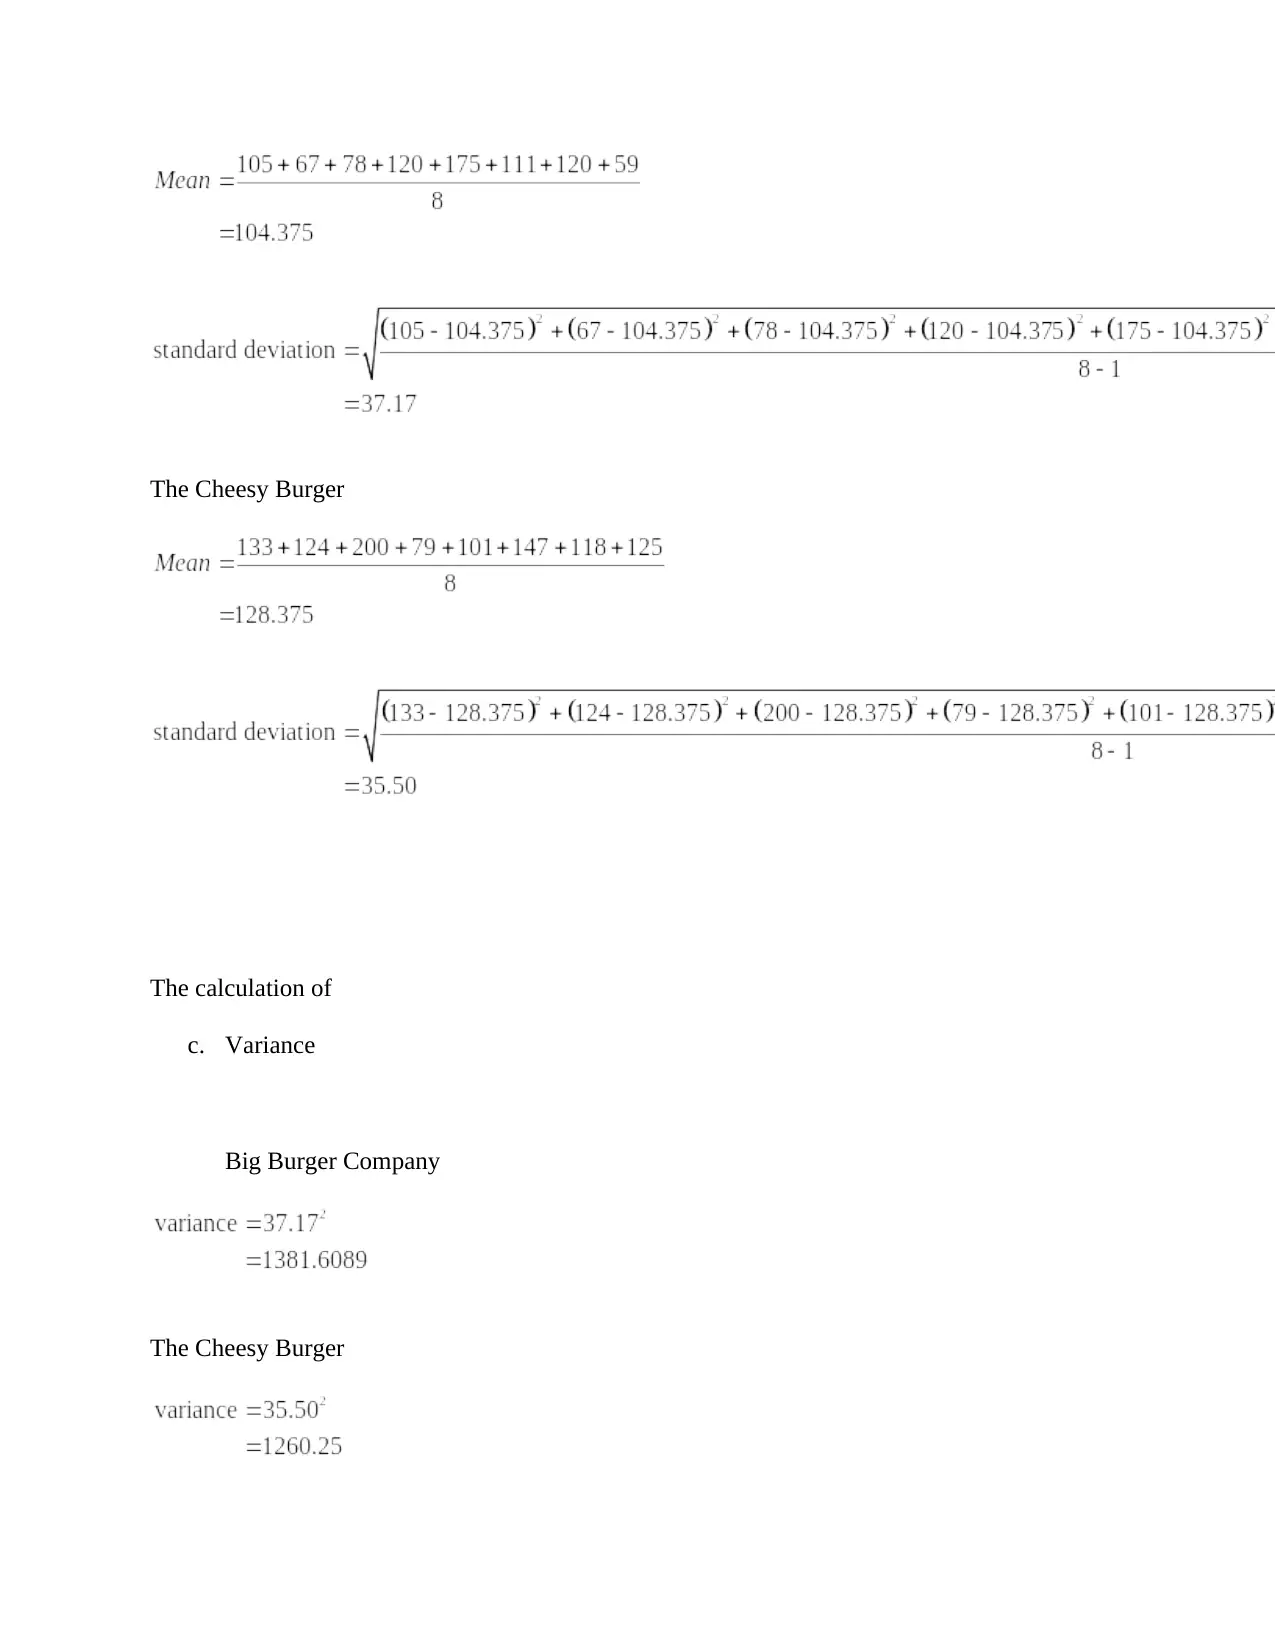
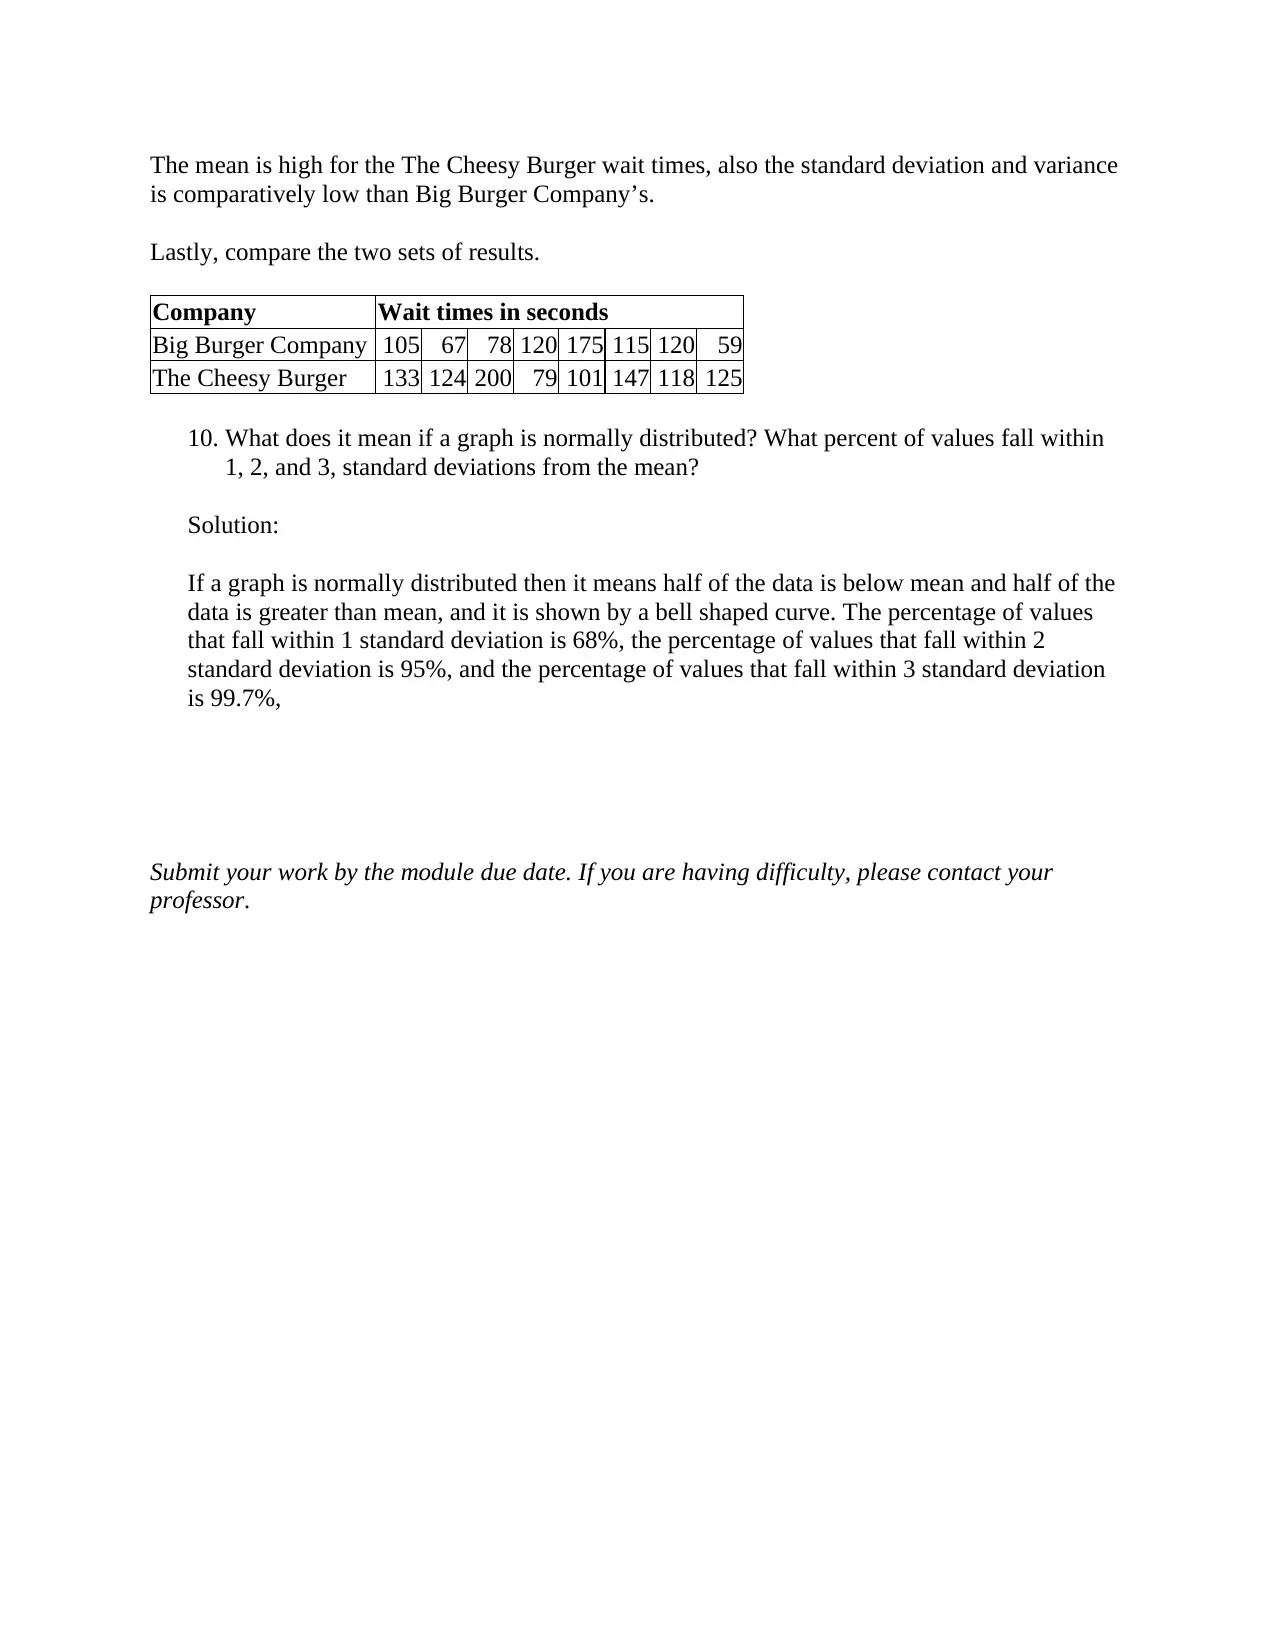
This document presents a comprehensive solution to a statistics case assignment from MATH 200, focusing on frequency distributions and statistical analysis. The solution includes detailed calculations and explanations for various problems, such as determining the number of scores within one and two standard deviations of the mean, calculating z-scores, finding standard deviations and variances for different datasets, creating frequency distribution tables for die rolls, and comparing wait times at two burger companies. The assignment covers key statistical concepts, including mean, standard deviation, variance, and normal distribution, with step-by-step solutions and interpretations of the results. The document offers valuable insights and practical applications of statistical methods, making it a useful resource for students studying statistics.
Document Page
Module 3 - Case
Frequency Distributions
Case Assignment
By submitting this assignment, you affirm that it contains all original work, and that you
are familiar with Trident University’s Academic Integrity policy in the Trident Policy
Handbook. You affirm that you have not engaged in direct duplication, copy/pasting,
sharing assignments, collaboration with others, contract cheating and/or obtaining answers
online, paraphrasing, or submitting/facilitating the submission of prior work. Work found
to be unoriginal and in violation of this policy is subject to consequences such as a failing
grade on the assignment, a failing grade in the course, and/or elevated academic sanctions.
You affirm that the assignment was completed individually, and all work presented is your
own.
Problems need to include all required steps and answer(s) for full credit. All answers need to be
reduced to lowest terms where possible.
Answer the following problems showing your work and explaining (or analyzing) your results.
Submit your work in a typed Microsoft Word document.
1. The final exam scores listed below are from one section of MATH 200. How many
scores were within one standard deviation of the mean? How many scores were within
two standard deviations of the mean?
99 34 86 57 73 85 91 93 46 96 88 79 68 85 89
Solution:
The calculation of mean, standard deviation, mean value minus one standard deviation, mean
plus one standard deviation, mean minus two standard deviation, and mean plus two standard
deviation is as shown below:
Therefore, there are eleven values which were within one standard deviation of the mean and
there were fourteen values which were within two standard deviation of the mean.
tabler-icon-diamond-filled.svg

Paraphrase This Document

Need a fresh take? Get an instant paraphrase of this document with our AI Paraphraser
Document Page
2. The scores for math test #3 were normally distributed. If 15 students had a mean score of
74.8% and a standard deviation of 7.57, how many students scored above an 85%?
Solution:
Consider that student score is represented by X. The calculation of number of students that
scored more than 85% is as follows:
Firstly calculate the Z score:
The corresponding probability is 0.9099. Therefore, the scores more than 85% will have
probability
Hence, the number of students that scored more than 85% is:
Or approximately 1 student will score 85% or more.
3. If you know the standard deviation, how do you find the variance?
Solution: If standard deviation is known then we can find variance by squaring the standard
deviation.
4. To get the best deal on a stereo system, Louis called 8 out of 20 appliance stores in his
neighborhood and asked for the cost of a specific model. The prices he was quoted are
listed below:
$216 $135 $281 $189 $218 $193 $299 $235
Find the standard deviation.
Solution: The calculation of standard deviation in Excel is as shown below:
Document Page
Therefore the standard deviation is 52.26.
5. A company has 70 employees whose salaries are summarized in the frequency
distribution below.
Salary Number of Employees
5,001–10,000 8
10,001–15,000 12
15,001–20,000 20
20,001–25,000 17
25,001–30,000 13
a. Find the standard deviation.
Solution:
The calculation of Standard Deviation in Excel is as shown below:
b. Find the variance.
Solution:
The variance is the square of the standard deviation calculated as shown below:
Document Page
6. Calculate the mean and variance of the sample data set provided below. Show and explain
your steps. Round to the nearest tenth.
14, 16, 7, 9, 11, 13, 8, 10
Solution:
Mean calculation:
Variance Calculation:
7. Create a frequency distribution table for the number of times a number was rolled on a
die. (It may be helpful to print or write out all of the numbers so none are excluded.)
3, 5, 1, 6, 1, 2, 2, 6, 3, 4, 5, 1, 1, 3, 4, 2, 1, 6, 5, 3, 4, 2, 1, 3, 2, 4,
6, 5, 3, 1
Solution:
Number of times a number rolled Frequency
1 7
2 5
3 6
4 4
5 4
6 4
8. Answer the following questions using the frequency distribution table you created in No.
7.
a. Which number(s) had the highest frequency?
tabler-icon-diamond-filled.svg

Paraphrase This Document

Need a fresh take? Get an instant paraphrase of this document with our AI Paraphraser
Document Page
Answer: 1
b. How many times did a number of 4 or greater get thrown?
Answer: 12
c. How many times was an odd number thrown?
Answer: 17
d. How many times did a number greater than or equal to 2 and less than or equal to 5 get
thrown?
Answer: 19
9. The wait times (in seconds) for fast food service at two burger companies were recorded
for quality assurance. Using the data below, find the following for each sample.
a. Range
Solution:
Big Burger Company
The Cheesy Burger
b. Standard deviation
Solution:
Big Burger Company
Document Page
The Cheesy Burger
The calculation of
c. Variance
Big Burger Company
The Cheesy Burger
Document Page
The mean is high for the The Cheesy Burger wait times, also the standard deviation and variance
is comparatively low than Big Burger Company’s.
Lastly, compare the two sets of results.
Company Wait times in seconds
Big Burger Company 105 67 78 120 175 115 120 59
The Cheesy Burger 133 124 200 79 101 147 118 125
10. What does it mean if a graph is normally distributed? What percent of values fall within
1, 2, and 3, standard deviations from the mean?
Solution:
If a graph is normally distributed then it means half of the data is below mean and half of the
data is greater than mean, and it is shown by a bell shaped curve. The percentage of values
that fall within 1 standard deviation is 68%, the percentage of values that fall within 2
standard deviation is 95%, and the percentage of values that fall within 3 standard deviation
is 99.7%,
Submit your work by the module due date. If you are having difficulty, please contact your
professor.
chevron_up_icon
1 out of 7
circle_padding
hide_on_mobile
zoom_out_icon
[object Object]