Statistics Homework: Confidence Intervals, Risk Ratios, and T-Tests
VerifiedAdded on 2023/04/22
|13
|2220
|354
Homework Assignment
AI Summary
This document provides detailed solutions to a statistics homework assignment. It includes calculations and interpretations of 95% confidence intervals for mean cholesterol levels, differences in systolic blood pressure, and proportions of patients with hypertension. Furthermore, it addresses risk ratios (RR) and odds ratios (OR) related to side effects and pain relief, along with their respective confidence intervals. The solution uses t-tests and central limit theorem applications to validate statistical inferences. Additionally, the homework covers confidence intervals for mean age and body mass index differences between experimental and placebo groups, concluding with an analysis of the number of days with an AF event using new and available pacemakers, showcasing comprehensive statistical analysis techniques.

HOMEWORK # 2
1
1
Paraphrase This Document
Need a fresh take? Get an instant paraphrase of this document with our AI Paraphraser
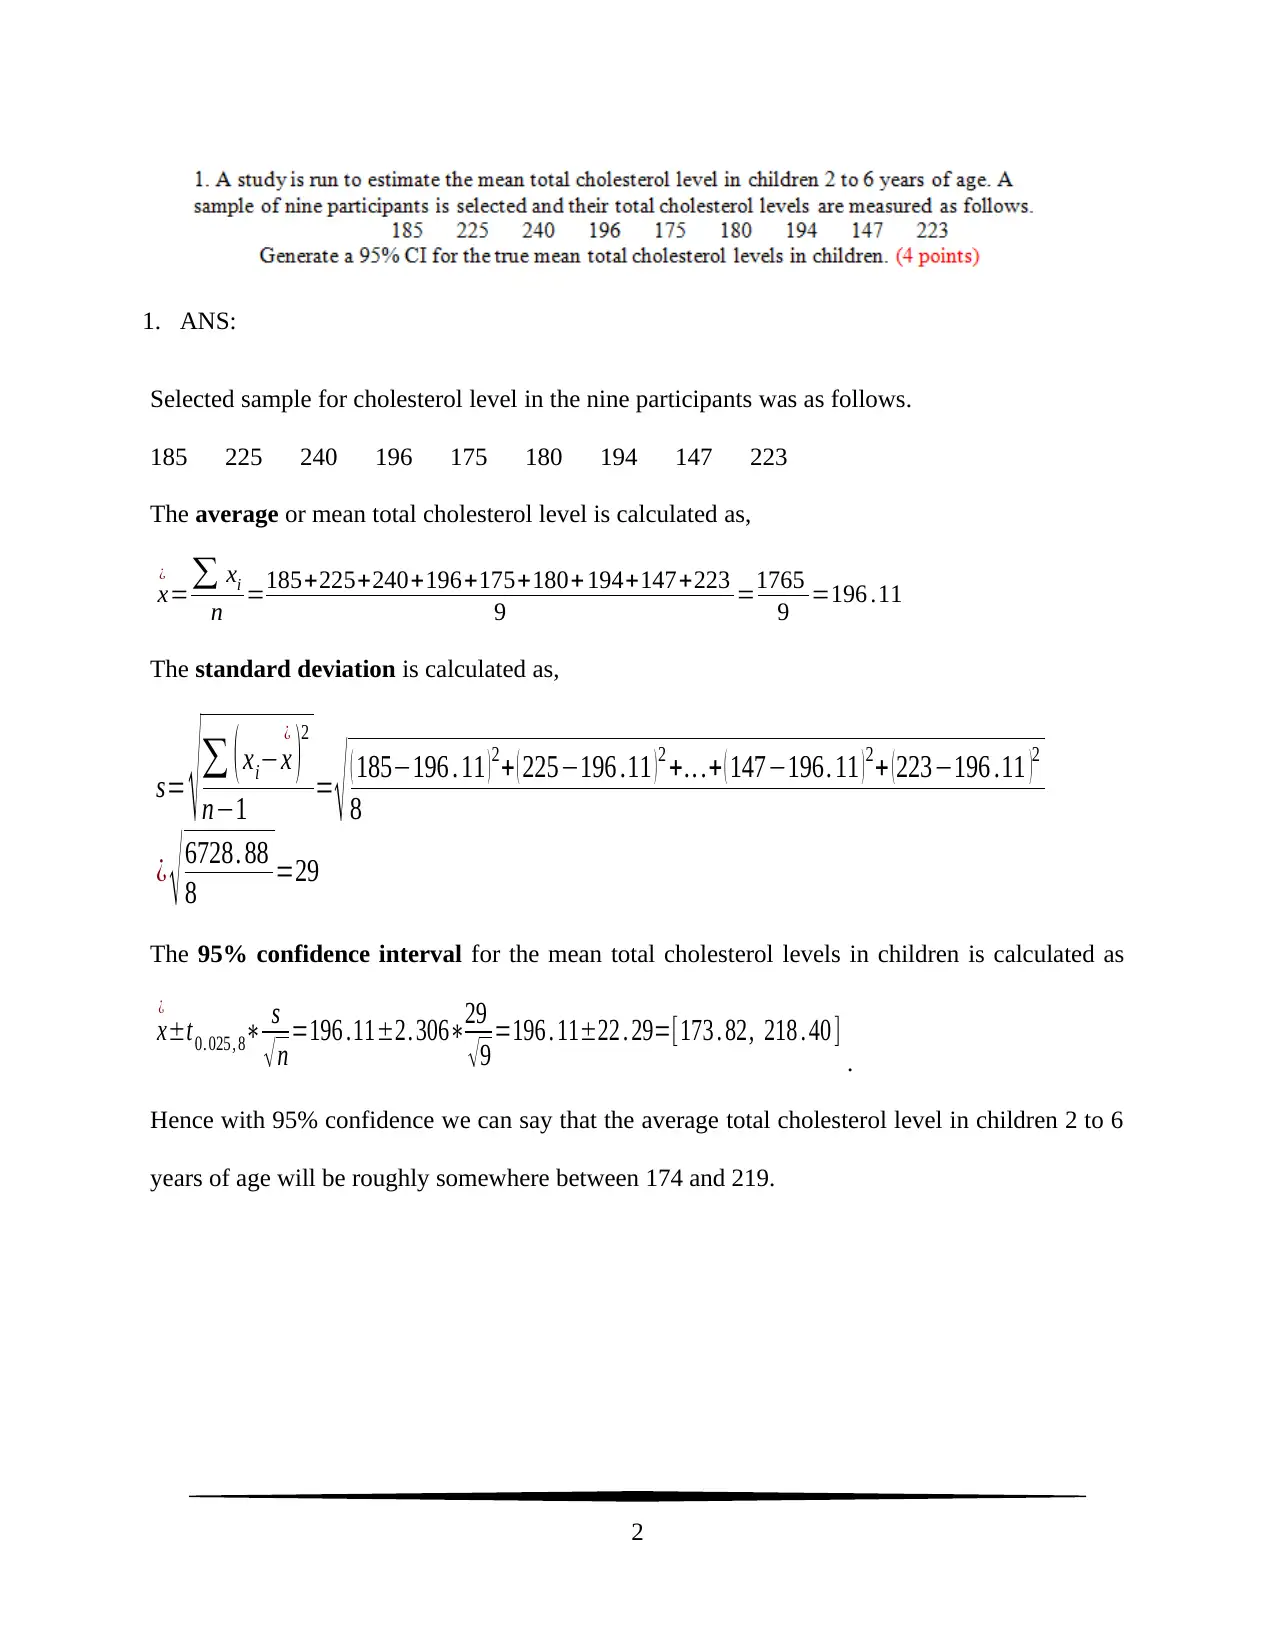
1. ANS:
Selected sample for cholesterol level in the nine participants was as follows.
185 225 240 196 175 180 194 147 223
The average or mean total cholesterol level is calculated as,
x
¿
=∑ xi
n =185+225+240+196+175+180+ 194+147+223
9 =1765
9 =196 .11
The standard deviation is calculated as,
s= √ ∑ ( xi−x
¿
)
2
n−1 = √ ( 185−196 . 11 ) 2+ ( 225−196 .11 ) 2 +.. .+ ( 147−196. 11 ) 2+ ( 223−196 .11 )2
8
¿ √ 6728. 88
8 =29
The 95% confidence interval for the mean total cholesterol levels in children is calculated as
x
¿
±t0. 025 , 8∗ s
√ n =196 .11±2. 306∗29
√ 9 =196 . 11±22 . 29=[173 . 82, 218 . 40 ]
.
Hence with 95% confidence we can say that the average total cholesterol level in children 2 to 6
years of age will be roughly somewhere between 174 and 219.
2
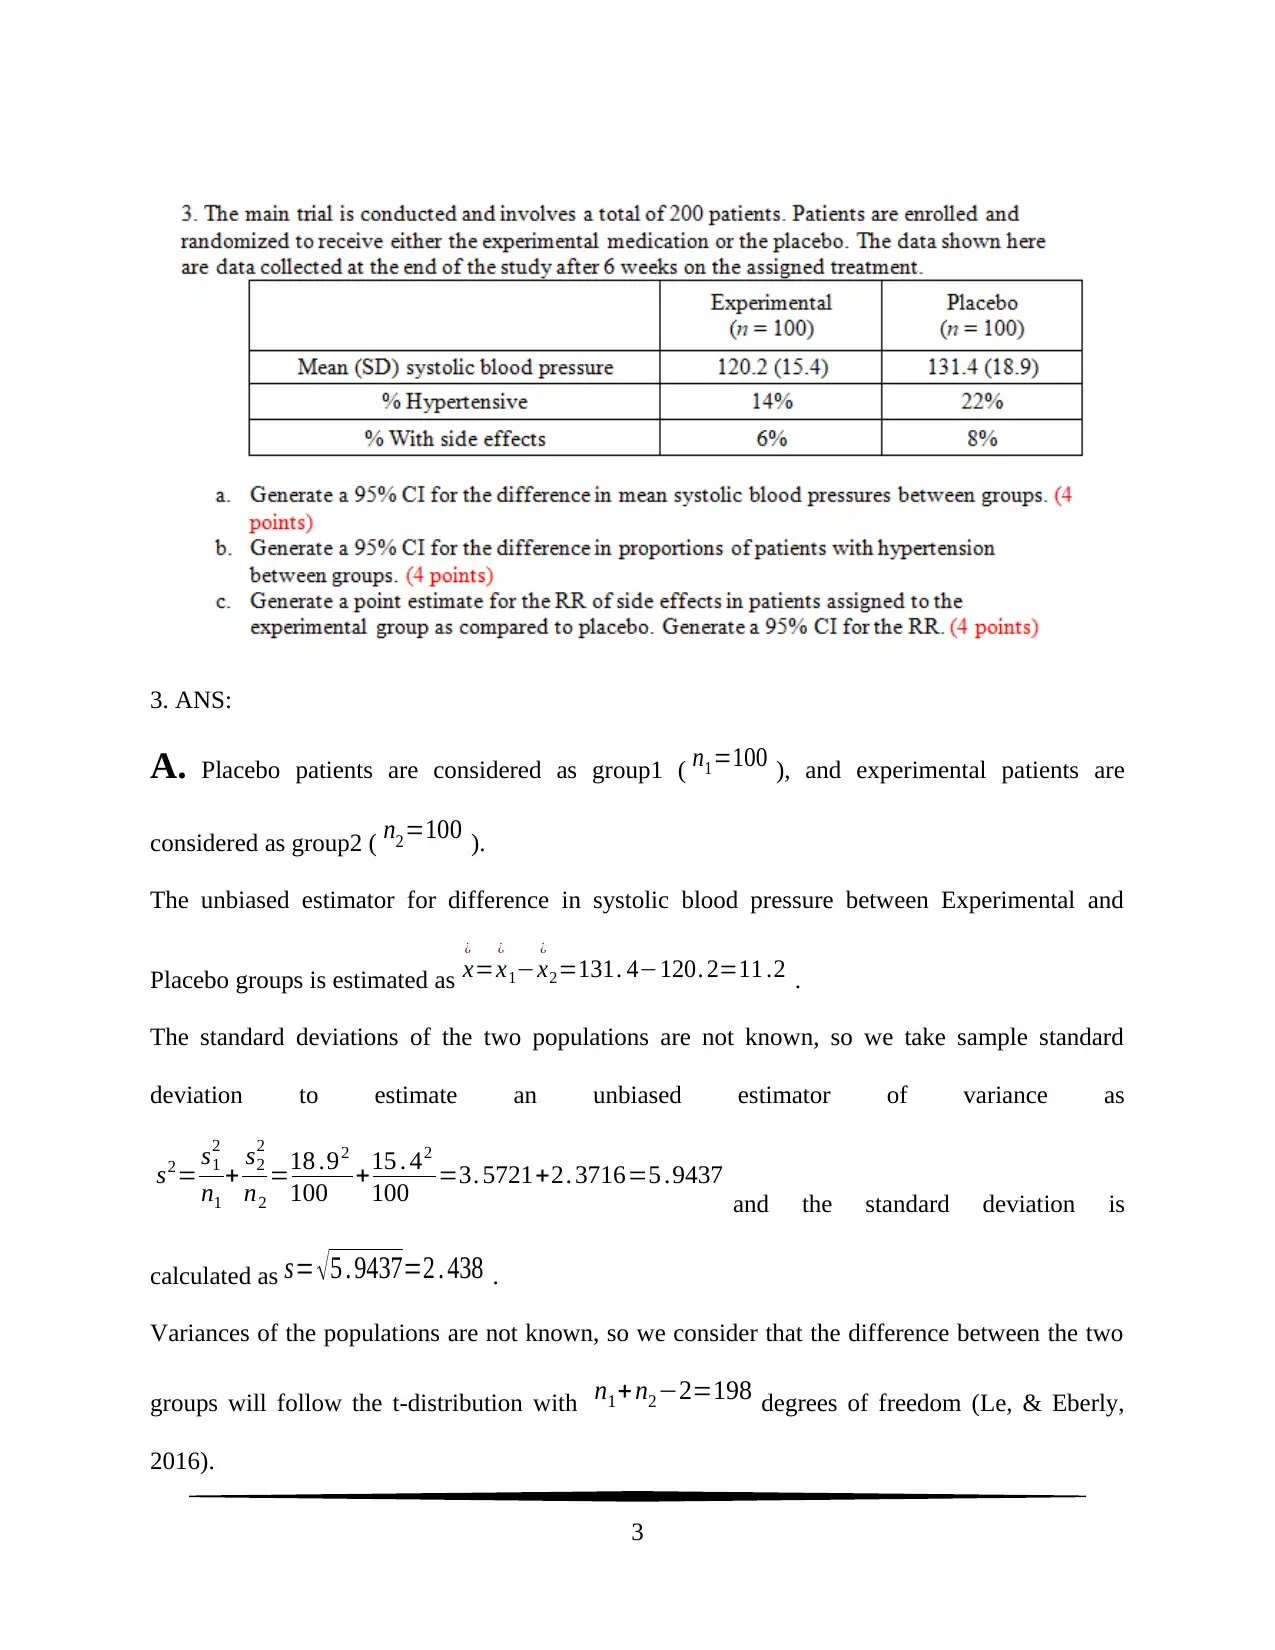
3. ANS:
A. Placebo patients are considered as group1 ( n1=100 ), and experimental patients are
considered as group2 ( n2=100 ).
The unbiased estimator for difference in systolic blood pressure between Experimental and
Placebo groups is estimated as x
¿
=x
¿
1−x
¿
2=131. 4−120. 2=11 .2 .
The standard deviations of the two populations are not known, so we take sample standard
deviation to estimate an unbiased estimator of variance as
s2= s1
2
n1
+ s2
2
n2
=18 .92
100 +15 . 42
100 =3. 5721+2. 3716=5 .9437
and the standard deviation is
calculated as s= √ 5 . 9437=2 . 438 .
Variances of the populations are not known, so we consider that the difference between the two
groups will follow the t-distribution with n1+ n2−2=198 degrees of freedom (Le, & Eberly,
2016).
3
⊘ This is a preview!⊘
Do you want full access?
Subscribe today to unlock all pages.
Trusted by 1+ million students worldwide
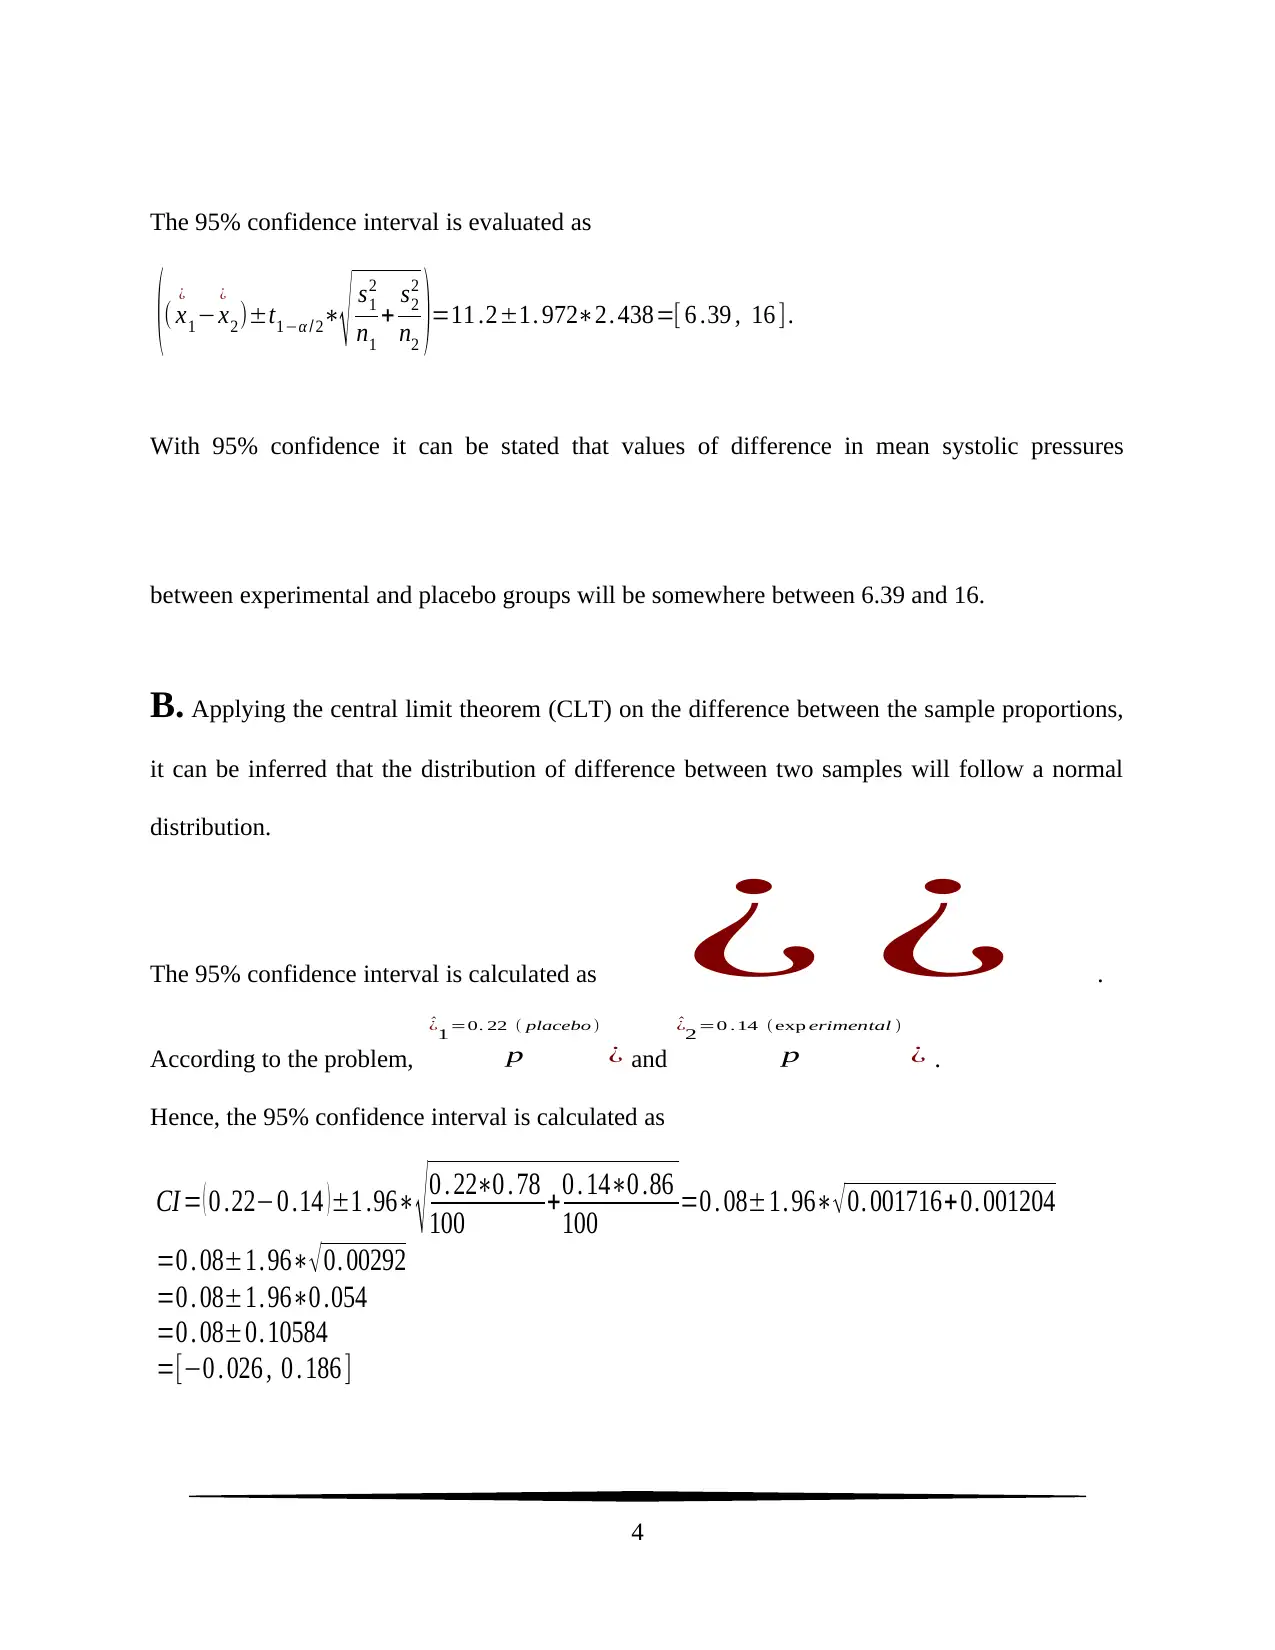
The 95% confidence interval is evaluated as
(( x
¿
1−x
¿
2)±t1−α / 2∗
√ s1
2
n1
+ s2
2
n2 )=11 .2±1. 972∗2. 438=[ 6 .39 , 16 ].
With 95% confidence it can be stated that values of difference in mean systolic pressures
between experimental and placebo groups will be somewhere between 6.39 and 16.
B. Applying the central limit theorem (CLT) on the difference between the sample proportions,
it can be inferred that the distribution of difference between two samples will follow a normal
distribution.
The 95% confidence interval is calculated as ¿ ¿ .
According to the problem, p
^¿1=0. 22 ( placebo)
¿ and p
^¿2=0 .14 (exp erimental )
¿ .
Hence, the 95% confidence interval is calculated as
CI = ( 0 .22−0 .14 ) ±1 .96∗ √ 0 . 22∗0 . 78
100 +0 . 14∗0 .86
100 =0 . 08±1. 96∗√ 0. 001716+0. 001204
=0 . 08±1. 96∗√ 0. 00292
=0 . 08±1. 96∗0 .054
=0 . 08±0. 10584
=[−0 . 026 , 0 . 186 ]
4
Paraphrase This Document
Need a fresh take? Get an instant paraphrase of this document with our AI Paraphraser
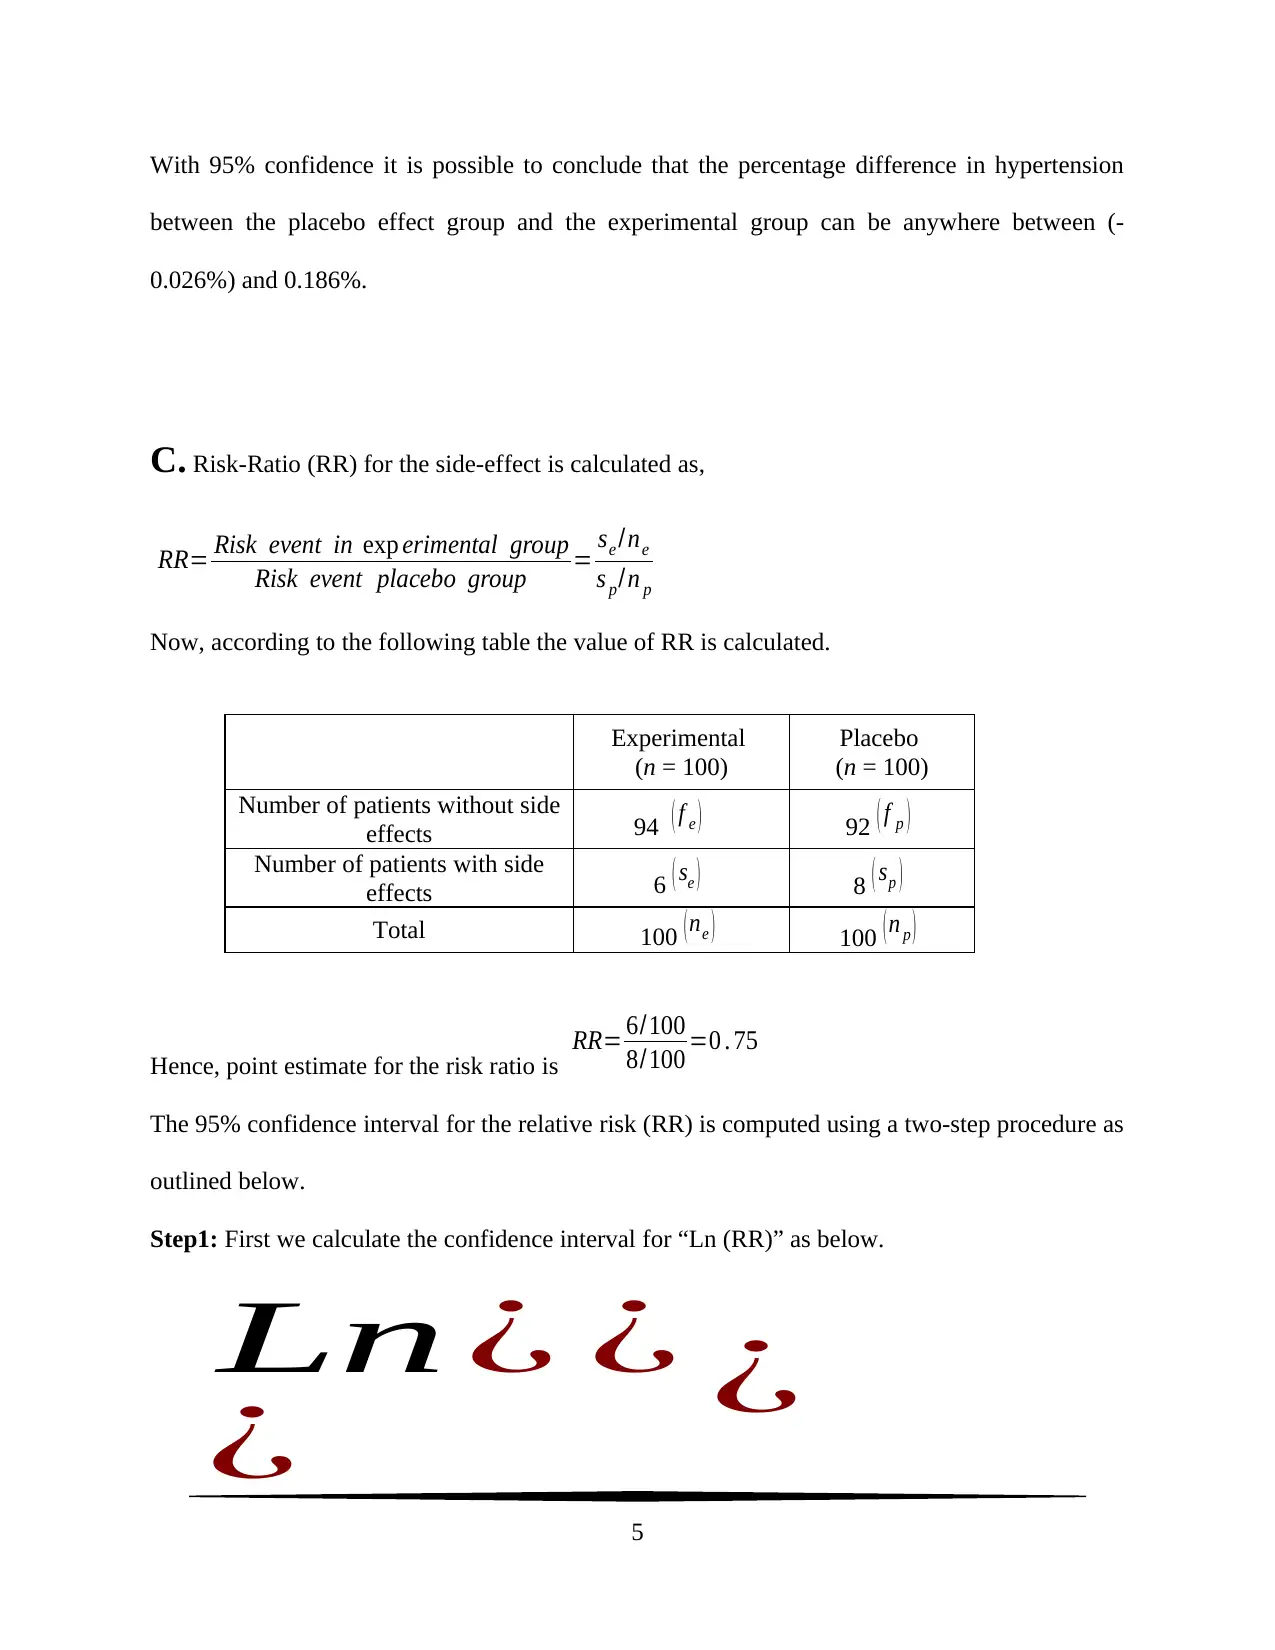
With 95% confidence it is possible to conclude that the percentage difference in hypertension
between the placebo effect group and the experimental group can be anywhere between (-
0.026%) and 0.186%.
C. Risk-Ratio (RR) for the side-effect is calculated as,
RR= Risk event in exp erimental group
Risk event placebo group = se /ne
s p/n p
Now, according to the following table the value of RR is calculated.
Experimental
(n = 100)
Placebo
(n = 100)
Number of patients without side
effects 94 ( f e ) 92 ( f p )
Number of patients with side
effects 6 ( se ) 8 ( sp )
Total 100 ( ne ) 100 ( n p )
Hence, point estimate for the risk ratio is
RR= 6/100
8/100 =0 . 75
The 95% confidence interval for the relative risk (RR) is computed using a two-step procedure as
outlined below.
Step1: First we calculate the confidence interval for “Ln (RR)” as below.
Ln¿ ¿
¿ ¿
5
Step 2: Hence, a 95% confidence interval estimate for RR is obtained by taking antilog for both
the limits of the above confidence limits.
exp(−1 .31 )=0 .27 , exp( 0. 734 )=2 . 08
Therefore, the 95% confidence interval estimate for RR is [0.27, 2.08].
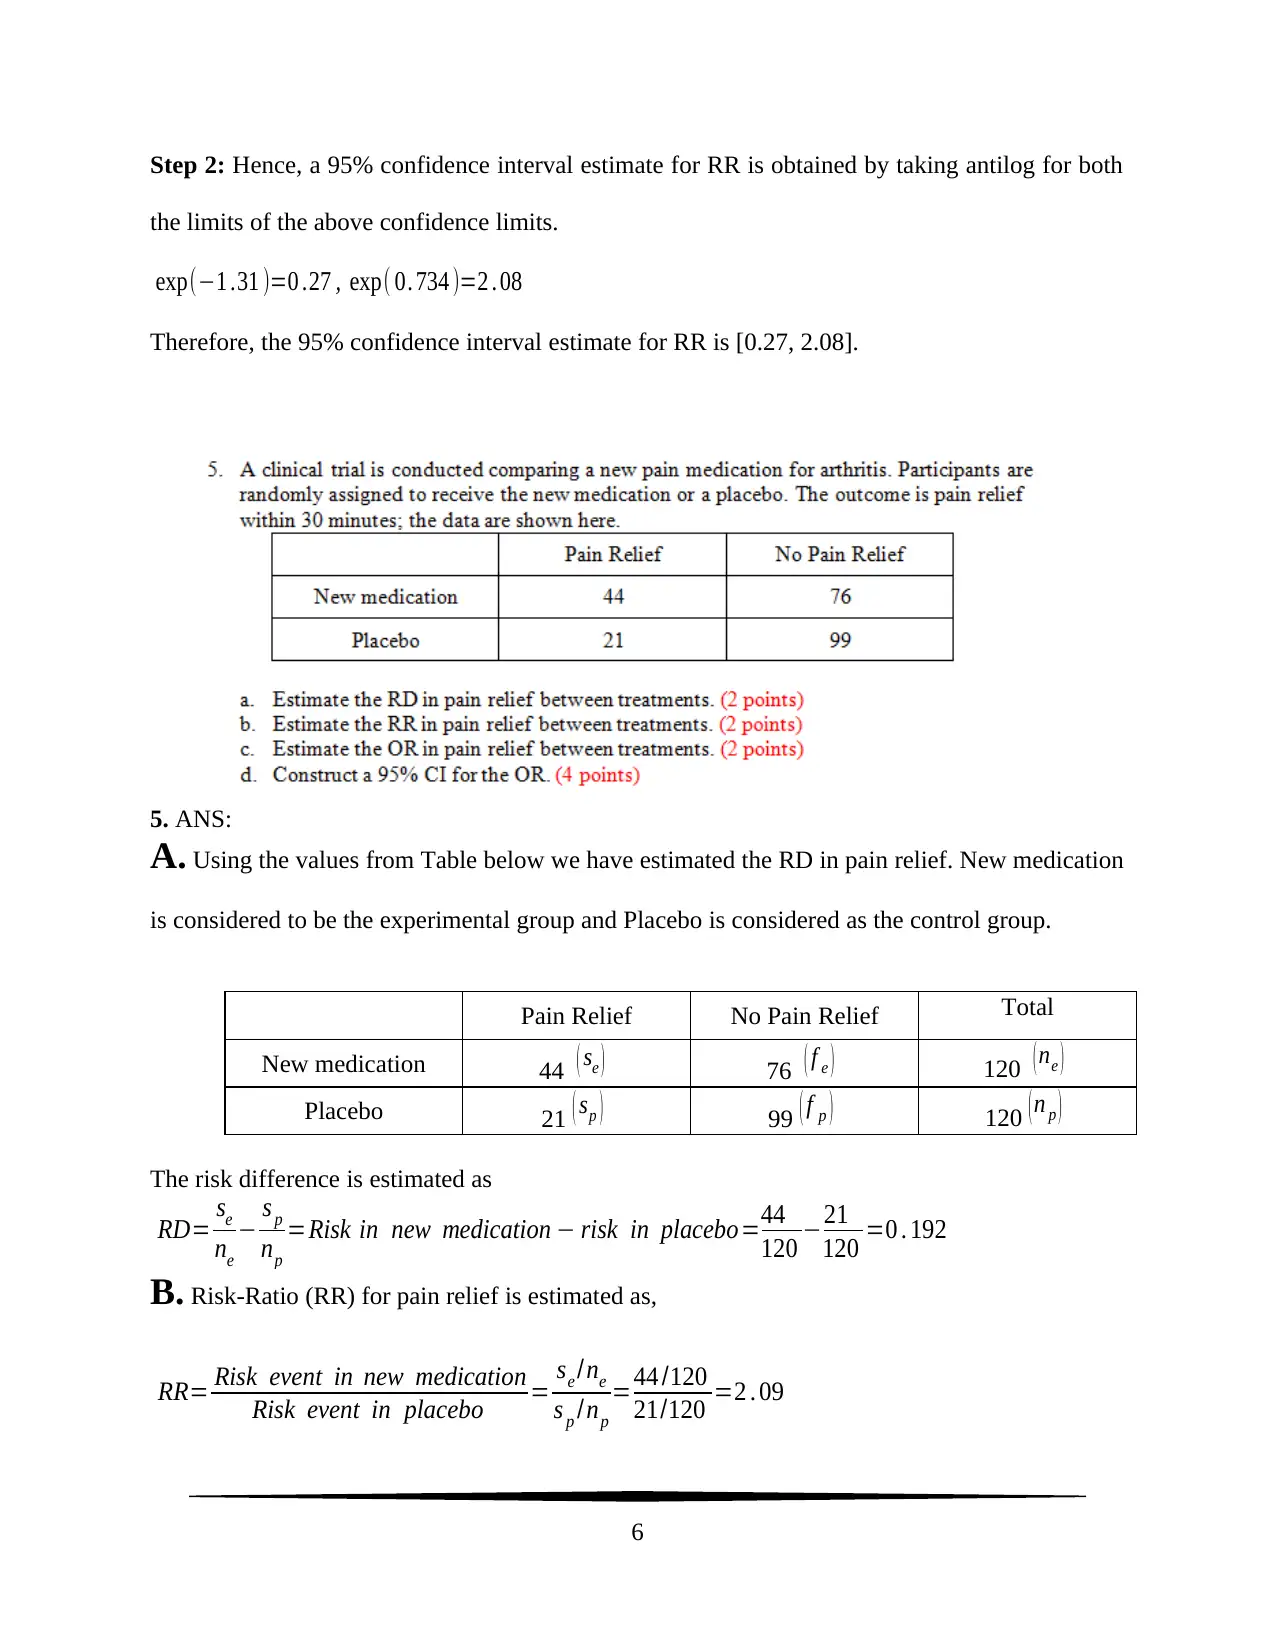
5. ANS:
A. Using the values from Table below we have estimated the RD in pain relief. New medication
is considered to be the experimental group and Placebo is considered as the control group.
Pain Relief No Pain Relief Total
New medication 44 ( se ) 76 ( f e ) 120 ( ne )
Placebo 21 ( sp ) 99 ( f p ) 120 ( n p )
The risk difference is estimated as
RD= se
ne
− s p
np
=Risk in new medication − risk in placebo=44
120 −21
120 =0 . 192
B. Risk-Ratio (RR) for pain relief is estimated as,
RR= Risk event in new medication
Risk event in placebo = se /ne
s p /np
=44 /120
21/120 =2 . 09
6
the limits of the above confidence limits.
exp(−1 .31 )=0 .27 , exp( 0. 734 )=2 . 08
Therefore, the 95% confidence interval estimate for RR is [0.27, 2.08].
5. ANS:
A. Using the values from Table below we have estimated the RD in pain relief. New medication
is considered to be the experimental group and Placebo is considered as the control group.
Pain Relief No Pain Relief Total
New medication 44 ( se ) 76 ( f e ) 120 ( ne )
Placebo 21 ( sp ) 99 ( f p ) 120 ( n p )
The risk difference is estimated as
RD= se
ne
− s p
np
=Risk in new medication − risk in placebo=44
120 −21
120 =0 . 192
B. Risk-Ratio (RR) for pain relief is estimated as,
RR= Risk event in new medication
Risk event in placebo = se /ne
s p /np
=44 /120
21/120 =2 . 09
6
⊘ This is a preview!⊘
Do you want full access?
Subscribe today to unlock all pages.
Trusted by 1+ million students worldwide
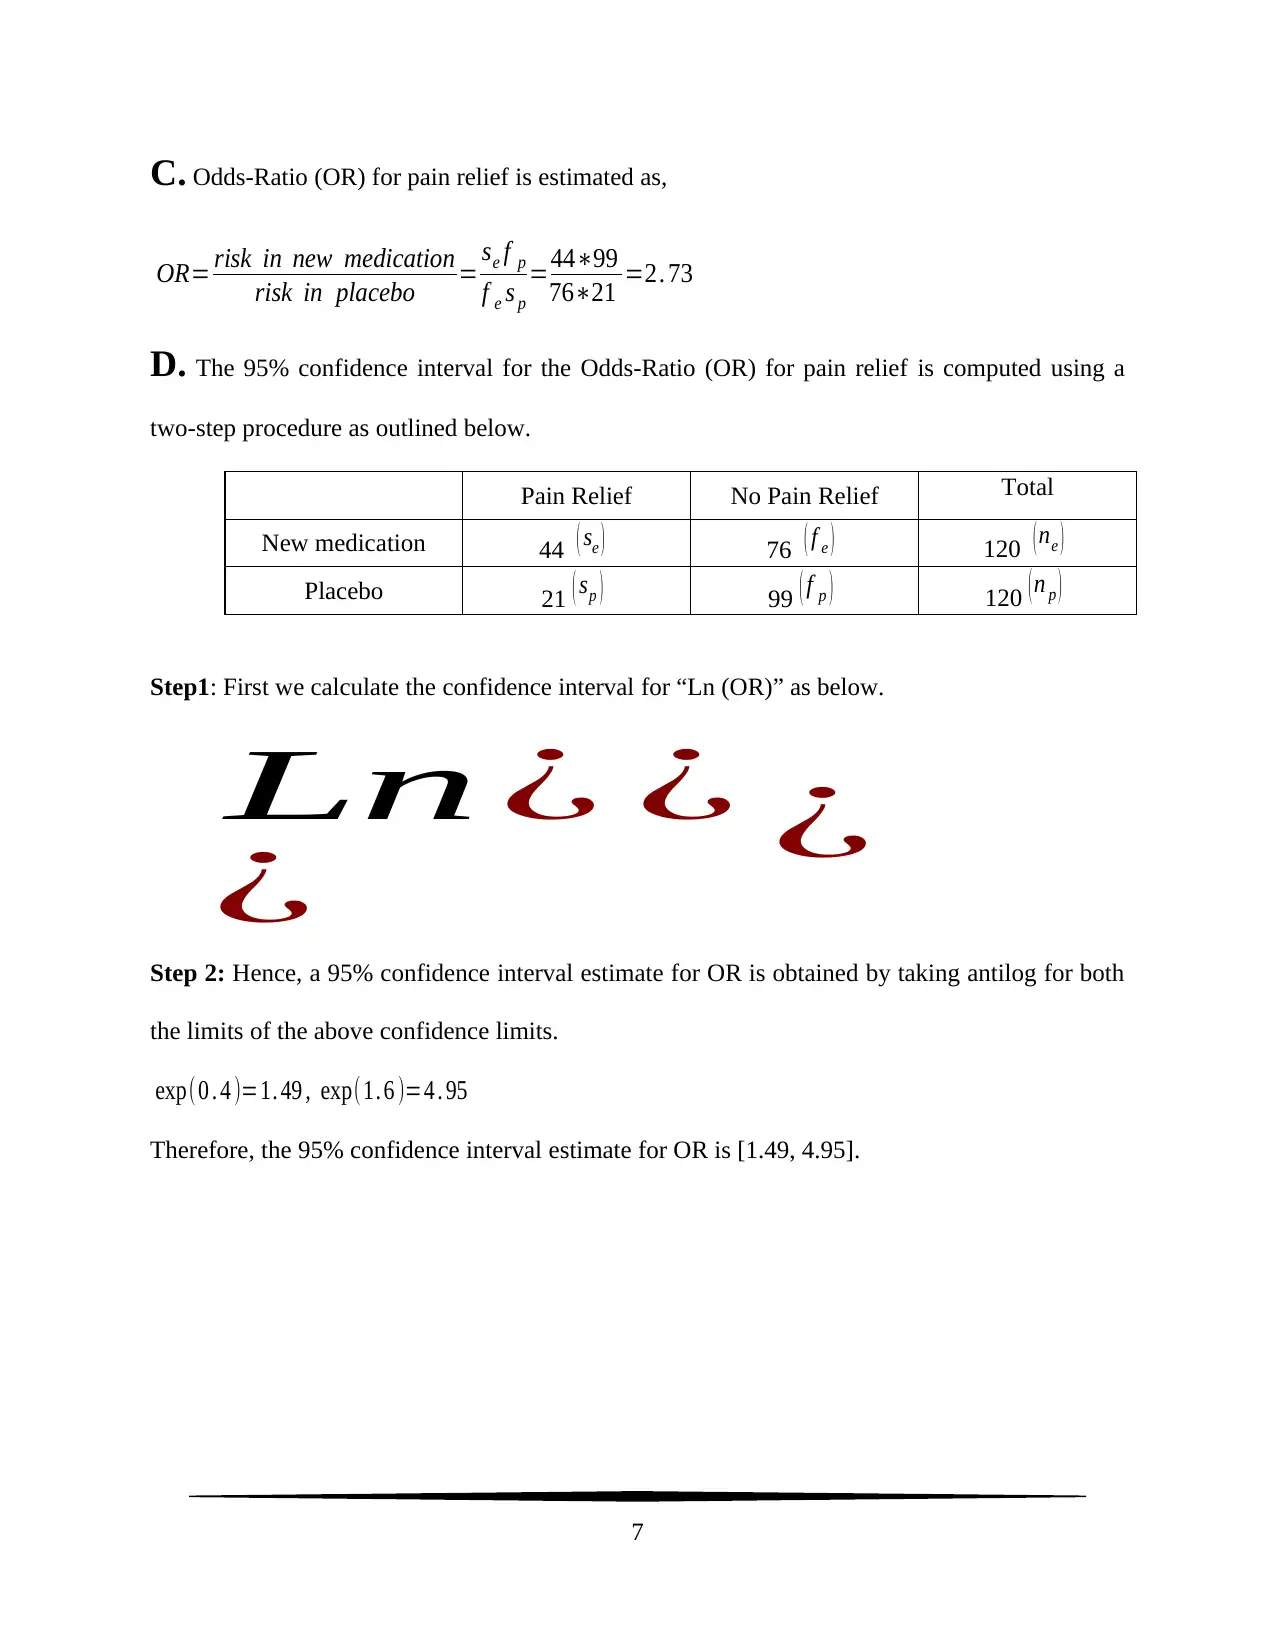
C. Odds-Ratio (OR) for pain relief is estimated as,
OR= risk in new medication
risk in placebo = se f p
f e s p
=44∗99
76∗21 =2. 73
D. The 95% confidence interval for the Odds-Ratio (OR) for pain relief is computed using a
two-step procedure as outlined below.
Pain Relief No Pain Relief Total
New medication 44 ( se ) 76 ( f e ) 120 ( ne )
Placebo 21 ( sp ) 99 ( f p ) 120 ( n p )
Step1: First we calculate the confidence interval for “Ln (OR)” as below.
Ln¿ ¿
¿ ¿
Step 2: Hence, a 95% confidence interval estimate for OR is obtained by taking antilog for both
the limits of the above confidence limits.
exp(0 . 4 )=1. 49 , exp(1. 6 )=4 . 95
Therefore, the 95% confidence interval estimate for OR is [1.49, 4.95].
7
Paraphrase This Document
Need a fresh take? Get an instant paraphrase of this document with our AI Paraphraser
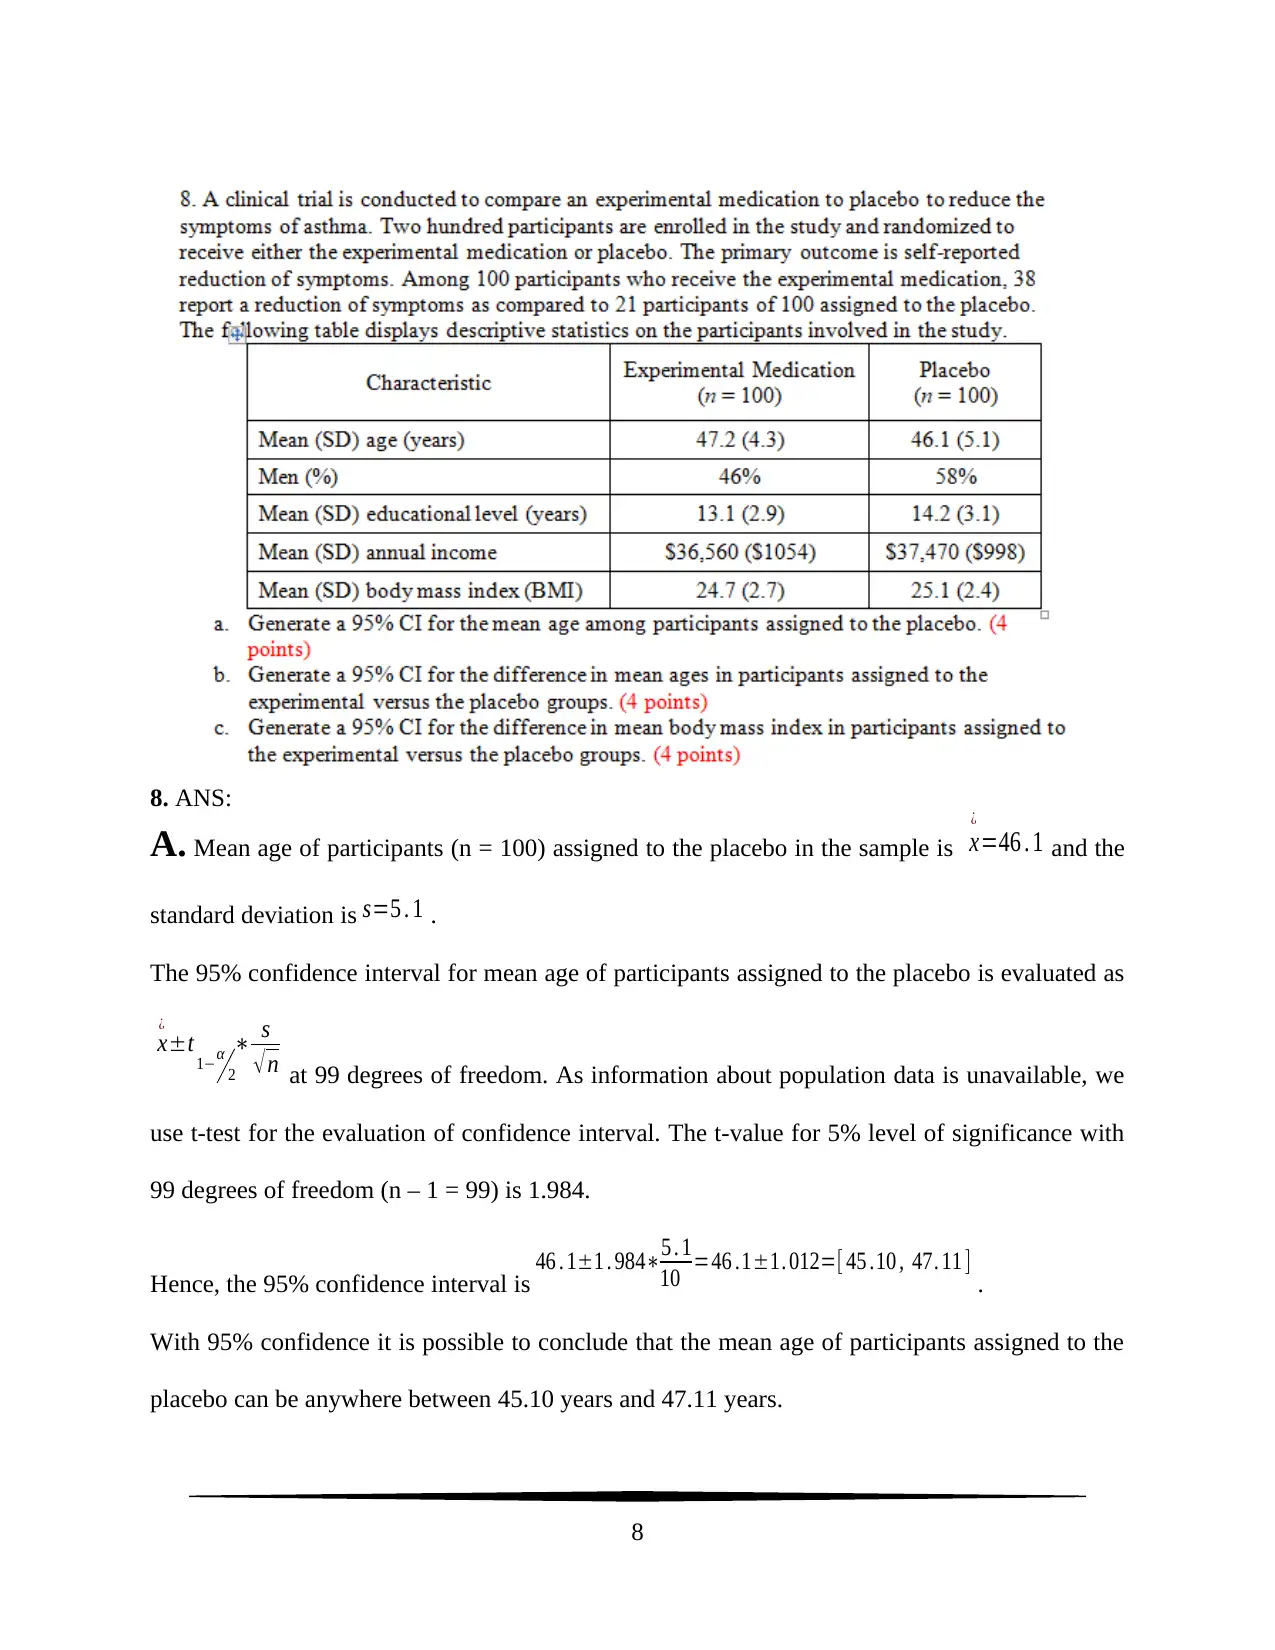
8. ANS:
A. Mean age of participants (n = 100) assigned to the placebo in the sample is x
¿
=46 . 1 and the
standard deviation is s=5 . 1 .
The 95% confidence interval for mean age of participants assigned to the placebo is evaluated as
x
¿
±t 1−α
2
∗ s
√ n at 99 degrees of freedom. As information about population data is unavailable, we
use t-test for the evaluation of confidence interval. The t-value for 5% level of significance with
99 degrees of freedom (n – 1 = 99) is 1.984.
Hence, the 95% confidence interval is 46 . 1±1 . 984∗5 . 1
10 =46 .1±1. 012=[ 45 .10 , 47. 11 ] .
With 95% confidence it is possible to conclude that the mean age of participants assigned to the
placebo can be anywhere between 45.10 years and 47.11 years.
8
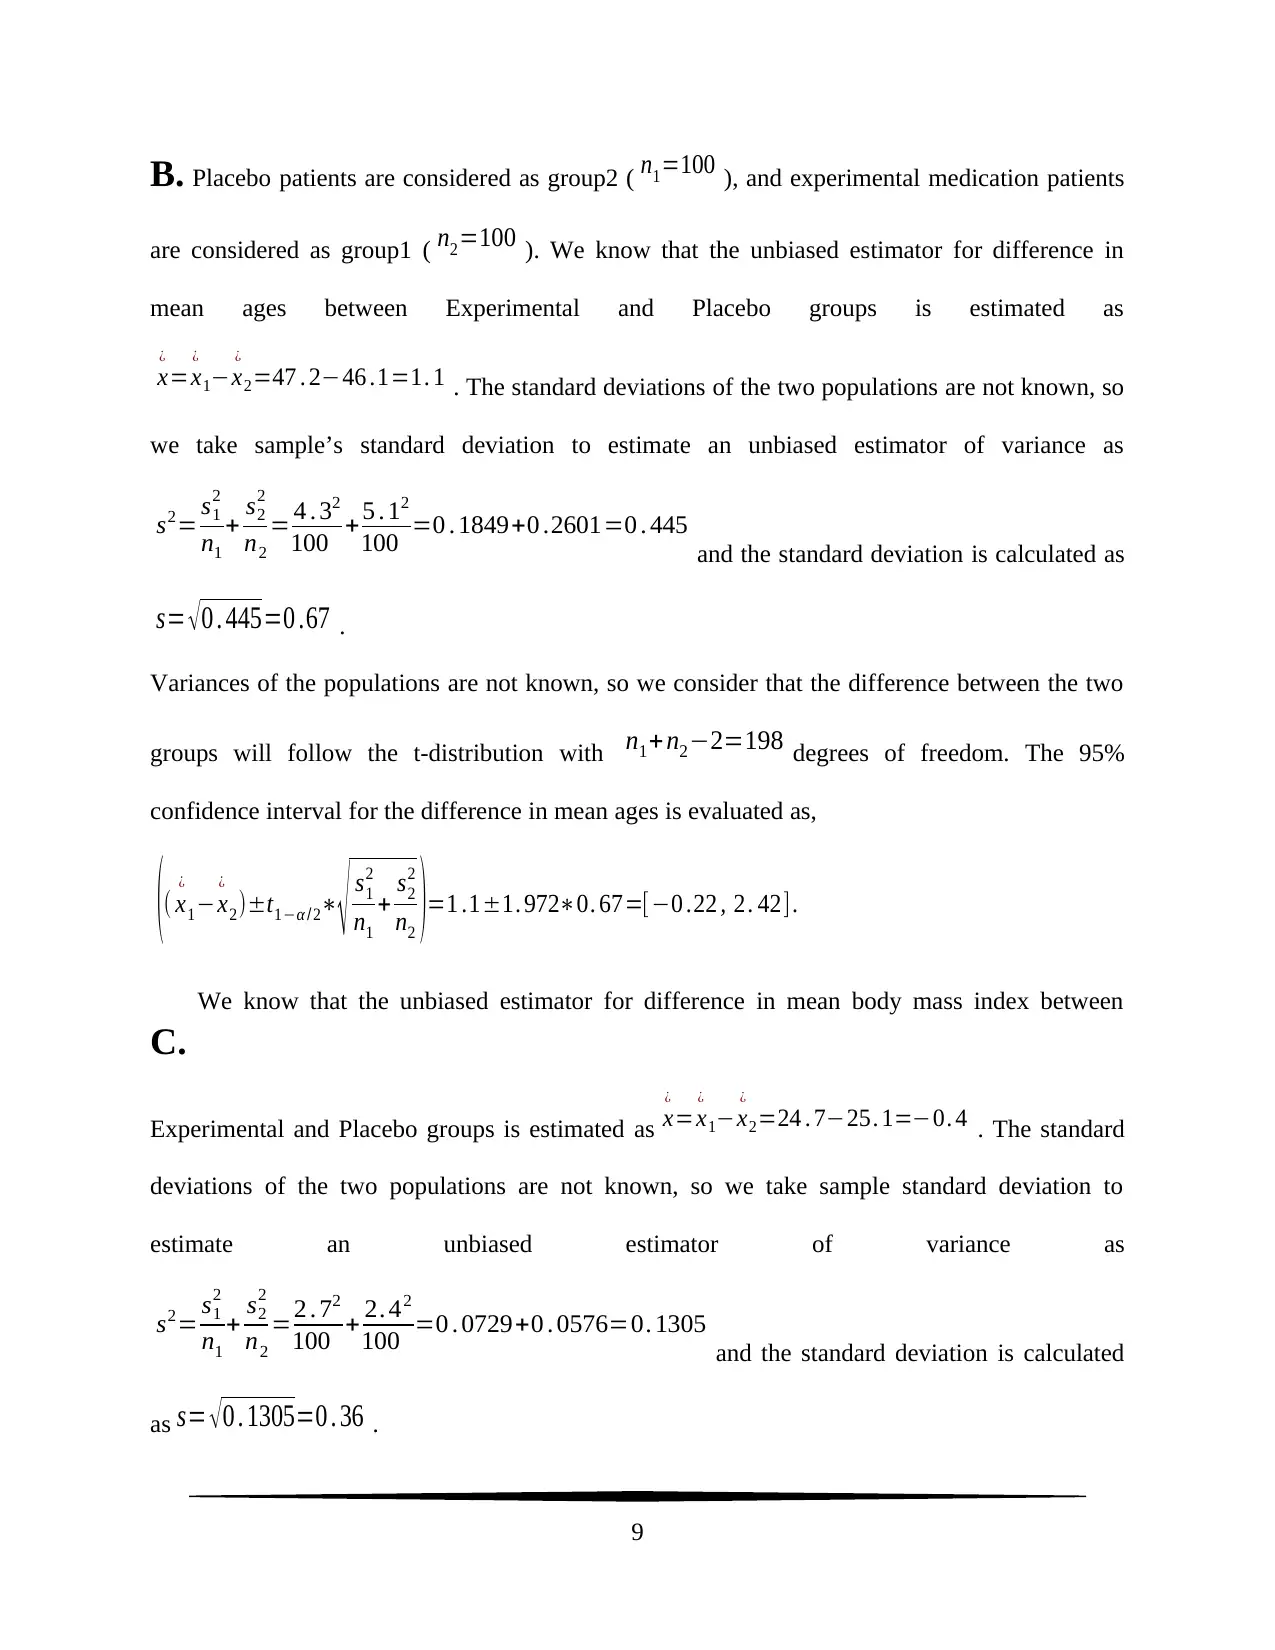
B. Placebo patients are considered as group2 ( n1=100 ), and experimental medication patients
are considered as group1 ( n2=100 ). We know that the unbiased estimator for difference in
mean ages between Experimental and Placebo groups is estimated as
x
¿
=x
¿
1−x
¿
2=47 . 2−46 .1=1. 1 . The standard deviations of the two populations are not known, so
we take sample’s standard deviation to estimate an unbiased estimator of variance as
s2= s1
2
n1
+ s2
2
n2
= 4 . 32
100 + 5 . 12
100 =0 . 1849+0 .2601=0 . 445
and the standard deviation is calculated as
s= √ 0 . 445=0 .67 .
Variances of the populations are not known, so we consider that the difference between the two
groups will follow the t-distribution with n1+ n2−2=198 degrees of freedom. The 95%
confidence interval for the difference in mean ages is evaluated as,
(( x
¿
1−x
¿
2)±t1−α / 2∗
√ s1
2
n1
+ s2
2
n2 )=1 .1±1. 972∗0. 67=[−0 .22 , 2. 42].
C.
We know that the unbiased estimator for difference in mean body mass index between
Experimental and Placebo groups is estimated as x
¿
=x
¿
1−x
¿
2=24 . 7−25. 1=−0. 4 . The standard
deviations of the two populations are not known, so we take sample standard deviation to
estimate an unbiased estimator of variance as
s2= s1
2
n1
+ s2
2
n2
=2 . 72
100 + 2. 42
100 =0 . 0729+0 . 0576=0. 1305
and the standard deviation is calculated
as s= √ 0 . 1305=0 . 36 .
9
⊘ This is a preview!⊘
Do you want full access?
Subscribe today to unlock all pages.
Trusted by 1+ million students worldwide
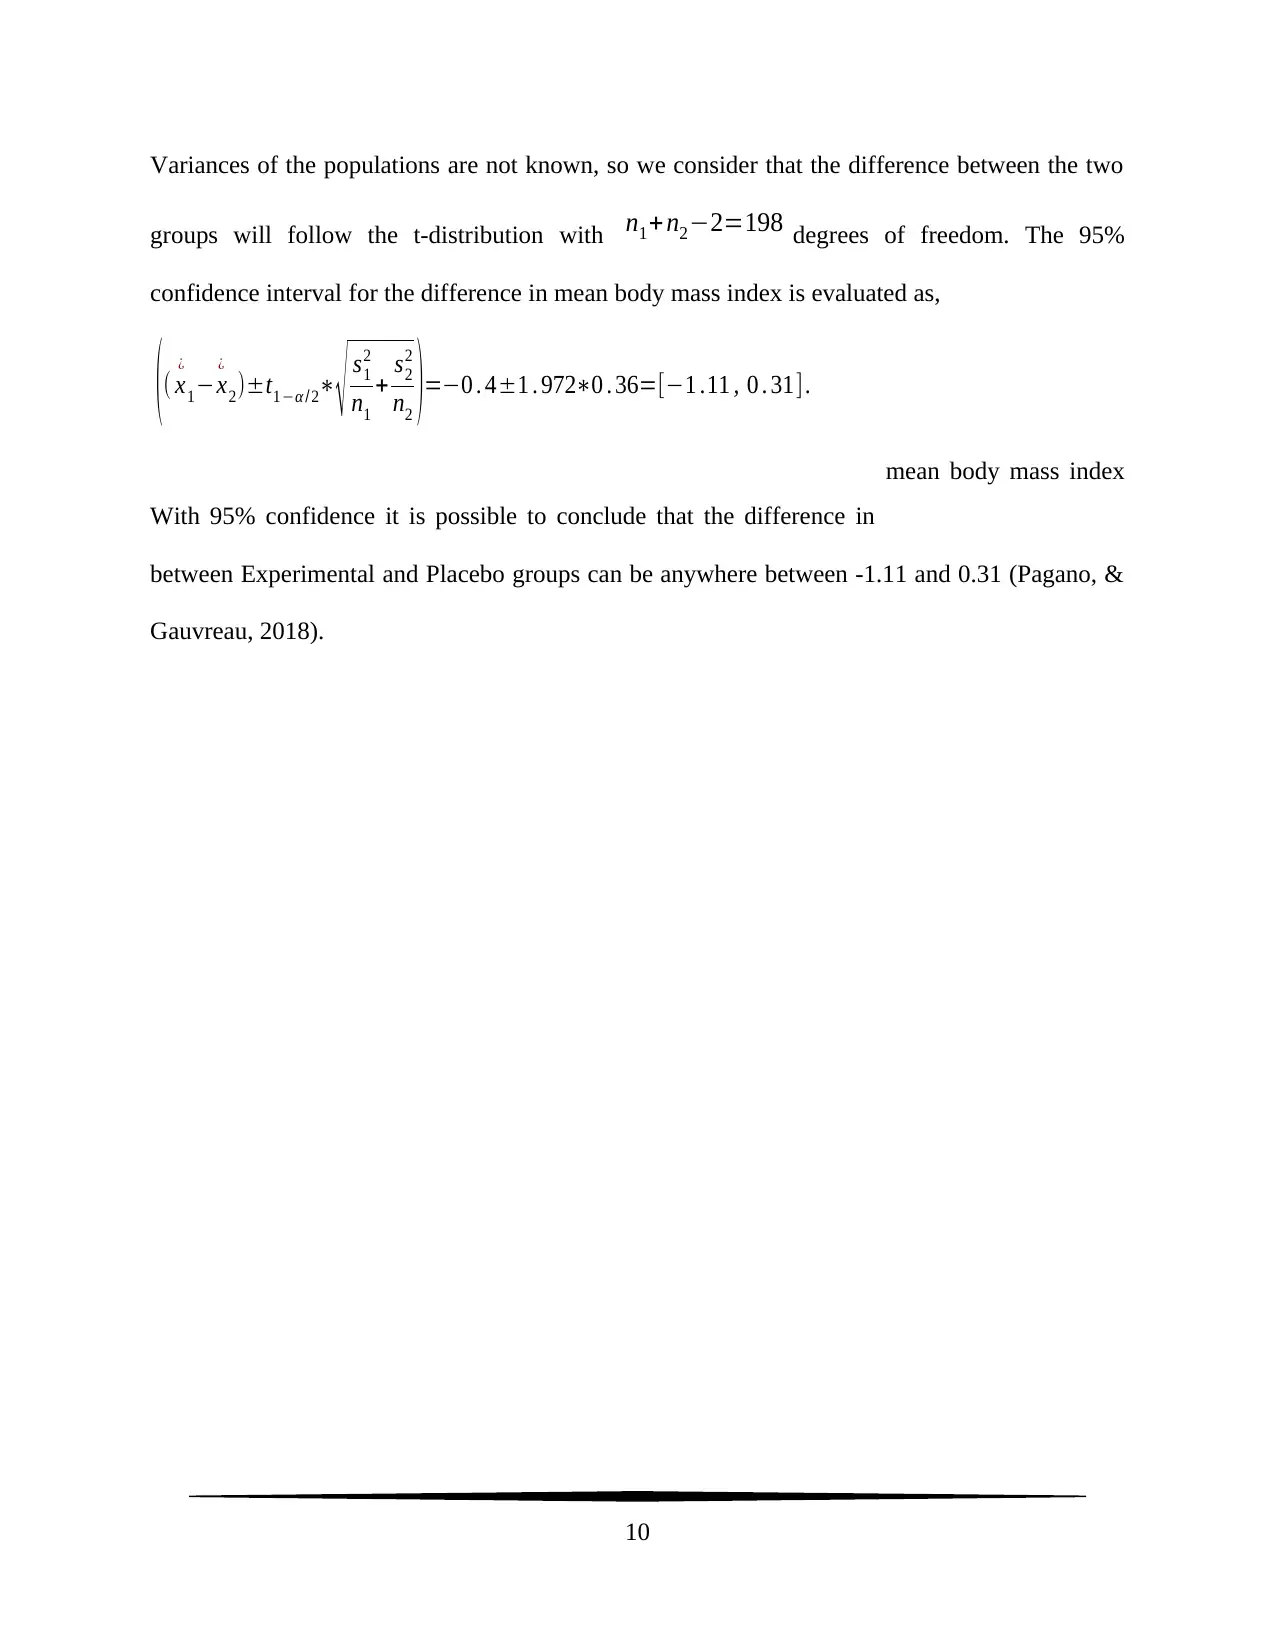
Variances of the populations are not known, so we consider that the difference between the two
groups will follow the t-distribution with n1+ n2−2=198 degrees of freedom. The 95%
confidence interval for the difference in mean body mass index is evaluated as,
(( x
¿
1−x
¿
2)±t1−α / 2∗
√ s1
2
n1
+ s2
2
n2 )=−0 . 4±1 . 972∗0 . 36=[−1 .11 , 0 . 31].
With 95% confidence it is possible to conclude that the difference in
mean body mass index
between Experimental and Placebo groups can be anywhere between -1.11 and 0.31 (Pagano, &
Gauvreau, 2018).
10
Paraphrase This Document
Need a fresh take? Get an instant paraphrase of this document with our AI Paraphraser
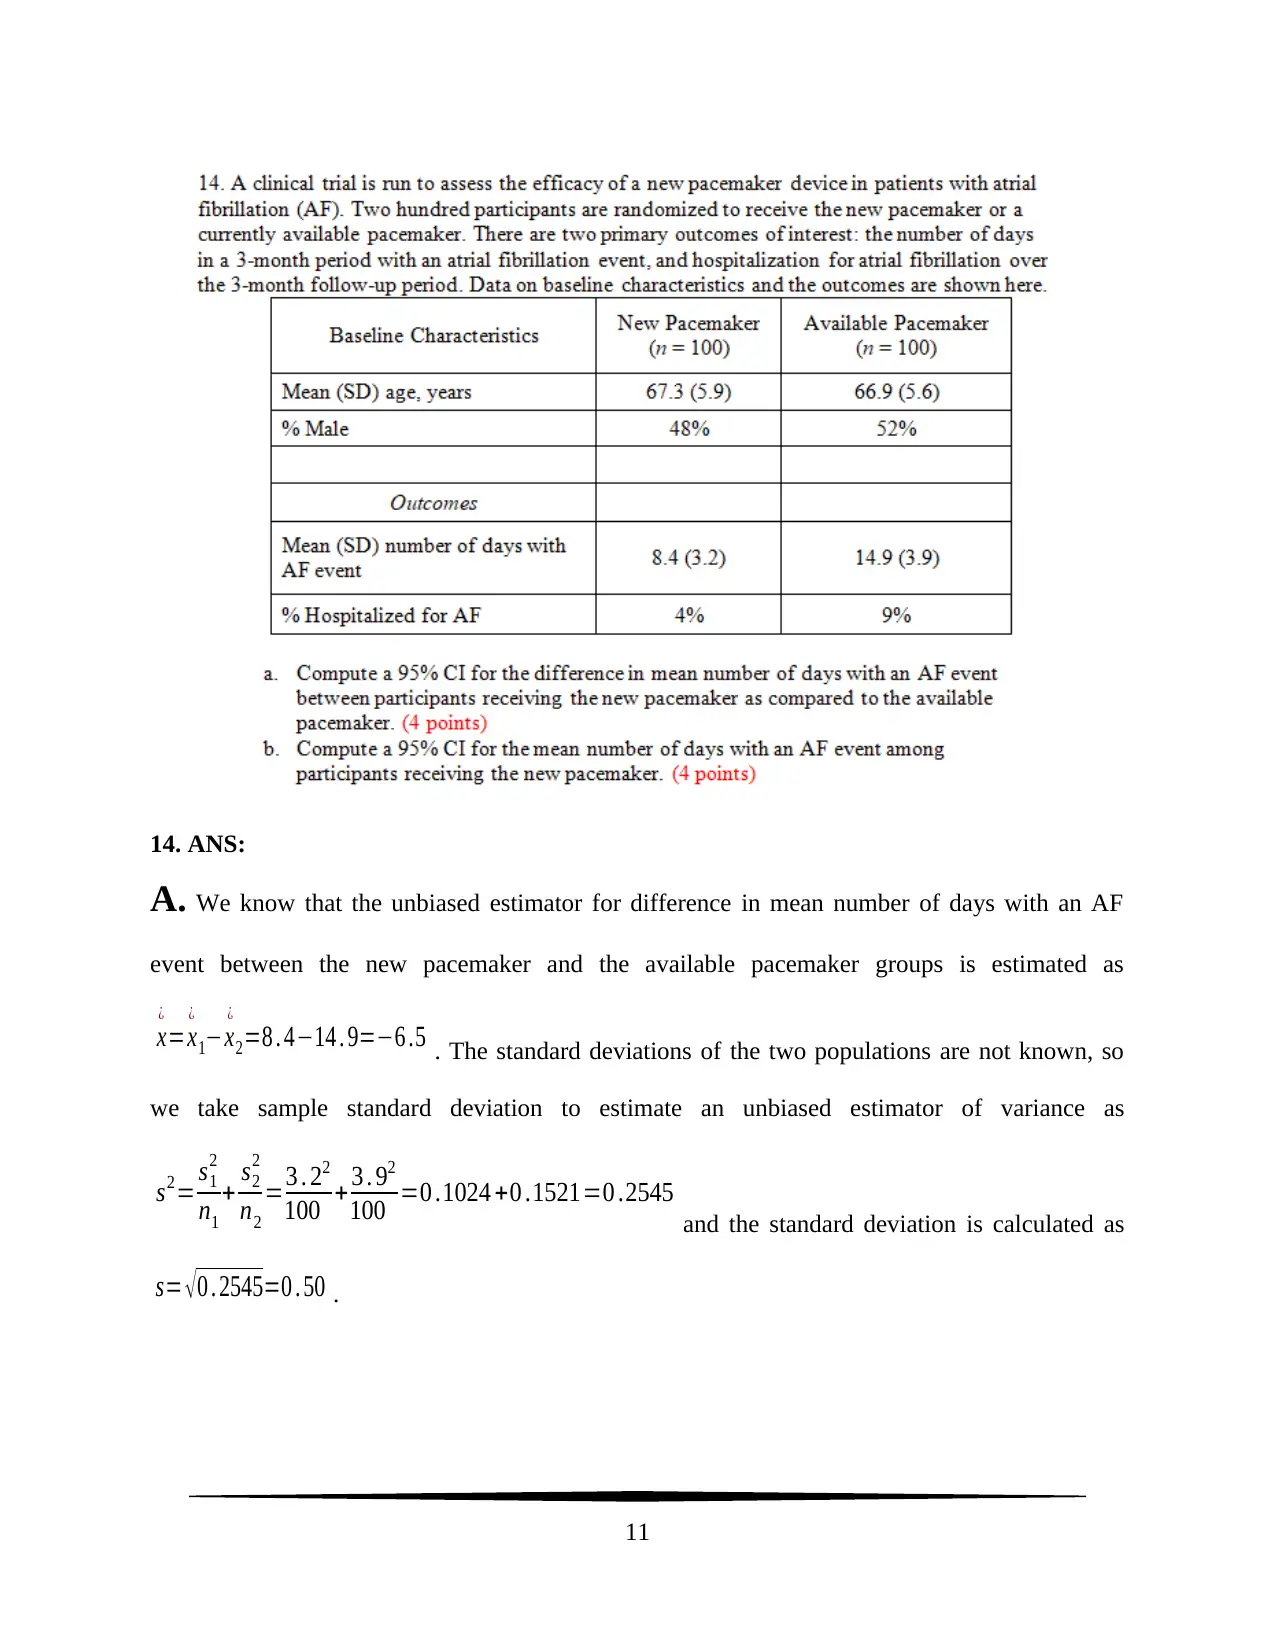
14. ANS:
A. We know that the unbiased estimator for difference in mean number of days with an AF
event between the new pacemaker and the available pacemaker groups is estimated as
x
¿
=x
¿
1−x
¿
2=8 . 4−14 . 9=−6 .5 . The standard deviations of the two populations are not known, so
we take sample standard deviation to estimate an unbiased estimator of variance as
s2= s1
2
n1
+ s2
2
n2
=3 . 22
100 + 3 . 92
100 =0 .1024 +0 .1521=0 .2545
and the standard deviation is calculated as
s= √ 0 . 2545=0 . 50 .
11
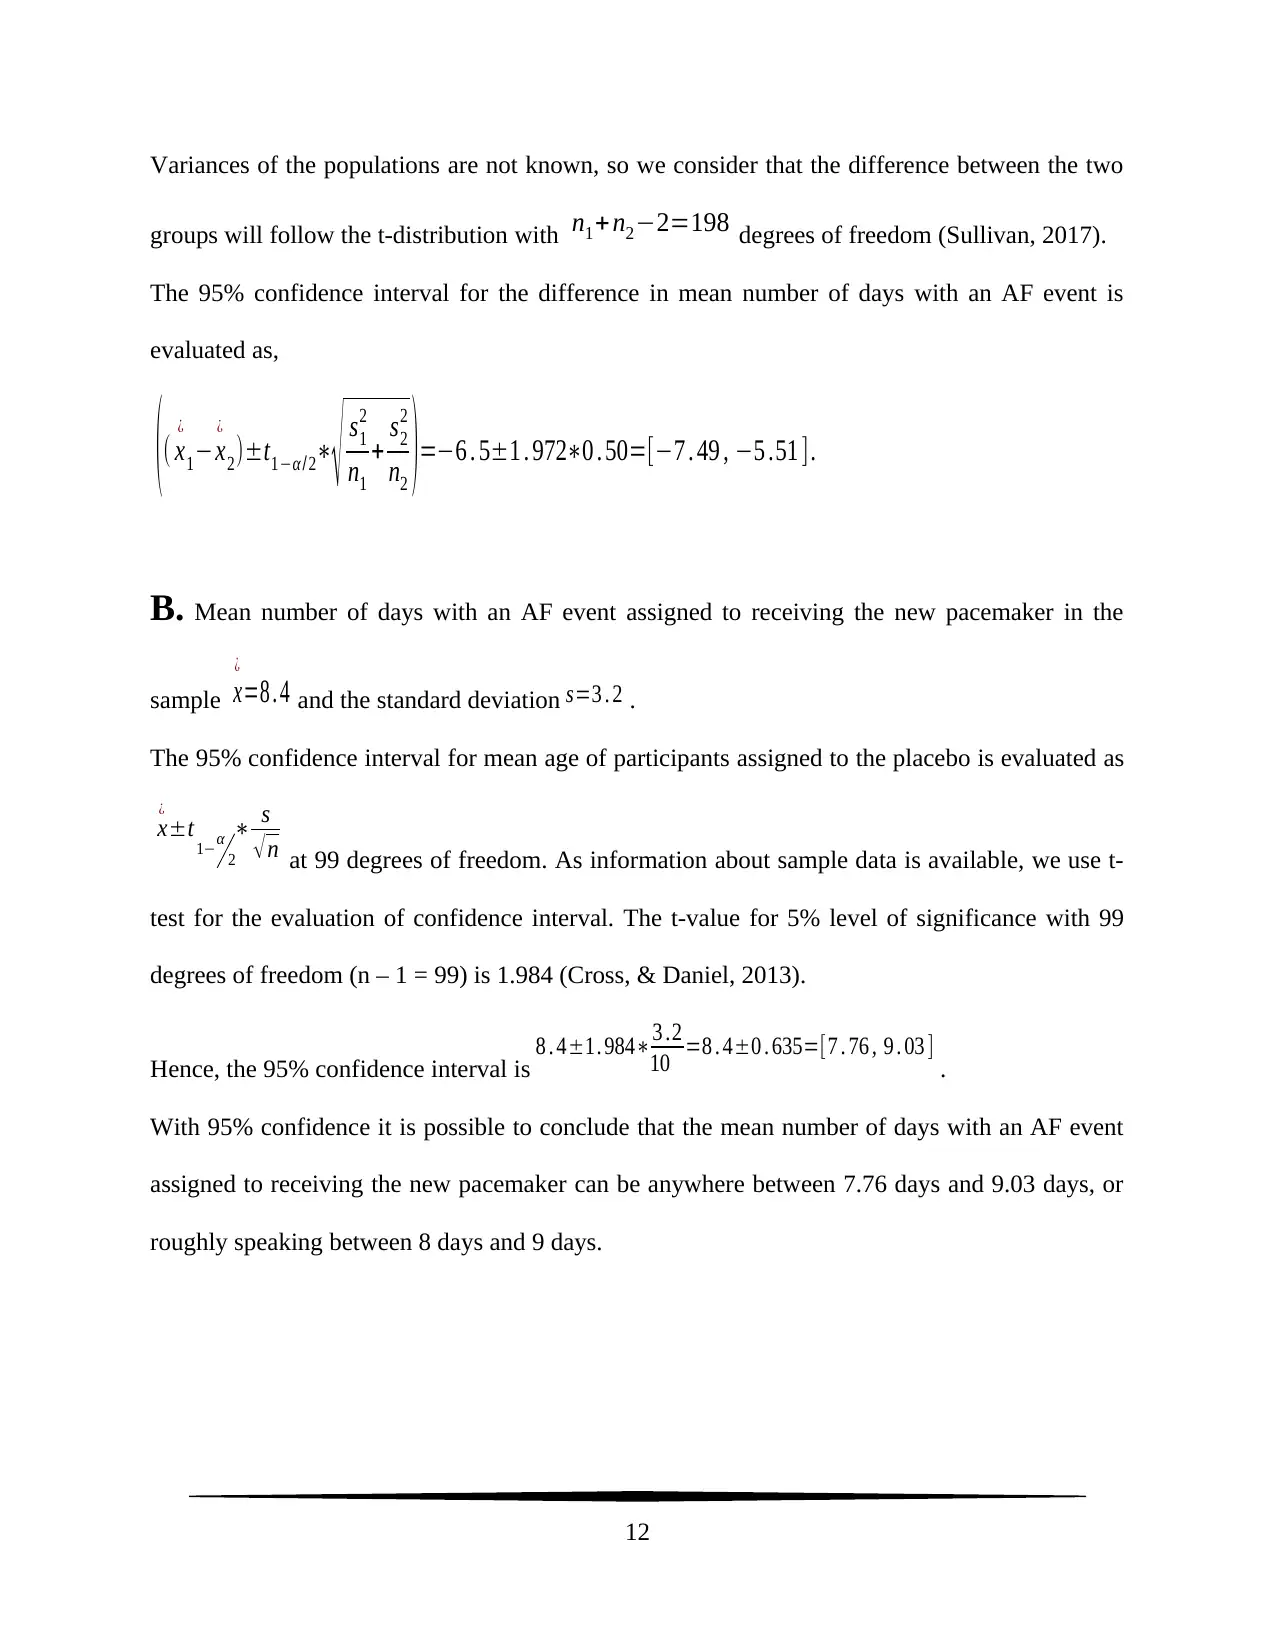
Variances of the populations are not known, so we consider that the difference between the two
groups will follow the t-distribution with n1+ n2−2=198 degrees of freedom (Sullivan, 2017).
The 95% confidence interval for the difference in mean number of days with an AF event is
evaluated as,
(( x
¿
1−x
¿
2)±t1−α /2∗
√ s1
2
n1
+ s2
2
n2 )=−6 . 5±1 . 972∗0 . 50=[−7 . 49 , −5 .51 ].
B. Mean number of days with an AF event assigned to receiving the new pacemaker in the
sample x
¿
=8 . 4 and the standard deviation s=3 . 2 .
The 95% confidence interval for mean age of participants assigned to the placebo is evaluated as
x
¿
±t 1−α
2
∗ s
√ n at 99 degrees of freedom. As information about sample data is available, we use t-
test for the evaluation of confidence interval. The t-value for 5% level of significance with 99
degrees of freedom (n – 1 = 99) is 1.984 (Cross, & Daniel, 2013).
Hence, the 95% confidence interval is 8 . 4±1. 984∗3 .2
10 =8 . 4±0 . 635=[7 . 76 , 9 . 03 ] .
With 95% confidence it is possible to conclude that the mean number of days with an AF event
assigned to receiving the new pacemaker can be anywhere between 7.76 days and 9.03 days, or
roughly speaking between 8 days and 9 days.
12
⊘ This is a preview!⊘
Do you want full access?
Subscribe today to unlock all pages.
Trusted by 1+ million students worldwide
1 out of 13

Your All-in-One AI-Powered Toolkit for Academic Success.
+13062052269
info@desklib.com
Available 24*7 on WhatsApp / Email
![[object Object]](/_next/static/media/star-bottom.7253800d.svg)
Unlock your academic potential
Copyright © 2020–2026 A2Z Services. All Rights Reserved. Developed and managed by ZUCOL.