Statistics Homework Solution: Confidence Intervals and Sample Size

Verified

Added on  2022/09/25

|12
|706
|28
Homework Assignment
AI Summary
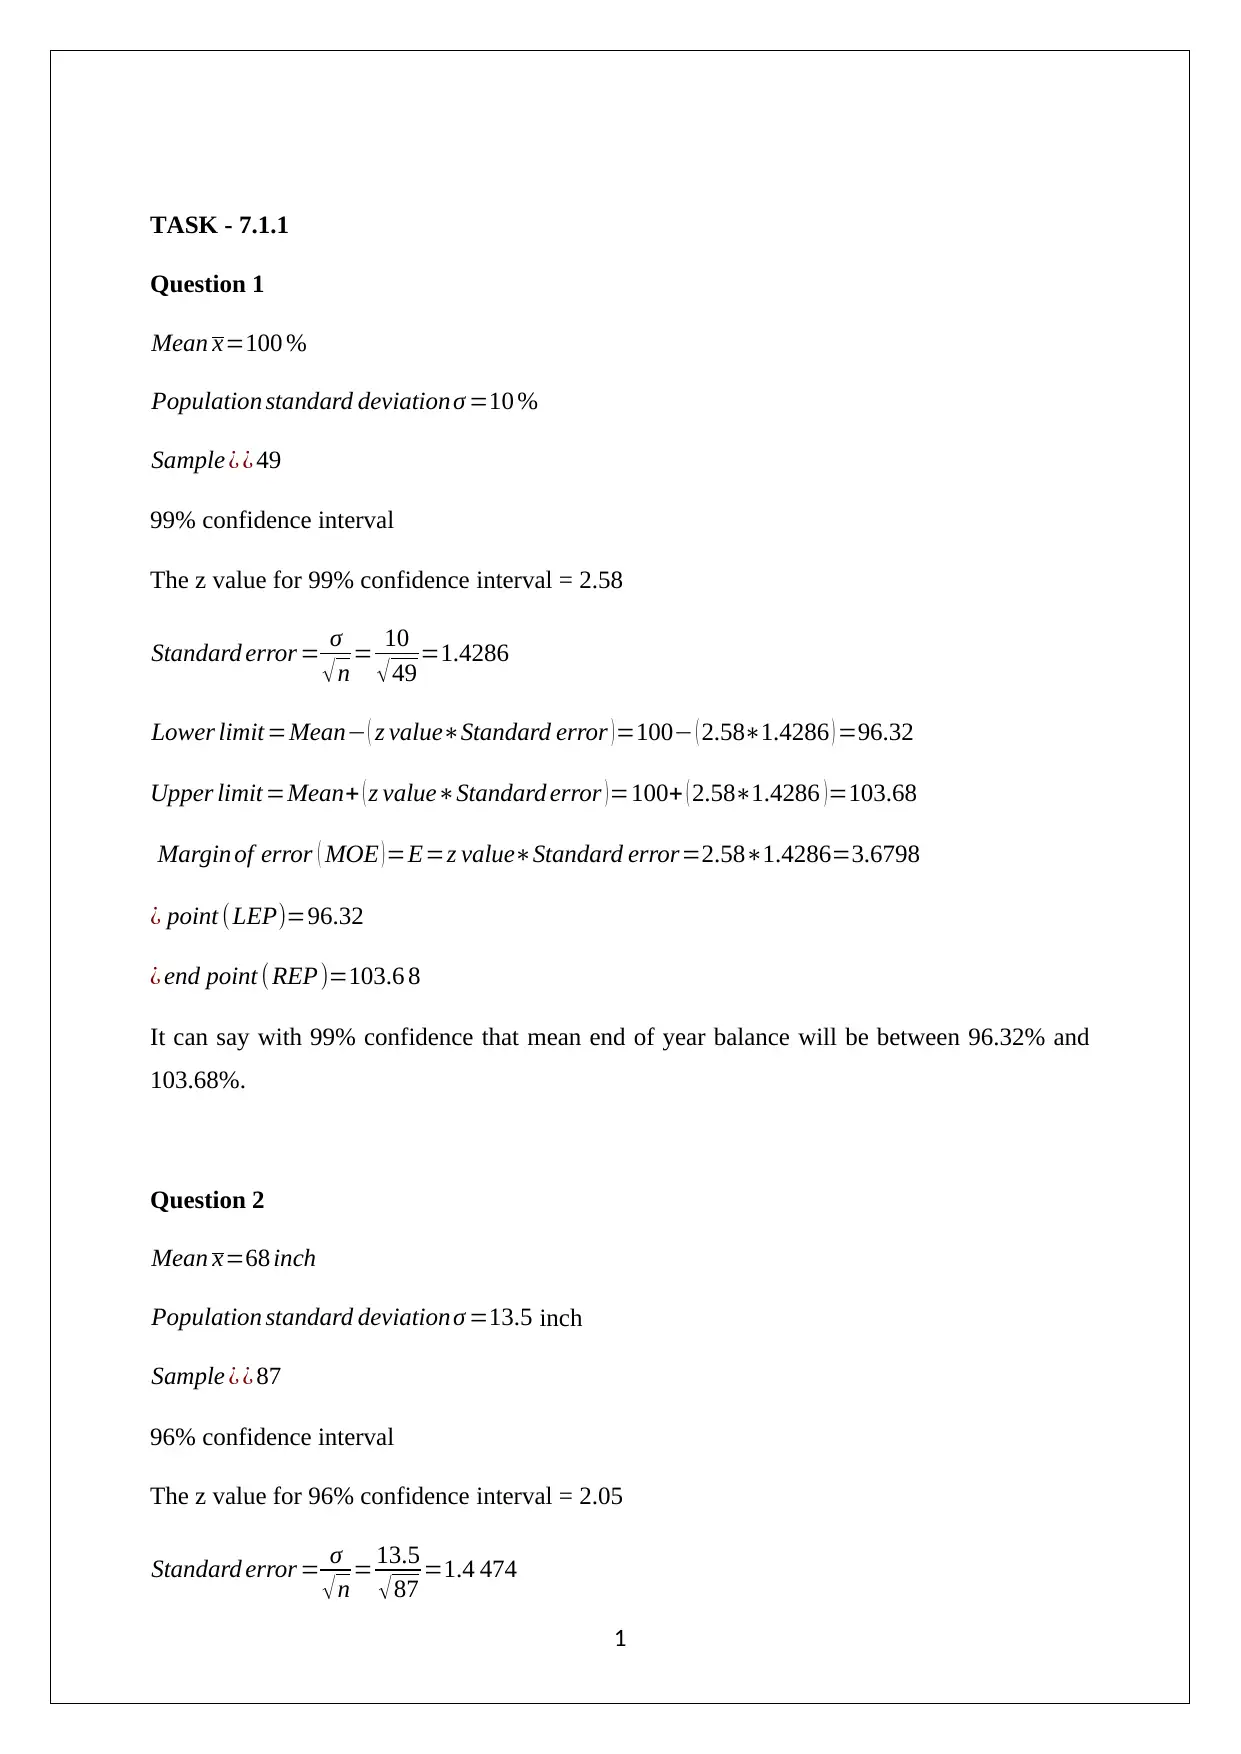
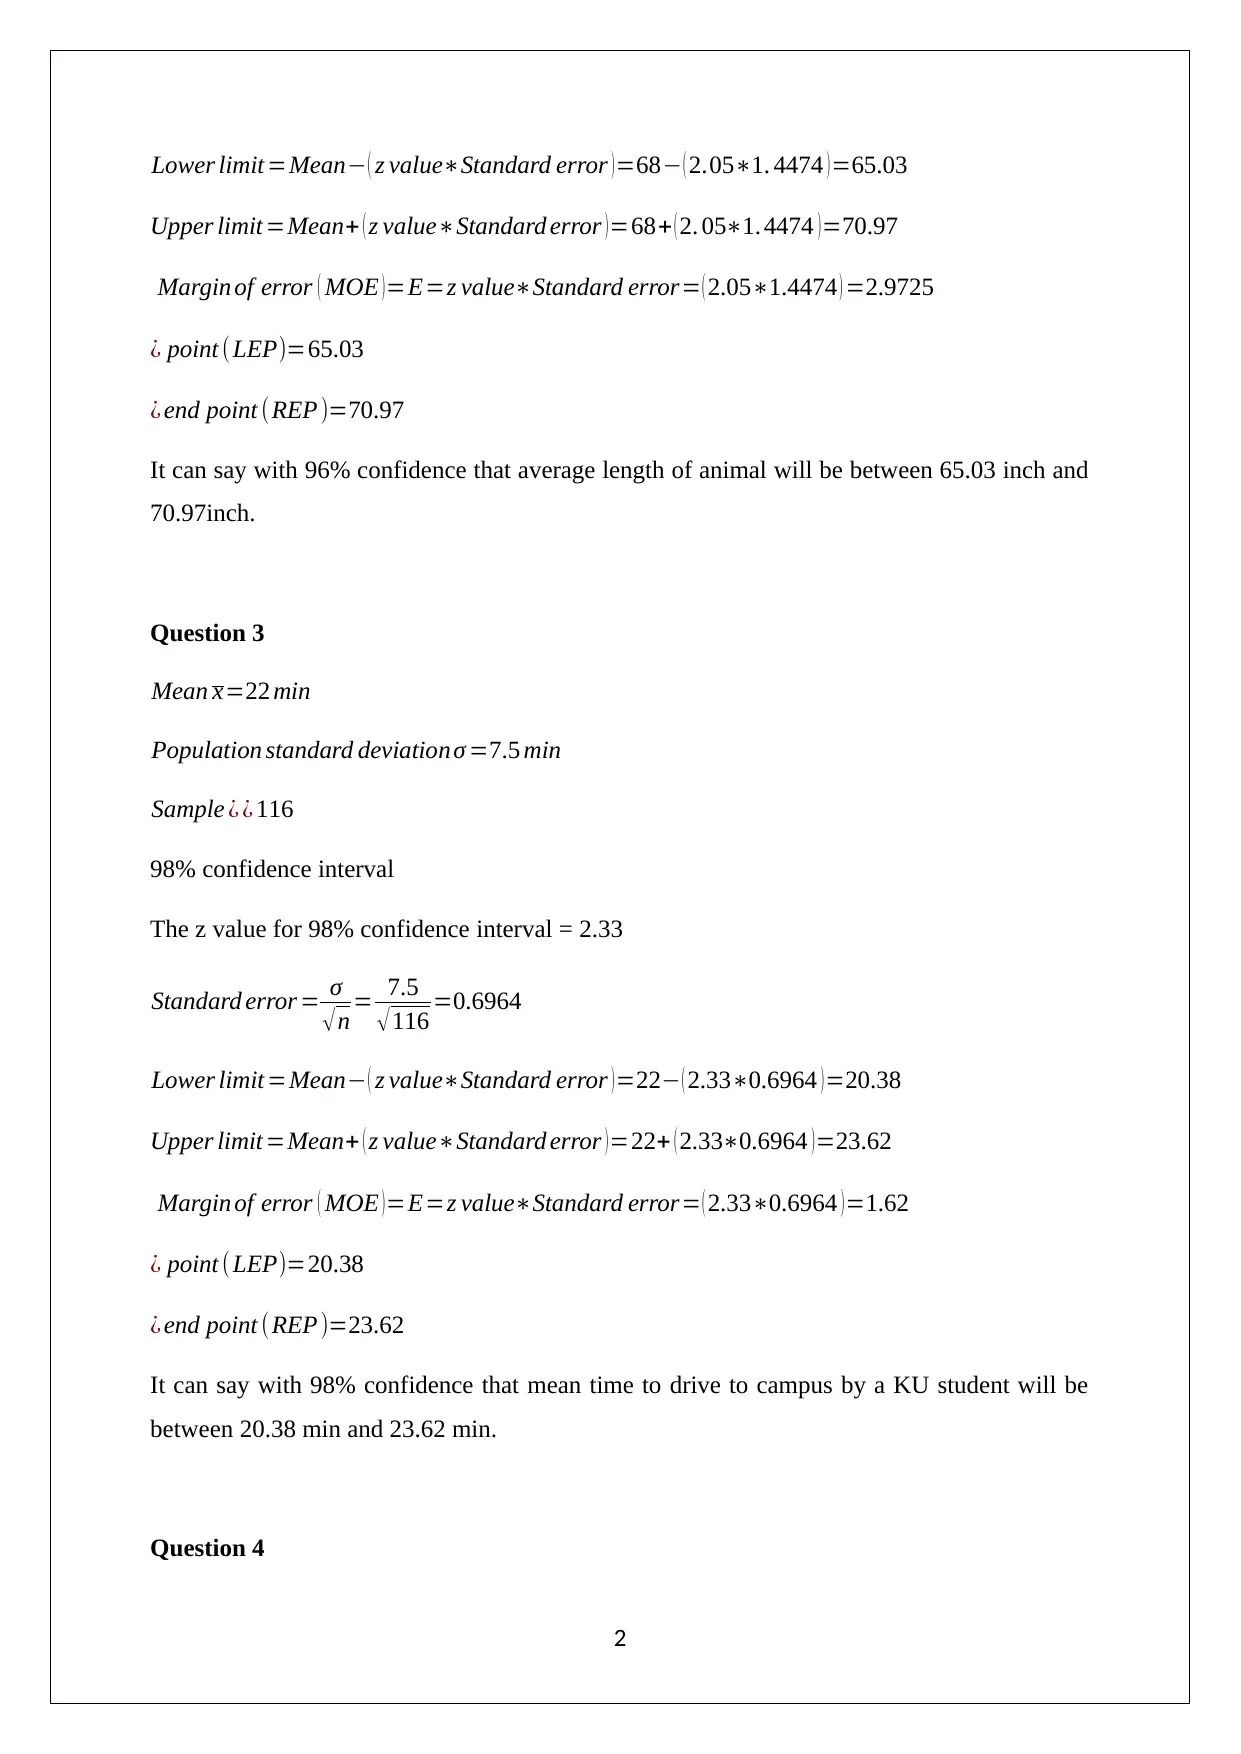
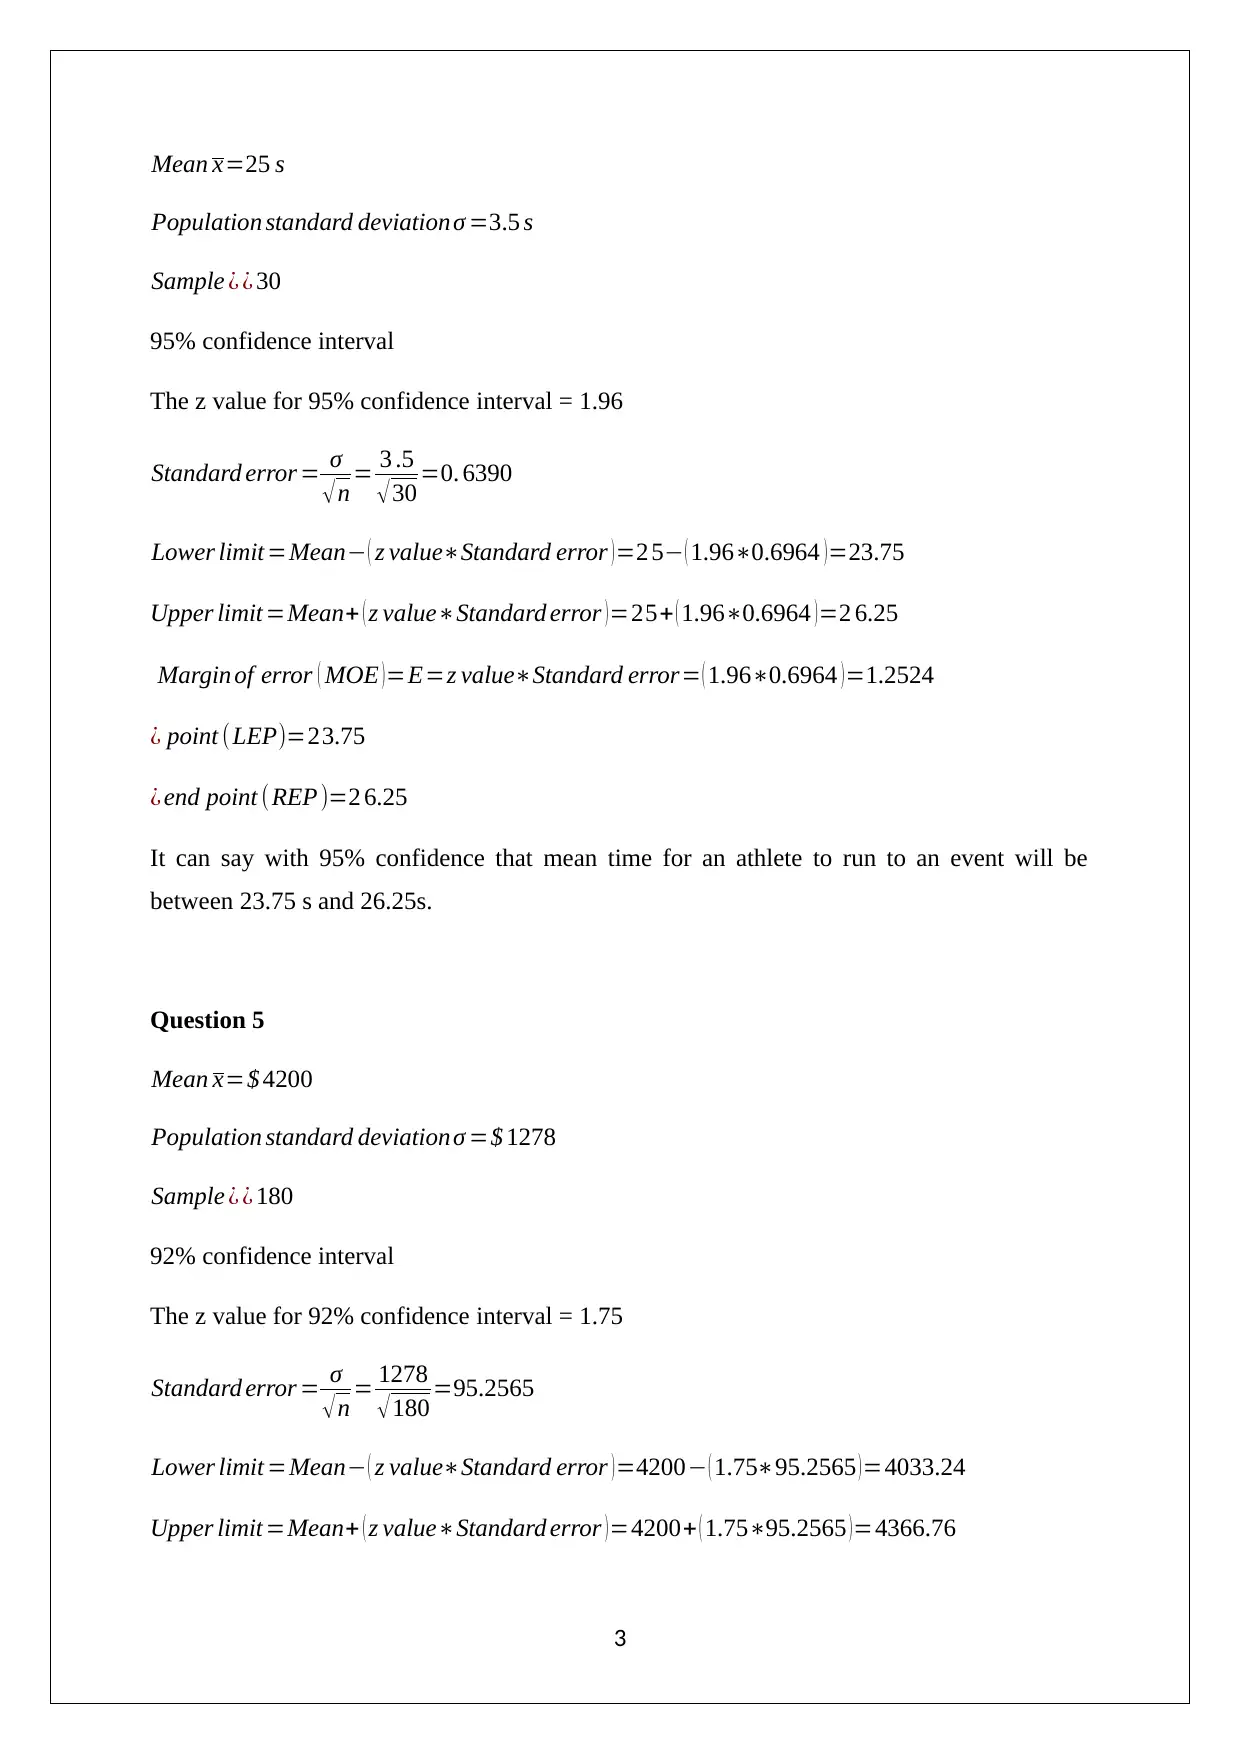
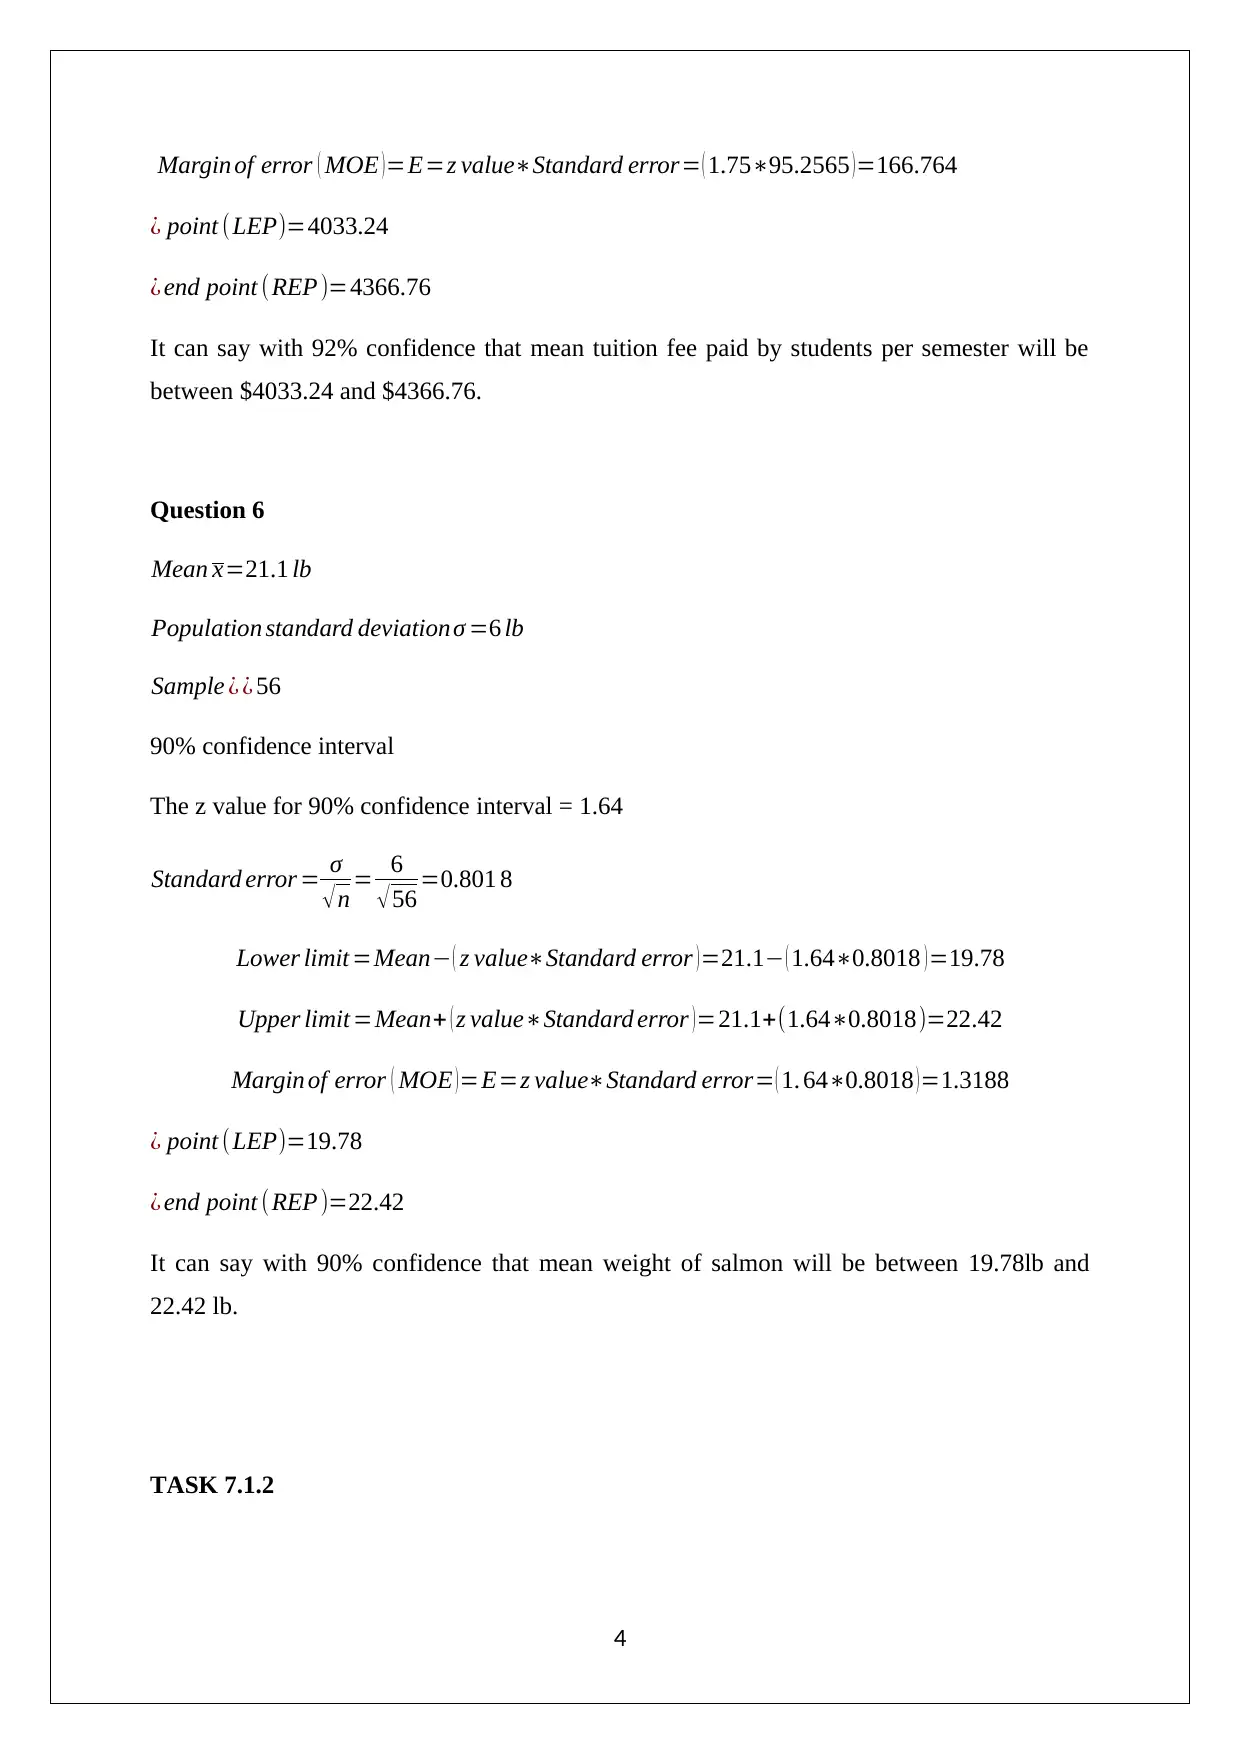
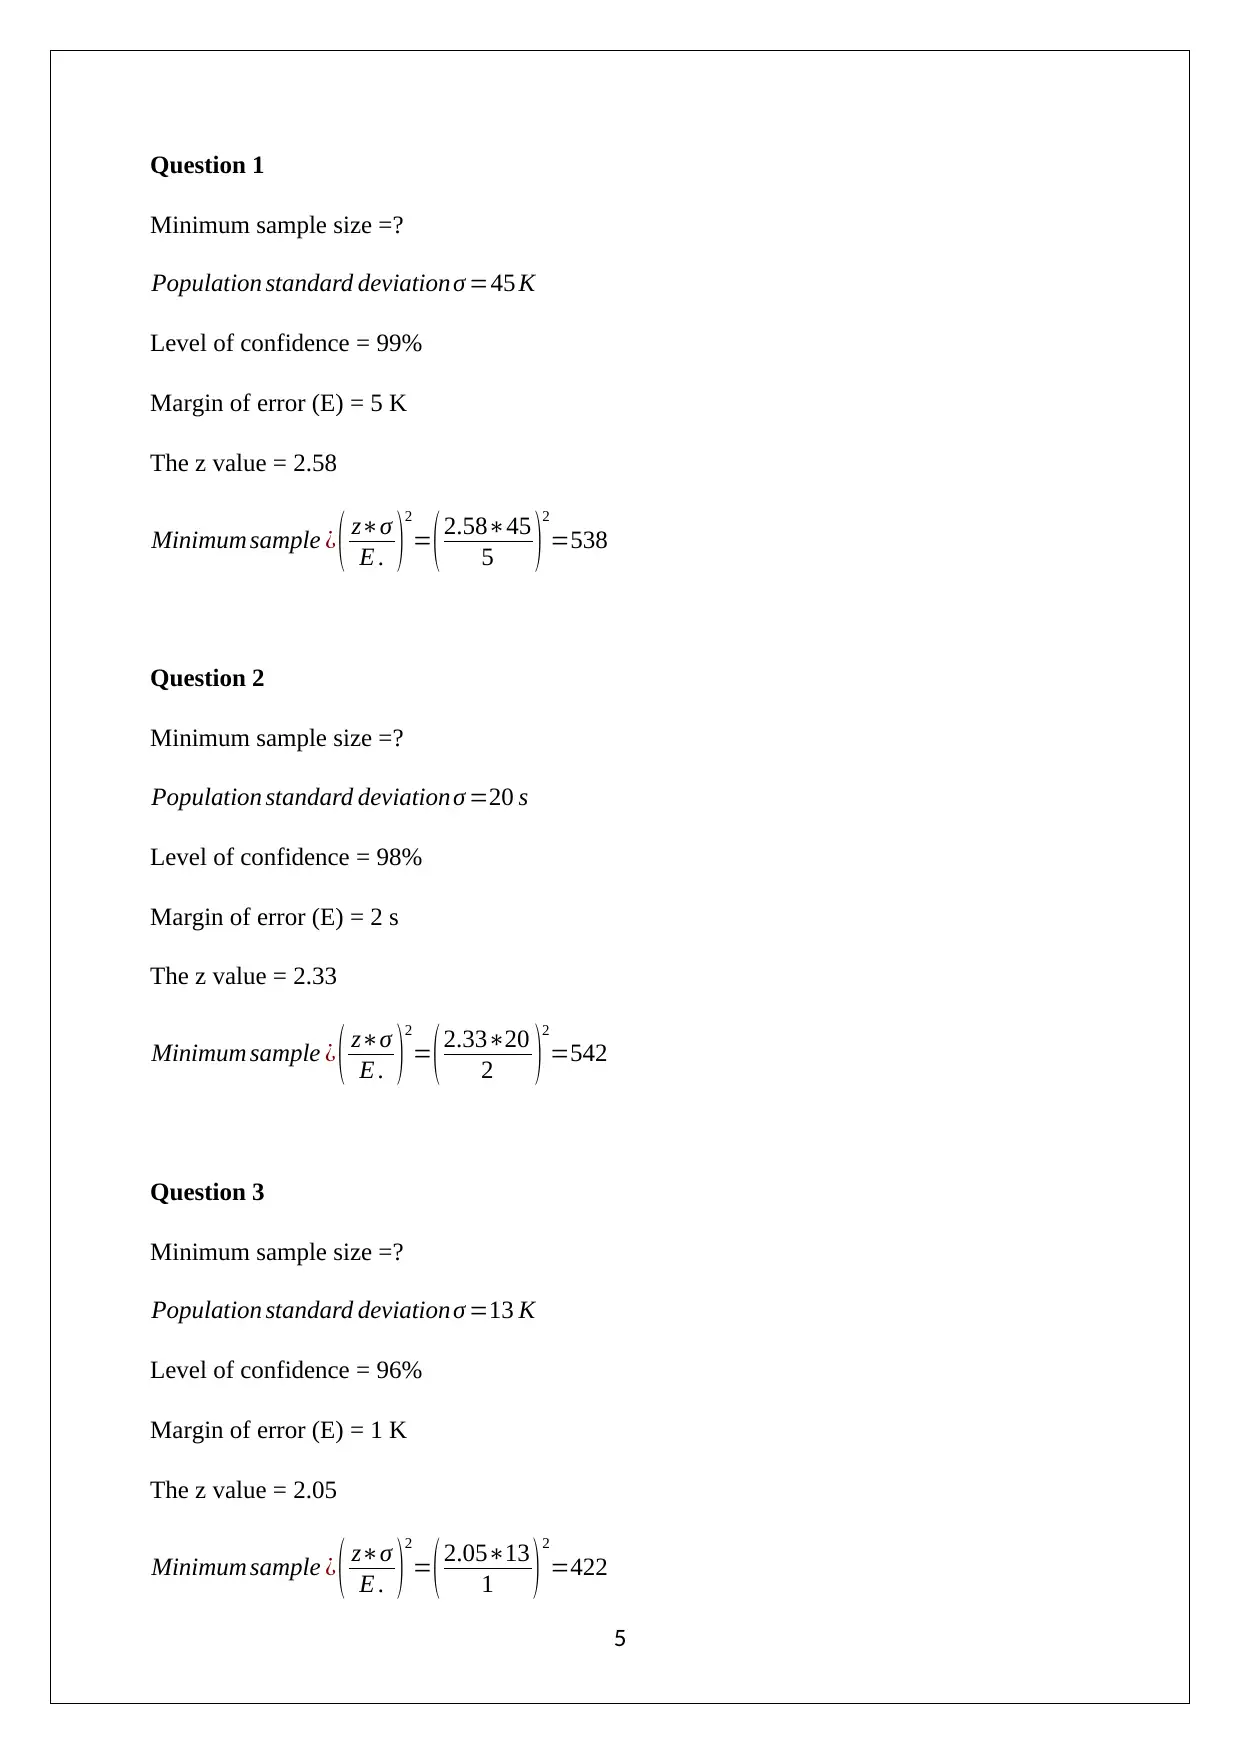
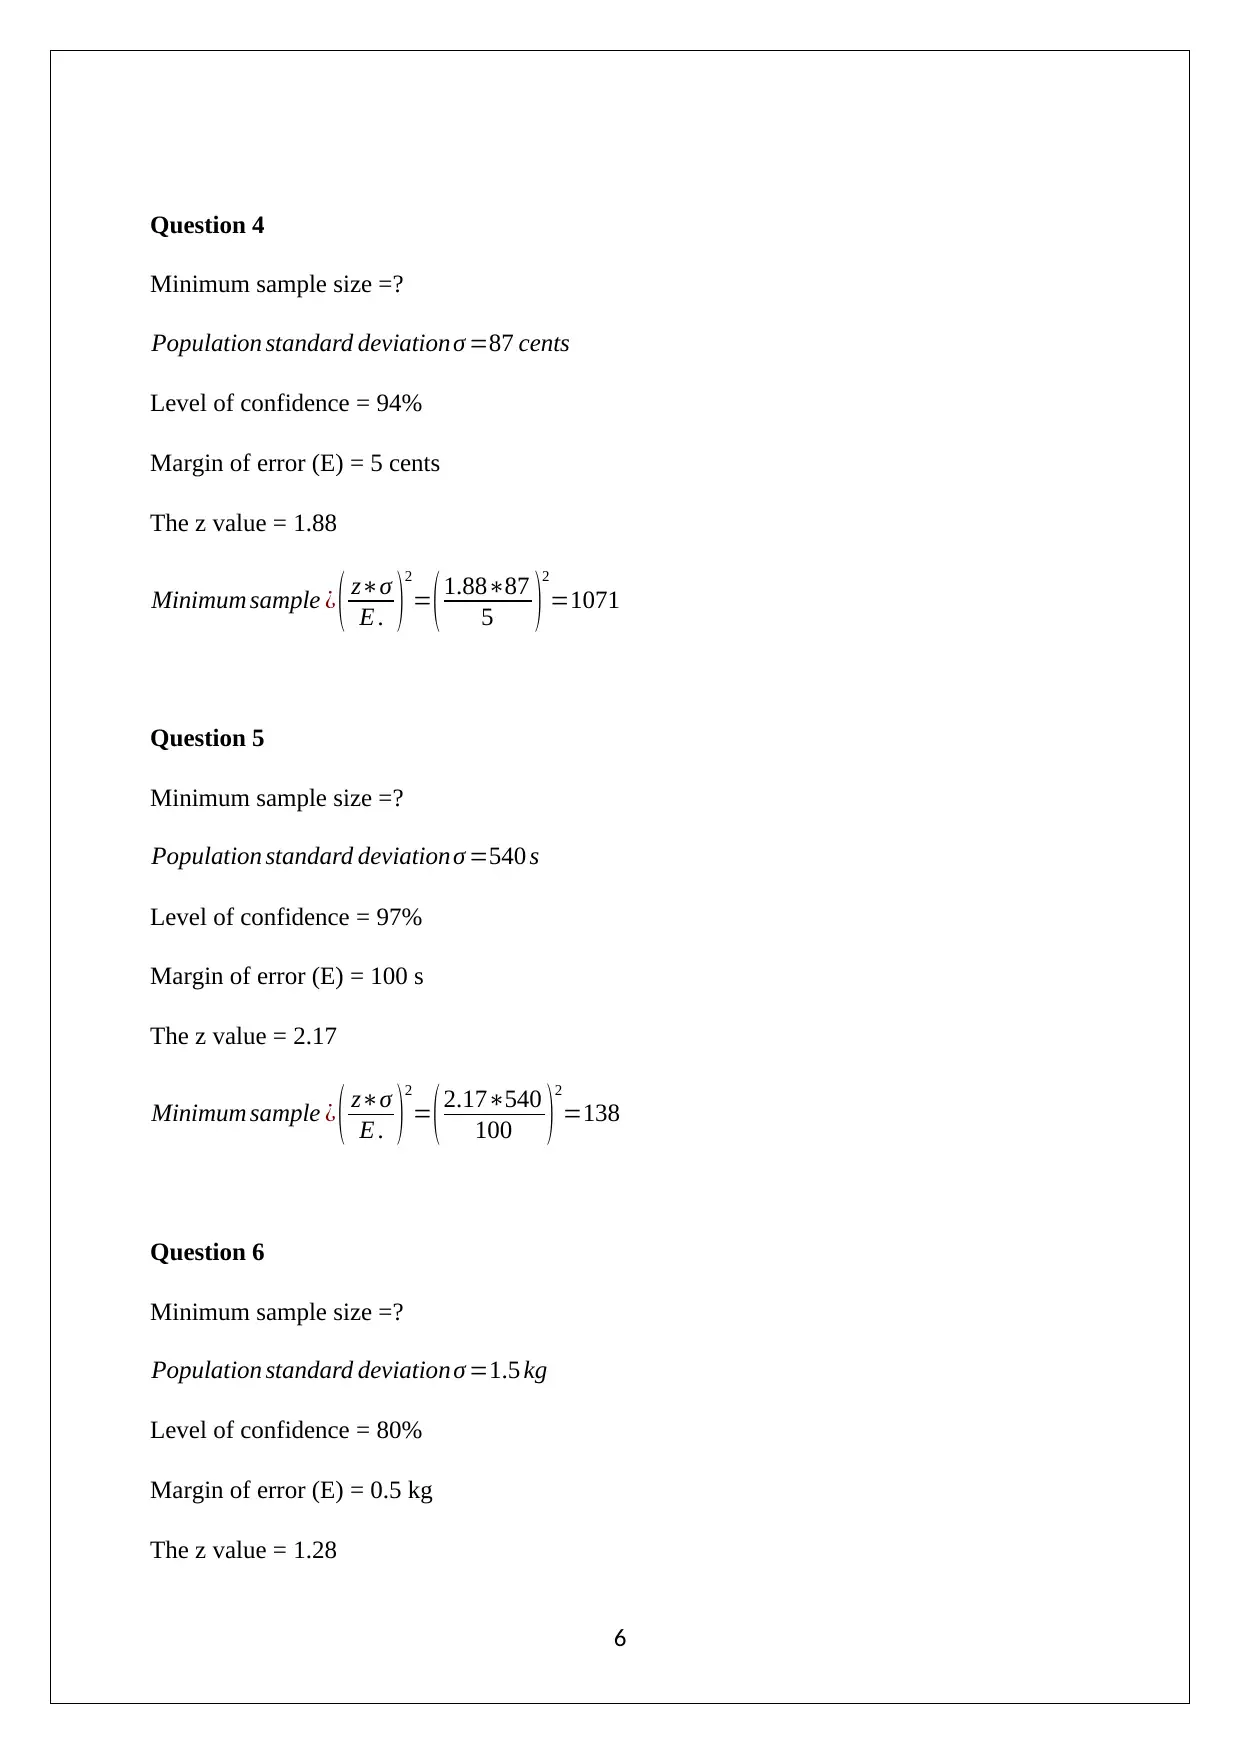
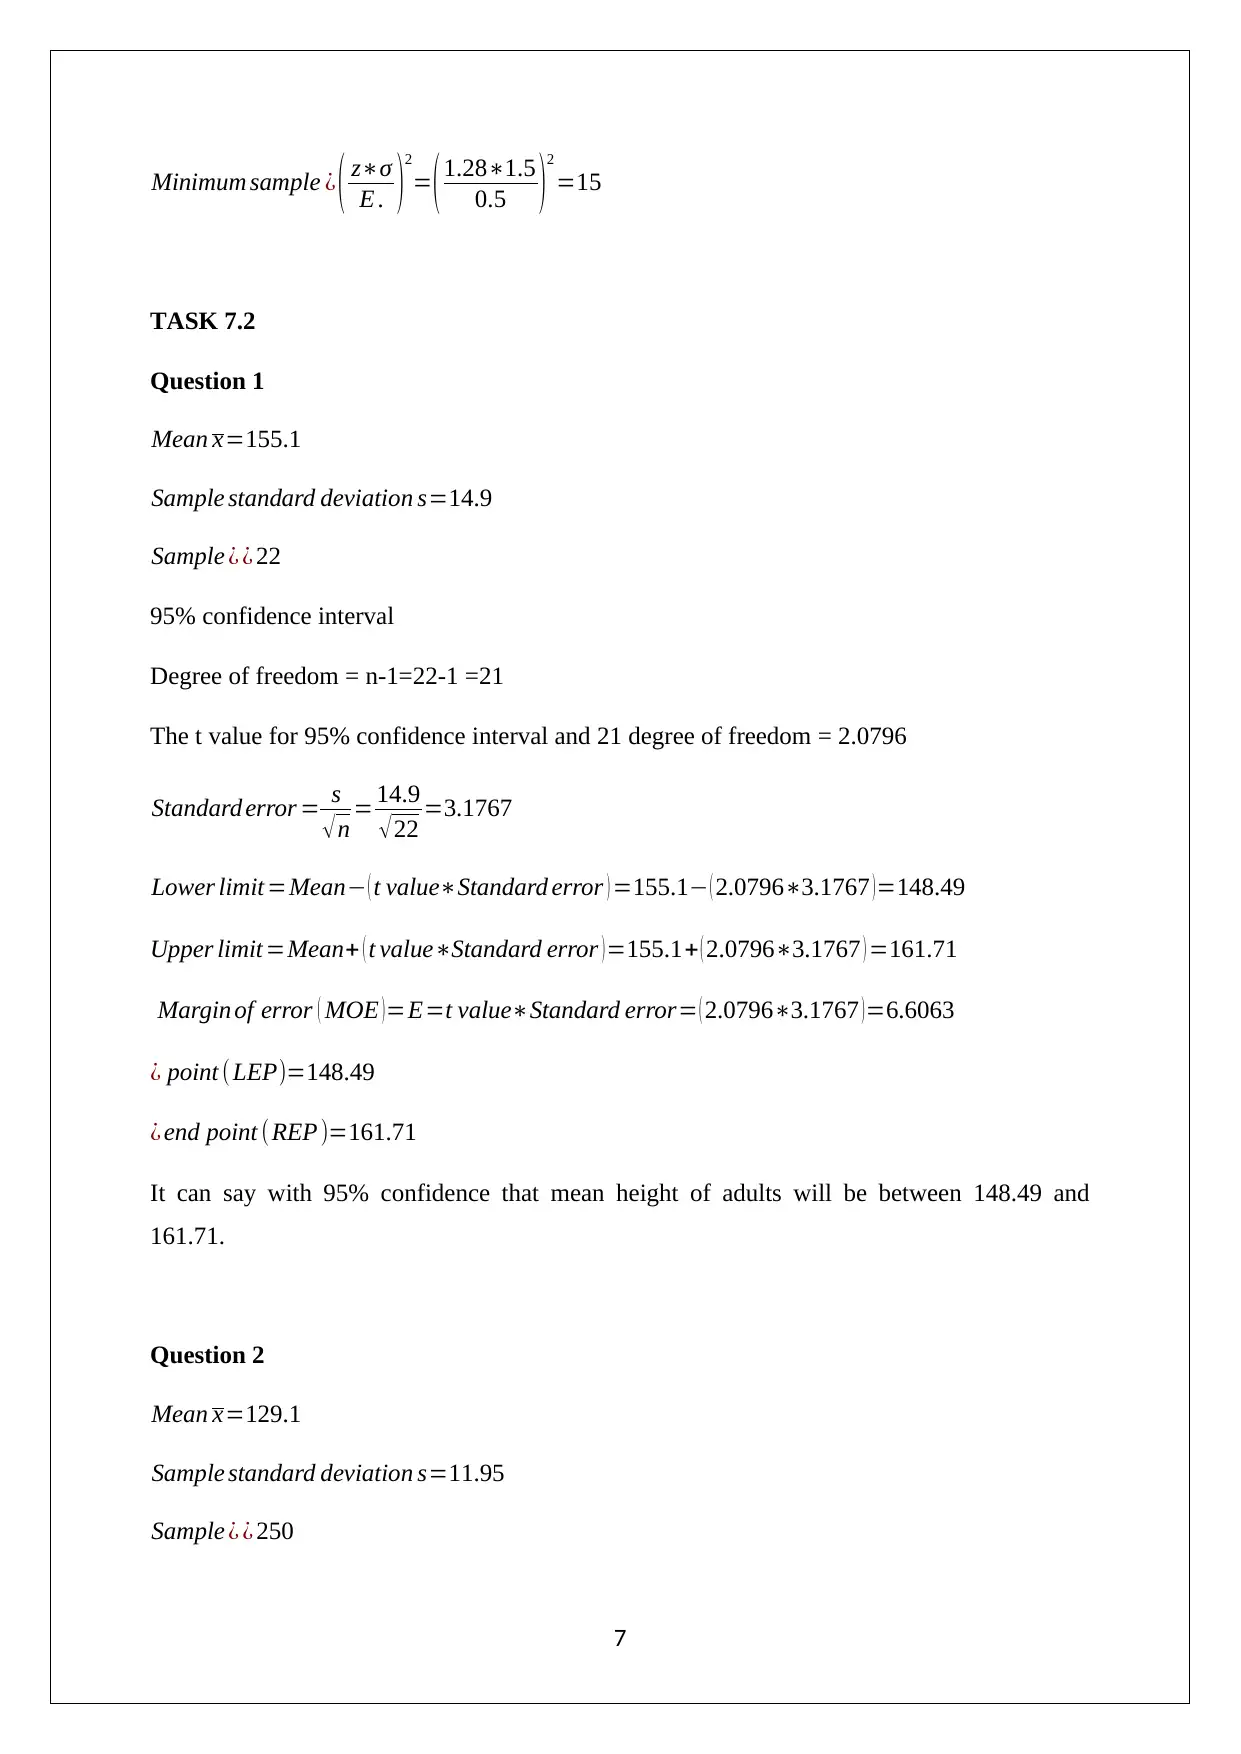
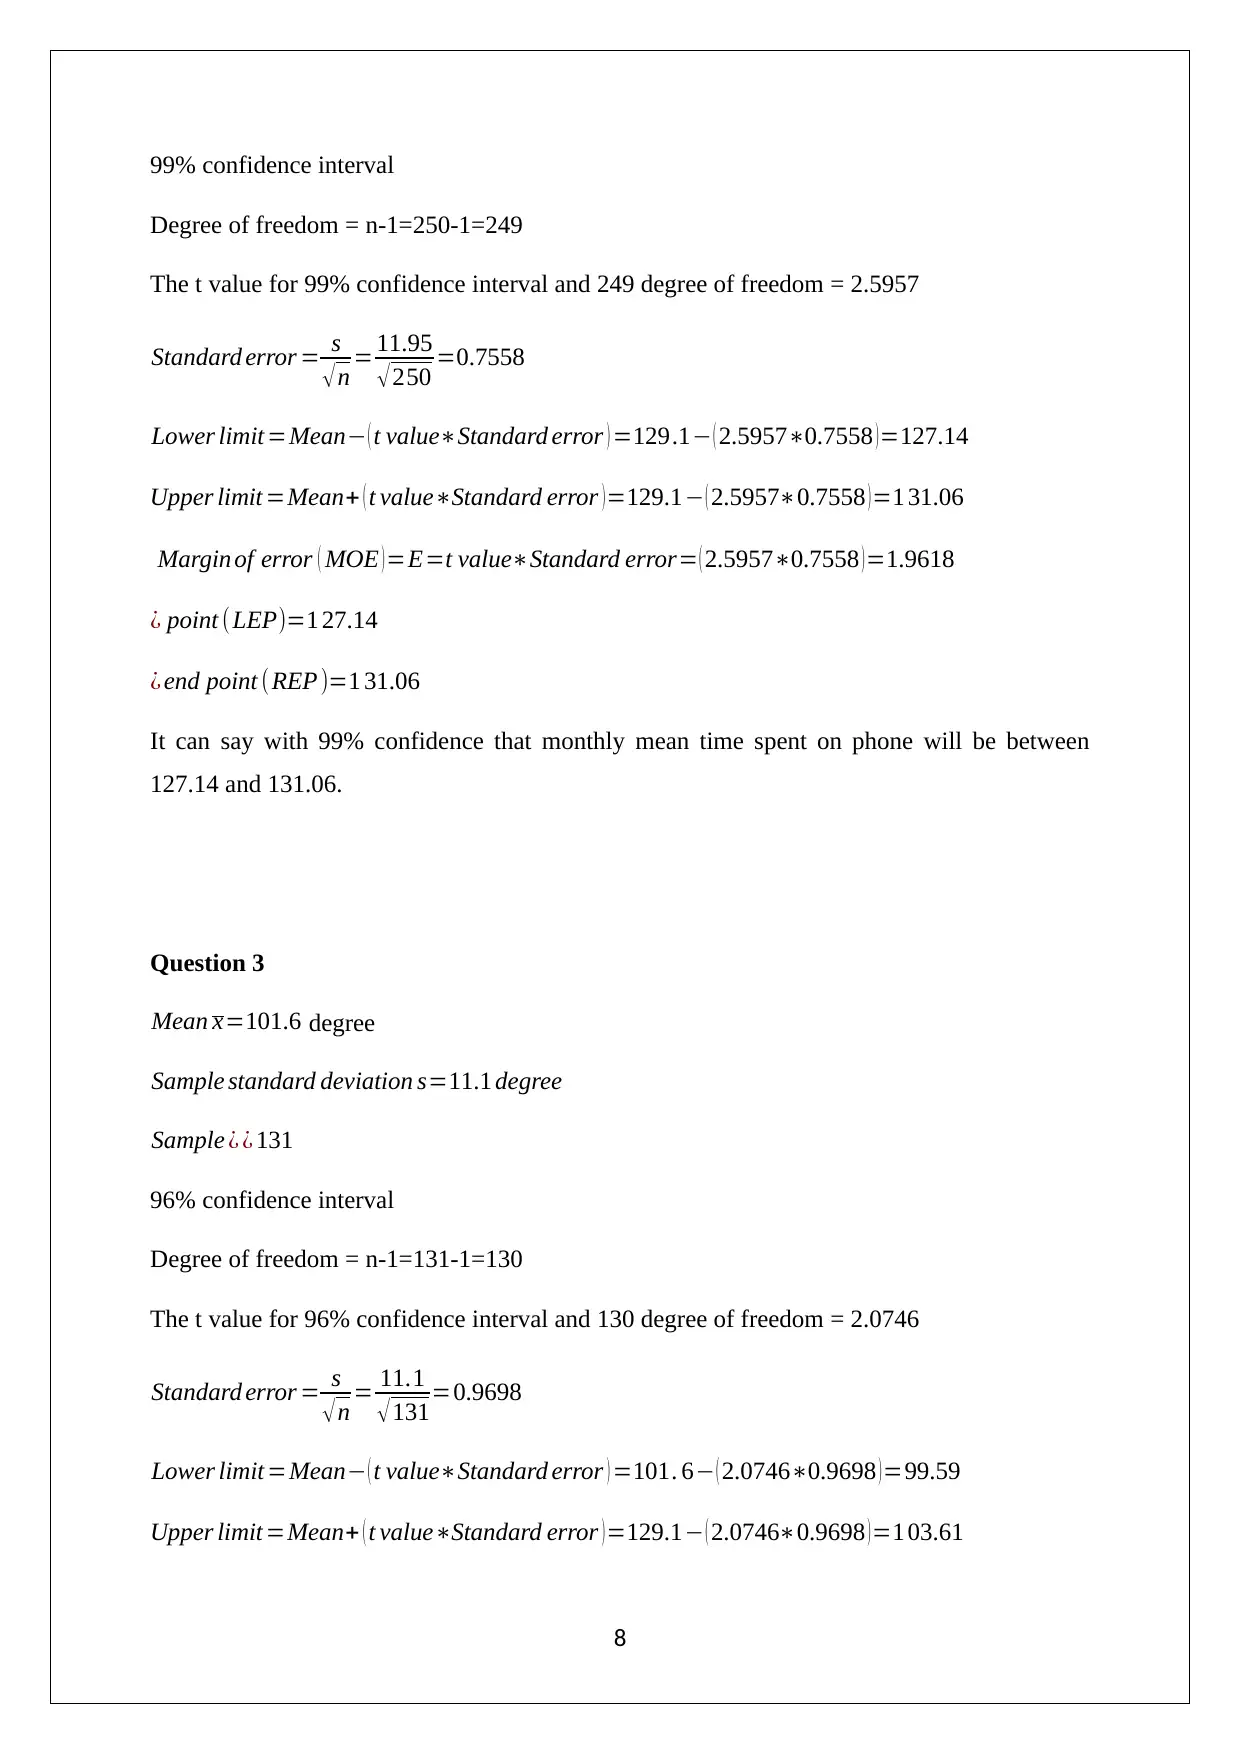
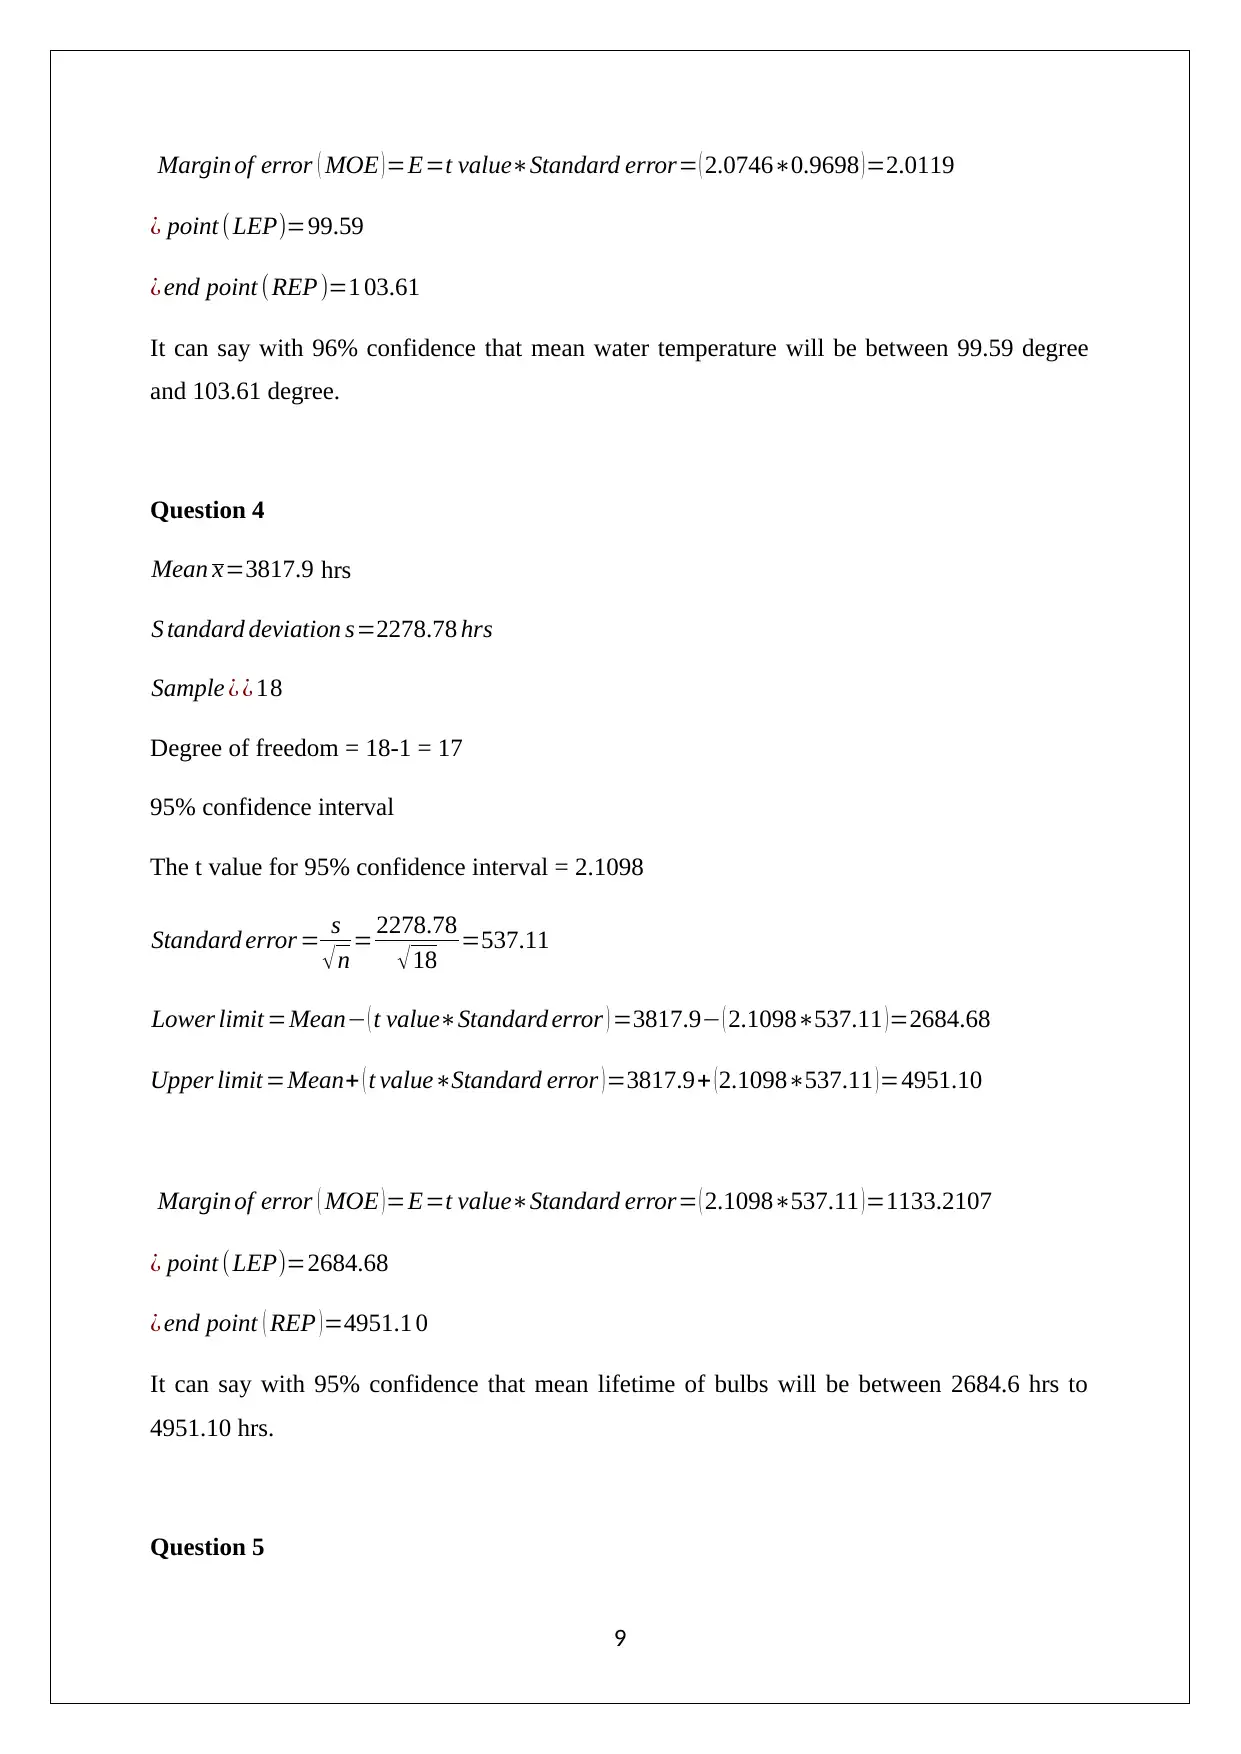
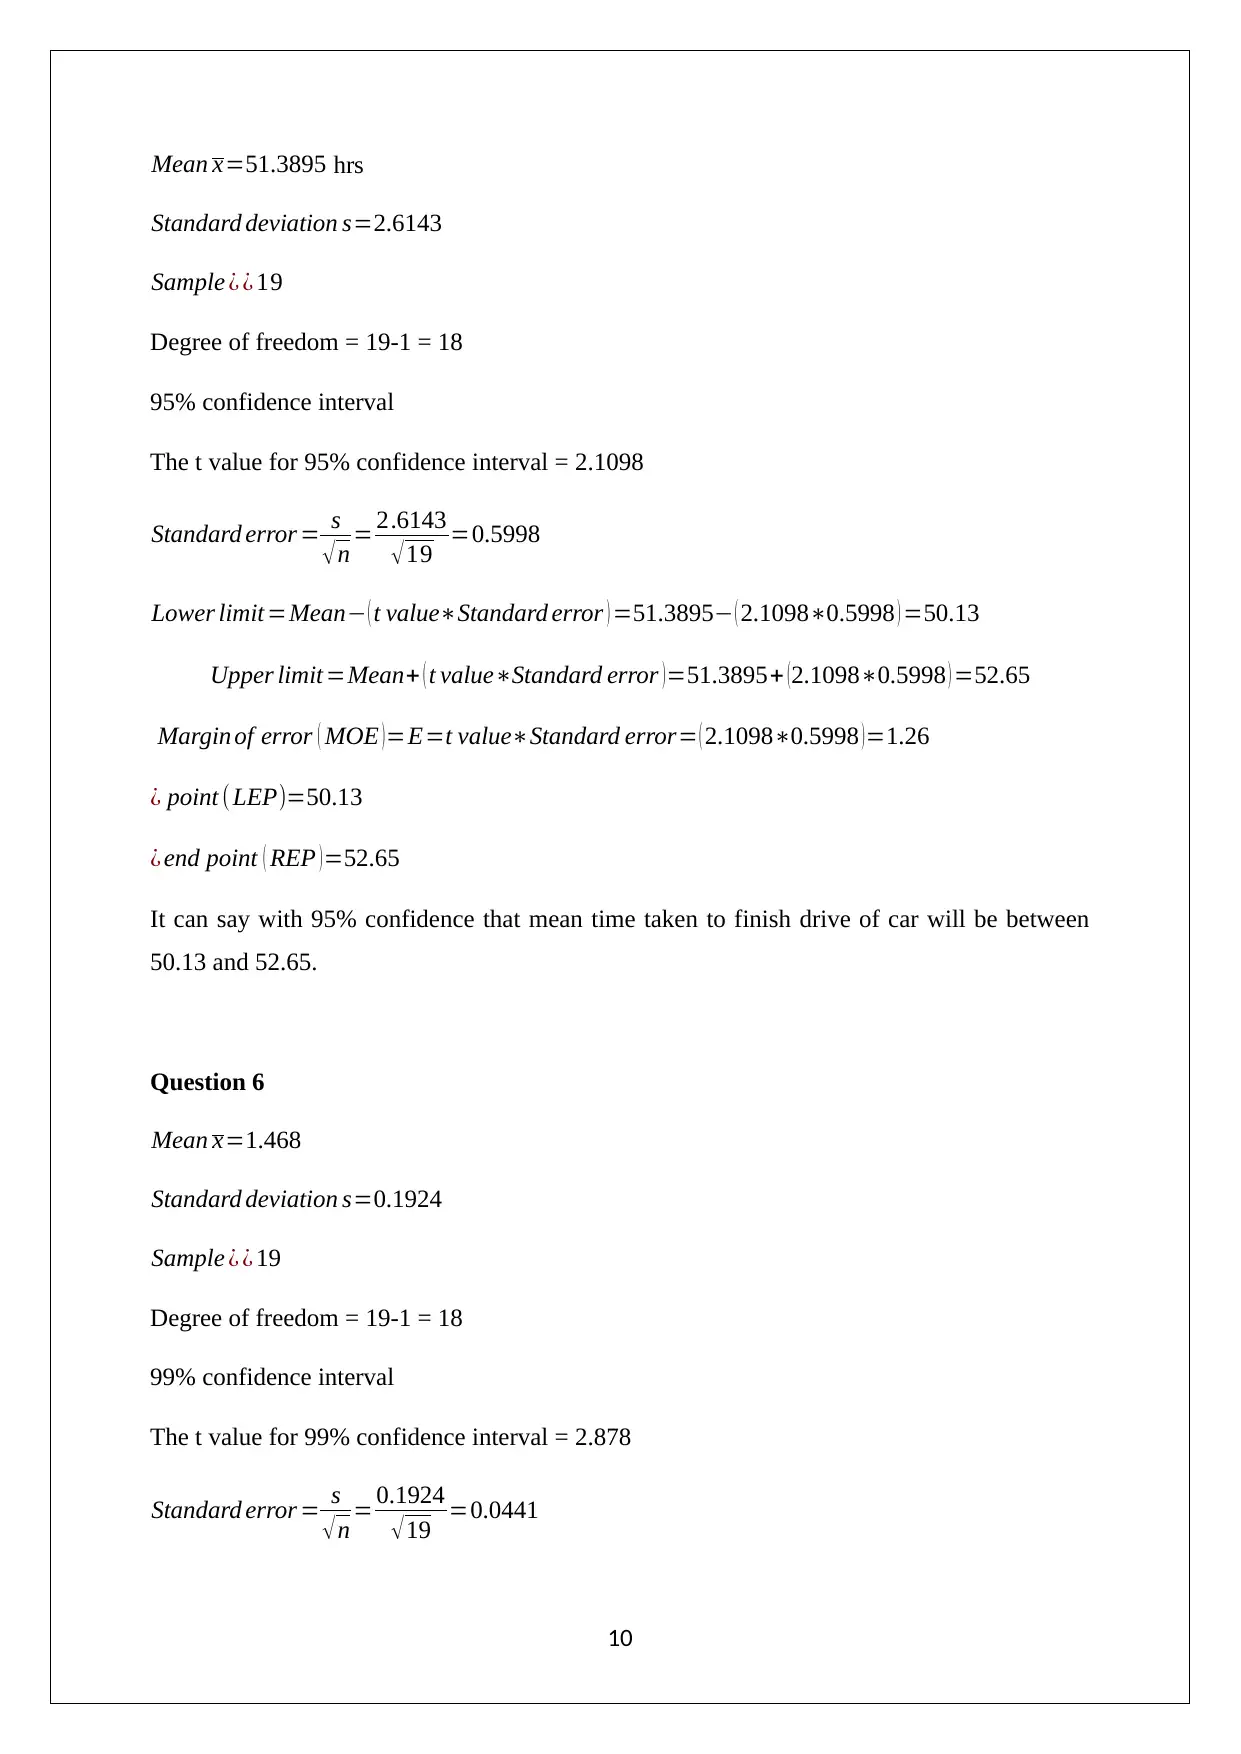
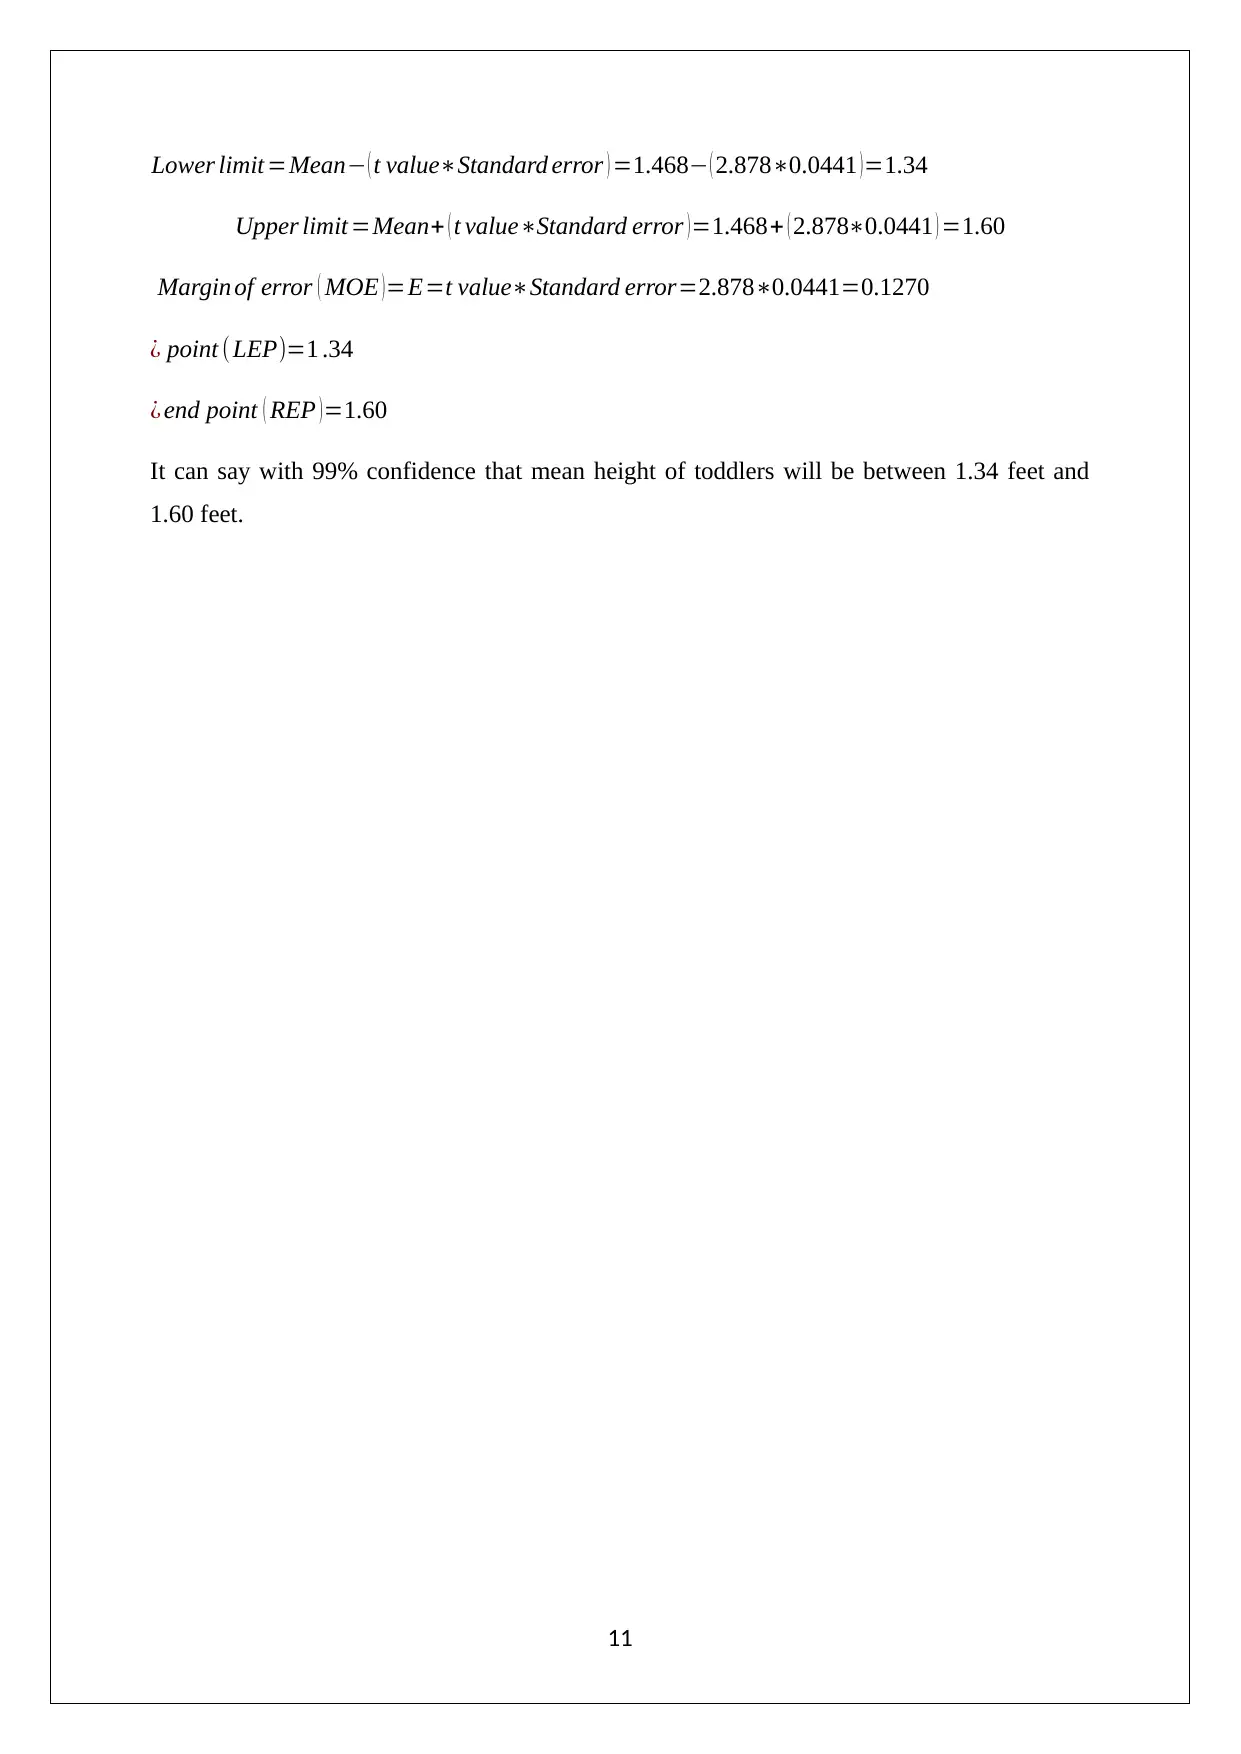
This document presents a complete solution to a statistics homework assignment. The assignment focuses on calculating confidence intervals using both z-values and t-values, across several scenarios. The solutions include detailed steps for determining the appropriate confidence intervals for various data sets, including end-of-year balances, animal lengths, travel times, and tuition fees. Additionally, the assignment covers the calculation of minimum sample sizes needed to achieve specific margins of error at different confidence levels. The solutions provide the necessary formulas and calculations for each problem, demonstrating how to apply statistical concepts to real-world situations. The solutions are organized by task and question number, making it easy to follow the logic and understand the methodology used to arrive at the correct answers. The document aims to provide a clear and concise explanation of the statistical principles involved, facilitating a better understanding of the concepts.
tabler-icon-diamond-filled.svg

Contribute Materials

Your contribution can guide someone’s learning journey. Share your documents today.
Document Page
STATISTICS
[DATE]
[Company name]
[Company address]
tabler-icon-diamond-filled.svg

Secure Best Marks with AI Grader

Need help grading? Try our AI Grader for instant feedback on your assignments.
Document Page
TASK - 7.1.1
Question 1
Mean x=100 %
Population standard deviation σ =10 %
Sample ¿ ¿ 49
99% confidence interval
The z value for 99% confidence interval = 2.58
Standard error = σ
n = 10
49 =1.4286
Lower limit =Mean ( z valueStandard error )=100 ( 2.581.4286 ) =96.32
Upper limit =Mean+ ( z valueStandard error )=100+ ( 2.581.4286 )=103.68
Margin of error ( MOE ) =E=z valueStandard error=2.581.4286=3.6798
¿ point (LEP)=96.32
¿ end point ( REP )=103.6 8
It can say with 99% confidence that mean end of year balance will be between 96.32% and
103.68%.
Question 2
Mean x=68 inch
Population standard deviationσ =13.5 inch
Sample ¿ ¿ 87
96% confidence interval
The z value for 96% confidence interval = 2.05
Standard error = σ
n = 13.5
87 =1.4 474
1
Document Page
Lower limit =Mean ( z valueStandard error )=68 ( 2.051. 4474 )=65.03
Upper limit =Mean+ ( z valueStandard error )=68+ ( 2. 051. 4474 )=70.97
Margin of error ( MOE )=E=z valueStandard error= ( 2.051.4474 ) =2.9725
¿ point ( LEP)=65.03
¿ end point (REP )=70.97
It can say with 96% confidence that average length of animal will be between 65.03 inch and
70.97inch.
Question 3
Mean x=22 min
Population standard deviation σ =7.5 min
Sample ¿ ¿ 116
98% confidence interval
The z value for 98% confidence interval = 2.33
Standard error = σ
n = 7.5
116 =0.6964
Lower limit =Mean ( z valueStandard error )=22 ( 2.330.6964 )=20.38
Upper limit =Mean+ ( z valueStandard error )=22+ ( 2.330.6964 )=23.62
Margin of error ( MOE )=E=z valueStandard error= ( 2.330.6964 )=1.62
¿ point ( LEP)=20.38
¿ end point (REP )=23.62
It can say with 98% confidence that mean time to drive to campus by a KU student will be
between 20.38 min and 23.62 min.
Question 4
2
Document Page
Mean x=25 s
Population standard deviation σ =3.5 s
Sample ¿ ¿ 30
95% confidence interval
The z value for 95% confidence interval = 1.96
Standard error = σ
n = 3 .5
30 =0. 6390
Lower limit =Mean ( z valueStandard error )=2 5 ( 1.960.6964 )=23.75
Upper limit =Mean+ ( z valueStandard error )=25+ ( 1.960.6964 )=2 6.25
Margin of error ( MOE )=E=z valueStandard error= ( 1.960.6964 )=1.2524
¿ point (LEP)=23.75
¿ end point (REP )=2 6.25
It can say with 95% confidence that mean time for an athlete to run to an event will be
between 23.75 s and 26.25s.
Question 5
Mean x=$ 4200
Population standard deviationσ =$ 1278
Sample ¿ ¿ 180
92% confidence interval
The z value for 92% confidence interval = 1.75
Standard error = σ
n = 1278
180 =95.2565
Lower limit =Mean ( z valueStandard error ) =4200 ( 1.7595.2565 ) =4033.24
Upper limit =Mean+ ( z valueStandard error )=4200+ ( 1.7595.2565 )=4366.76
3
tabler-icon-diamond-filled.svg

Secure Best Marks with AI Grader

Need help grading? Try our AI Grader for instant feedback on your assignments.
Document Page
Margin of error ( MOE )=E=z valueStandard error= ( 1.7595.2565 )=166.764
¿ point (LEP)=4033.24
¿ end point (REP )=4366.76
It can say with 92% confidence that mean tuition fee paid by students per semester will be
between $4033.24 and $4366.76.
Question 6
Mean x=21.1 lb
Population standard deviation σ =6 lb
Sample ¿ ¿ 56
90% confidence interval
The z value for 90% confidence interval = 1.64
Standard error = σ
n = 6
56 =0.801 8
Lower limit =Mean ( z valueStandard error )=21.1 ( 1.640.8018 )=19.78
Upper limit =Mean+ ( z valueStandard error ) =21.1+(1.640.8018)=22.42
Margin of error ( MOE )=E=z valueStandard error= ( 1. 640.8018 )=1.3188
¿ point (LEP)=19.78
¿ end point (REP )=22.42
It can say with 90% confidence that mean weight of salmon will be between 19.78lb and
22.42 lb.
TASK 7.1.2
4
Document Page
Question 1
Minimum sample size =?
Population standard deviationσ =45 K
Level of confidence = 99%
Margin of error (E) = 5 K
The z value = 2.58
Minimum sample ¿ ( zσ
E . )
2
= ( 2.5845
5 )
2
=538
Question 2
Minimum sample size =?
Population standard deviationσ =20 s
Level of confidence = 98%
Margin of error (E) = 2 s
The z value = 2.33
Minimum sample ¿ ( zσ
E . )2
= (2.3320
2 )2
=542
Question 3
Minimum sample size =?
Population standard deviationσ =13 K
Level of confidence = 96%
Margin of error (E) = 1 K
The z value = 2.05
Minimum sample ¿ ( zσ
E . )
2
= ( 2.0513
1 ) 2
=422
5
Document Page
Question 4
Minimum sample size =?
Population standard deviationσ =87 cents
Level of confidence = 94%
Margin of error (E) = 5 cents
The z value = 1.88
Minimum sample ¿ ( zσ
E . )2
= (1.8887
5 )2
=1071
Question 5
Minimum sample size =?
Population standard deviationσ =540 s
Level of confidence = 97%
Margin of error (E) = 100 s
The z value = 2.17
Minimum sample ¿ ( zσ
E . )2
= (2.17540
100 )2
=138
Question 6
Minimum sample size =?
Population standard deviationσ =1.5 kg
Level of confidence = 80%
Margin of error (E) = 0.5 kg
The z value = 1.28
6
tabler-icon-diamond-filled.svg

Paraphrase This Document

Need a fresh take? Get an instant paraphrase of this document with our AI Paraphraser
Document Page
Minimum sample ¿ ( zσ
E . )
2
= ( 1.281.5
0.5 )
2
=15
TASK 7.2
Question 1
Mean x=155.1
Sample standard deviation s=14.9
Sample ¿ ¿ 22
95% confidence interval
Degree of freedom = n-1=22-1 =21
The t value for 95% confidence interval and 21 degree of freedom = 2.0796
Standard error = s
n = 14.9
22 =3.1767
Lower limit =Mean ( t valueStandard error ) =155.1 ( 2.07963.1767 )=148.49
Upper limit =Mean+ ( t valueStandard error )=155.1+ ( 2.07963.1767 ) =161.71
Margin of error ( MOE )=E=t valueStandard error= ( 2.07963.1767 )=6.6063
¿ point (LEP)=148.49
¿ end point (REP )=161.71
It can say with 95% confidence that mean height of adults will be between 148.49 and
161.71.
Question 2
Mean x=129.1
Sample standard deviation s=11.95
Sample ¿ ¿ 250
7
Document Page
99% confidence interval
Degree of freedom = n-1=250-1=249
The t value for 99% confidence interval and 249 degree of freedom = 2.5957
Standard error = s
n = 11.95
250 =0.7558
Lower limit =Mean ( t valueStandard error ) =129.1 ( 2.59570.7558 )=127.14
Upper limit =Mean+ ( t valueStandard error ) =129.1 ( 2.59570.7558 ) =1 31.06
Margin of error ( MOE ) =E=t valueStandard error= ( 2.59570.7558 ) =1.9618
¿ point (LEP)=1 27.14
¿ end point (REP )=1 31.06
It can say with 99% confidence that monthly mean time spent on phone will be between
127.14 and 131.06.
Question 3
Mean x=101.6 degree
Sample standard deviation s=11.1 degree
Sample ¿ ¿ 131
96% confidence interval
Degree of freedom = n-1=131-1=130
The t value for 96% confidence interval and 130 degree of freedom = 2.0746
Standard error = s
n = 11.1
131=0.9698
Lower limit =Mean ( t valueStandard error ) =101. 6 ( 2.07460.9698 )=99.59
Upper limit =Mean+ ( t valueStandard error )=129.1 ( 2.07460.9698 )=1 03.61
8
Document Page
Margin of error ( MOE ) =E=t valueStandard error= ( 2.07460.9698 ) =2.0119
¿ point ( LEP)=99.59
¿ end point (REP )=1 03.61
It can say with 96% confidence that mean water temperature will be between 99.59 degree
and 103.61 degree.
Question 4
Mean x=3817.9 hrs
S tandard deviation s=2278.78 hrs
Sample ¿ ¿ 18
Degree of freedom = 18-1 = 17
95% confidence interval
The t value for 95% confidence interval = 2.1098
Standard error = s
n = 2278.78
18 =537.11
Lower limit =Mean ( t valueStandard error ) =3817.9 ( 2.1098537.11 ) =2684.68
Upper limit =Mean+ ( t valueStandard error )=3817.9+ (2.1098537.11 )=4951.10
Margin of error ( MOE )=E=t valueStandard error= ( 2.1098537.11 )=1133.2107
¿ point (LEP)=2684.68
¿ end point ( REP )=4951.1 0
It can say with 95% confidence that mean lifetime of bulbs will be between 2684.6 hrs to
4951.10 hrs.
Question 5
9
tabler-icon-diamond-filled.svg

Secure Best Marks with AI Grader

Need help grading? Try our AI Grader for instant feedback on your assignments.
Document Page
Mean x=51.3895 hrs
Standard deviation s=2.6143
Sample ¿ ¿ 19
Degree of freedom = 19-1 = 18
95% confidence interval
The t value for 95% confidence interval = 2.1098
Standard error = s
n = 2.6143
19 =0.5998
Lower limit =Mean ( t valueStandard error ) =51.3895 ( 2.10980.5998 ) =50.13
Upper limit =Mean+ ( t valueStandard error )=51.3895+ (2.10980.5998 ) =52.65
Margin of error ( MOE )=E=t valueStandard error= ( 2.10980.5998 )=1.26
¿ point ( LEP)=50.13
¿ end point ( REP )=52.65
It can say with 95% confidence that mean time taken to finish drive of car will be between
50.13 and 52.65.
Question 6
Mean x=1.468
Standard deviation s=0.1924
Sample ¿ ¿ 19
Degree of freedom = 19-1 = 18
99% confidence interval
The t value for 99% confidence interval = 2.878
Standard error = s
n = 0.1924
19 =0.0441
10
Document Page
Lower limit =Mean ( t valueStandard error ) =1.468 ( 2.8780.0441 )=1.34
Upper limit =Mean+ ( t valueStandard error )=1.468+ ( 2.8780.0441 ) =1.60
Margin of error ( MOE )=E=t valueStandard error=2.8780.0441=0.1270
¿ point ( LEP)=1 .34
¿ end point ( REP )=1.60
It can say with 99% confidence that mean height of toddlers will be between 1.34 feet and
1.60 feet.
11
chevron_up_icon
1 out of 12
circle_padding
hide_on_mobile
zoom_out_icon
logo.png

Your All-in-One AI-Powered Toolkit for Academic Success.

Available 24*7 on WhatsApp / Email

[object Object]