Statistics Research: Analyzing Conflict and Workplace Quality

Verified

Added on  2023/06/08

|7
|1077
|91
Homework Assignment
AI Summary
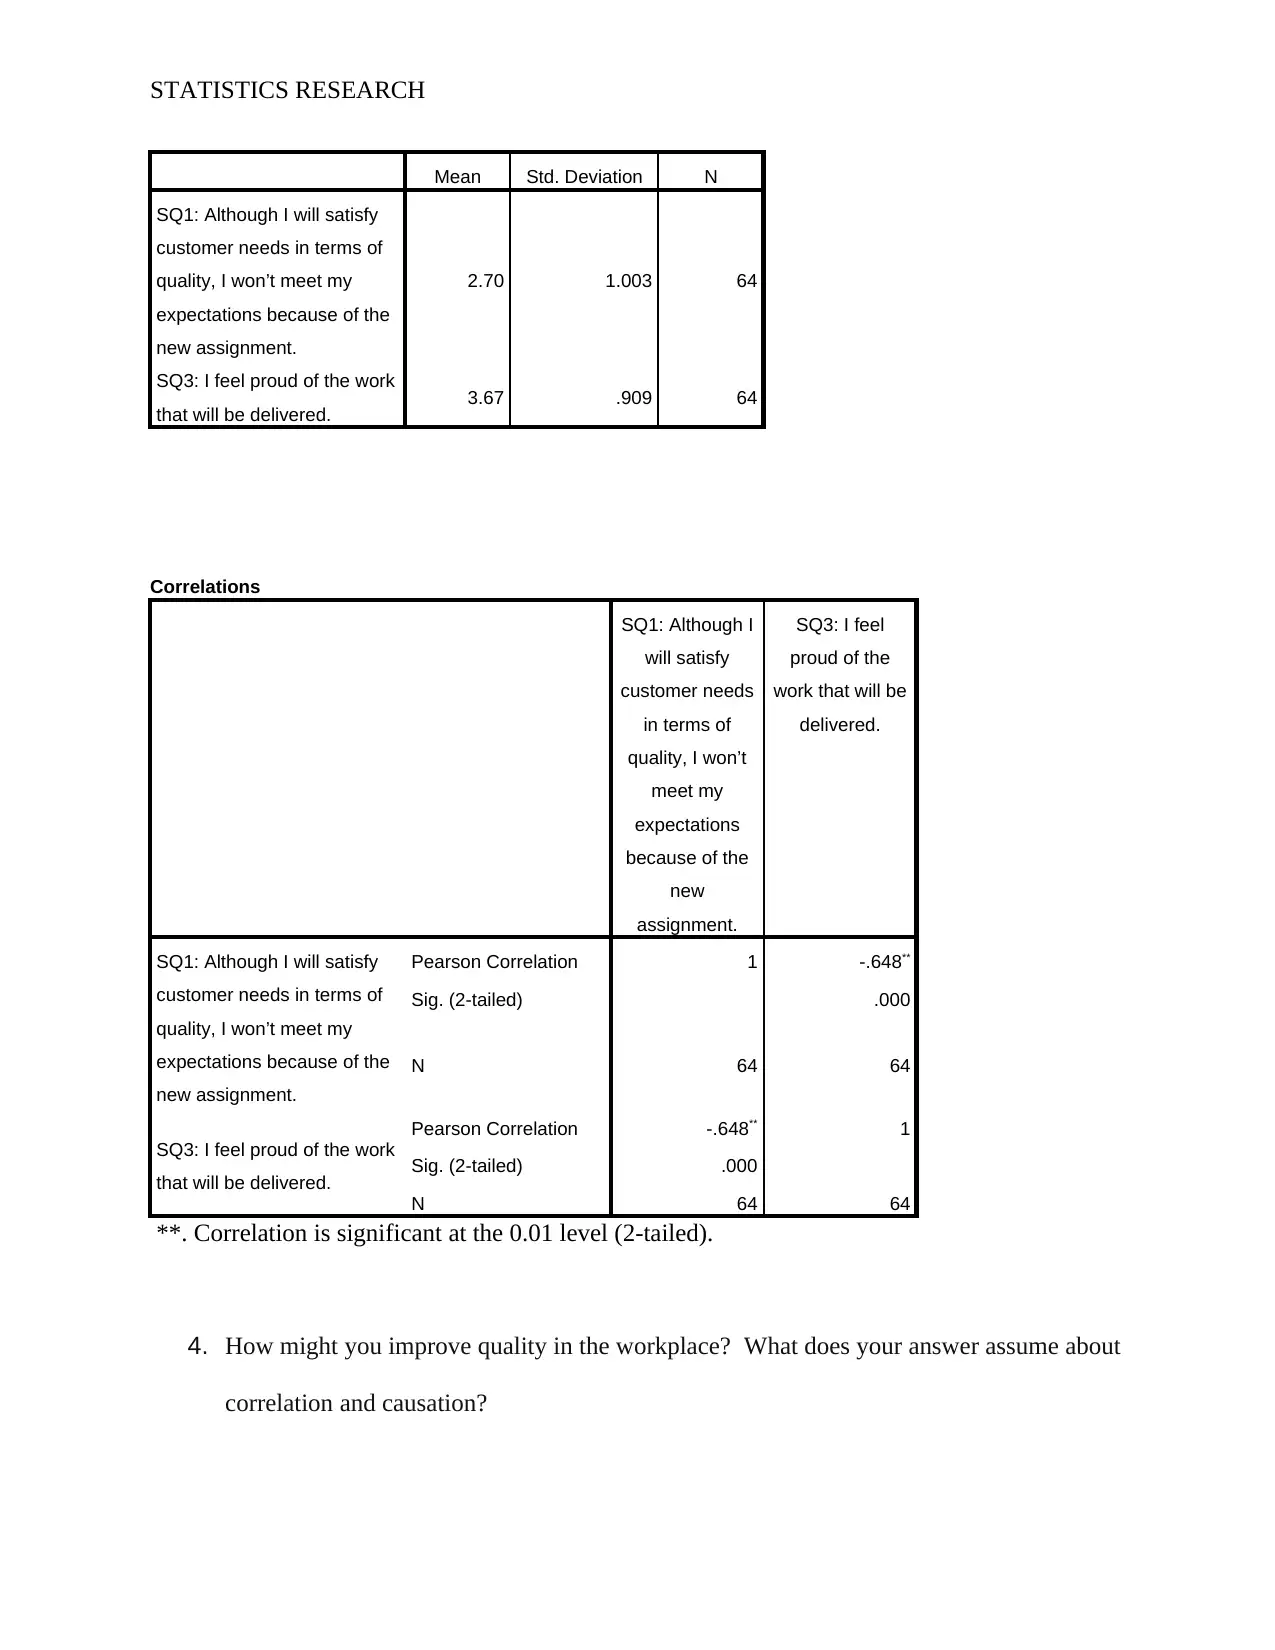
This assignment provides a statistical analysis of the relationship between conflict and workplace quality, using correlation analysis. The research focuses on two primary types of conflict: relationship conflict and task conflict. The analysis involves examining the correlations between variables such as disagreements, differences of opinion, anger, and tension within a group, and their impact on the quality of work. The results show the strength and significance of these correlations, and the paper also discusses ways to improve quality in the workplace based on the findings. The student uses Pearson correlation to measure the strength of the relationship between variables. The paper includes an executive summary, correlation tables, and descriptive statistics to support the analysis, with references to relevant research on correlation coefficients.
tabler-icon-diamond-filled.svg

Contribute Materials

Your contribution can guide someone’s learning journey. Share your documents today.
Document Page
Running head: STATISTICS RESEARCH 1
Statistics for Research.
Name
Intuitional affiliation.
tabler-icon-diamond-filled.svg

Secure Best Marks with AI Grader

Need help grading? Try our AI Grader for instant feedback on your assignments.
Document Page
STATISTICS RESEARCH
Introduction and executive summery.
When using the correlation, we seeks to produce the coefficient R which is responsible for
measuring the strength and the direction of relationship between two pair of data and continuous
variables. This means that by extension, the correction will evaluate the presence of statistics
evidence for a leaner relationship that exist among the same pairs of population. This analysis
produces the result of coefficient to a different type and kinds of variable. This variable that are
based on certain codes and variables presented in the excel spreadsheet. The variable to analyze
includes, relationship conflict, task conflict, the target relationship conflict, the target task
conflict, and the inadequate preparation time of the people involved (Mukaka, 2012). It is
important to note that before the data is analyzed, it is necessary to keep the following points into
consideration: That there are two or more variables which are continuous, That both cases have
variables on both sides, That there is an existence of leaner relationship between the variables,
That the variables have independent cases.
Document Page
STATISTICS RESEARCH
Relationship between T1 and T3.
Correlations
TC 1: How many
disagreements
over different
ideas were
there?
TC 3:How many
differences of
opinion were
there within the
group?
TC 1: How many
disagreements over different
ideas were there?
Pearson Correlation 1 .677**
Sig. (2-tailed) .000
N 77 77
TC 3:How many differences
of opinion were there within
the group?
Pearson Correlation .677** 1
Sig. (2-tailed) .000
N 77 77
**. Correlation is significant at the 0.01 level (2-tailed).
1. What is the strength of the correlations between the variables?
In most cases, the strength of correlations seeks to measure the strength that exist in a
relationship. To get the strength of coefficient correlation, we need to assume that the
relationship is leaner (Rathus, 2017). On general observation in most cases is that correlation is
always strong when T1 correlation r is higher than 0.7. In this case the value of R=1. This means
that the strength R =1. This means that the correlation is very strong.
2. What measure of quality is most associated with relationship conflict? Task Conflict?
The measure of quality that is mostly associated with relationship conflict and task conflict is the
scale and coefficient quantity.
Document Page
STATISTICS RESEARCH
3. What is the significance of the correlations?
From the above analysis, the correlation significant at 0.01
To test the significance of two variable, we introduced the coefficient to test the strength of the two
relationship.
Correlations for RC1 and RC3.
Correlations
RC 1: How
much anger was
there among the
members of the
group?
RC 3: How
much tension
was there in the
group during the
decision making
process?
RC 1: How much anger was
there among the members of
the group?
Pearson Correlation 1 .566**
Sig. (2-tailed) .000
N 77 77
RC 3: How much tension
was there in the group
during the decision making
process?
Pearson Correlation .566** 1
Sig. (2-tailed) .000
N 77 77
**. Correlation is significant at the 0.01 level (2-tailed).
Correlations for SQ1 and SQ3.
Descriptive Statistics
tabler-icon-diamond-filled.svg

Secure Best Marks with AI Grader

Need help grading? Try our AI Grader for instant feedback on your assignments.
Document Page
STATISTICS RESEARCH
Mean Std. Deviation N
SQ1: Although I will satisfy
customer needs in terms of
quality, I won’t meet my
expectations because of the
new assignment.
2.70 1.003 64
SQ3: I feel proud of the work
that will be delivered. 3.67 .909 64
Correlations
SQ1: Although I
will satisfy
customer needs
in terms of
quality, I won’t
meet my
expectations
because of the
new
assignment.
SQ3: I feel
proud of the
work that will be
delivered.
SQ1: Although I will satisfy
customer needs in terms of
quality, I won’t meet my
expectations because of the
new assignment.
Pearson Correlation 1 -.648**
Sig. (2-tailed) .000
N 64 64
SQ3: I feel proud of the work
that will be delivered.
Pearson Correlation -.648** 1
Sig. (2-tailed) .000
N 64 64
**. Correlation is significant at the 0.01 level (2-tailed).
4. How might you improve quality in the workplace? What does your answer assume about
correlation and causation?
Document Page
STATISTICS RESEARCH
There are so many ways to improve quality in work place. From the analysis the organization
must ensure that the rate of disagreement should reduce to minimal level (Lee Rodgers &
Nicewander, 2018). When employee agree with each other, they will be able to achieve
maximum output as well as quality. Secondly, the level of friction according to the analysis seem
hg than expected to achieve higher quality, management must ensure that friction among
employee is reduced to a minimal level.
Assumption.
The answers and result assumes that correlation and causation are the two key element of growth
in an organization. In addition, correlation and causation also reaffirms certainty.
References
Lee Rodgers, J., & Nicewander, W. A. (2018). Thirteen ways to look at the correlation
coefficient. The American Statistician, 42(1), 59-66.
Document Page
STATISTICS RESEARCH
Mukaka, M. M. (2012). A guide to appropriate use of correlation coefficient in medical research.
Malawi Medical Journal, 24(3), 69-71.
Rathus, S. (2017). A thirty item schedule assessing assertive behavior. Behavior therapy.
Puth, M. T., Neuhäuser, M., & Ruxton, G. D. (2014). Effective use of Pearson's product–moment
correlation coefficient. Animal Behaviour, 93, 183-189.
chevron_up_icon
1 out of 7
circle_padding
hide_on_mobile
zoom_out_icon
logo.png

Your All-in-One AI-Powered Toolkit for Academic Success.

Available 24*7 on WhatsApp / Email

[object Object]