Correlation Analysis of Life Satisfaction and Confidence Scores

Verified

Added on  2021/04/20

|4
|526
|276
Report
AI Summary
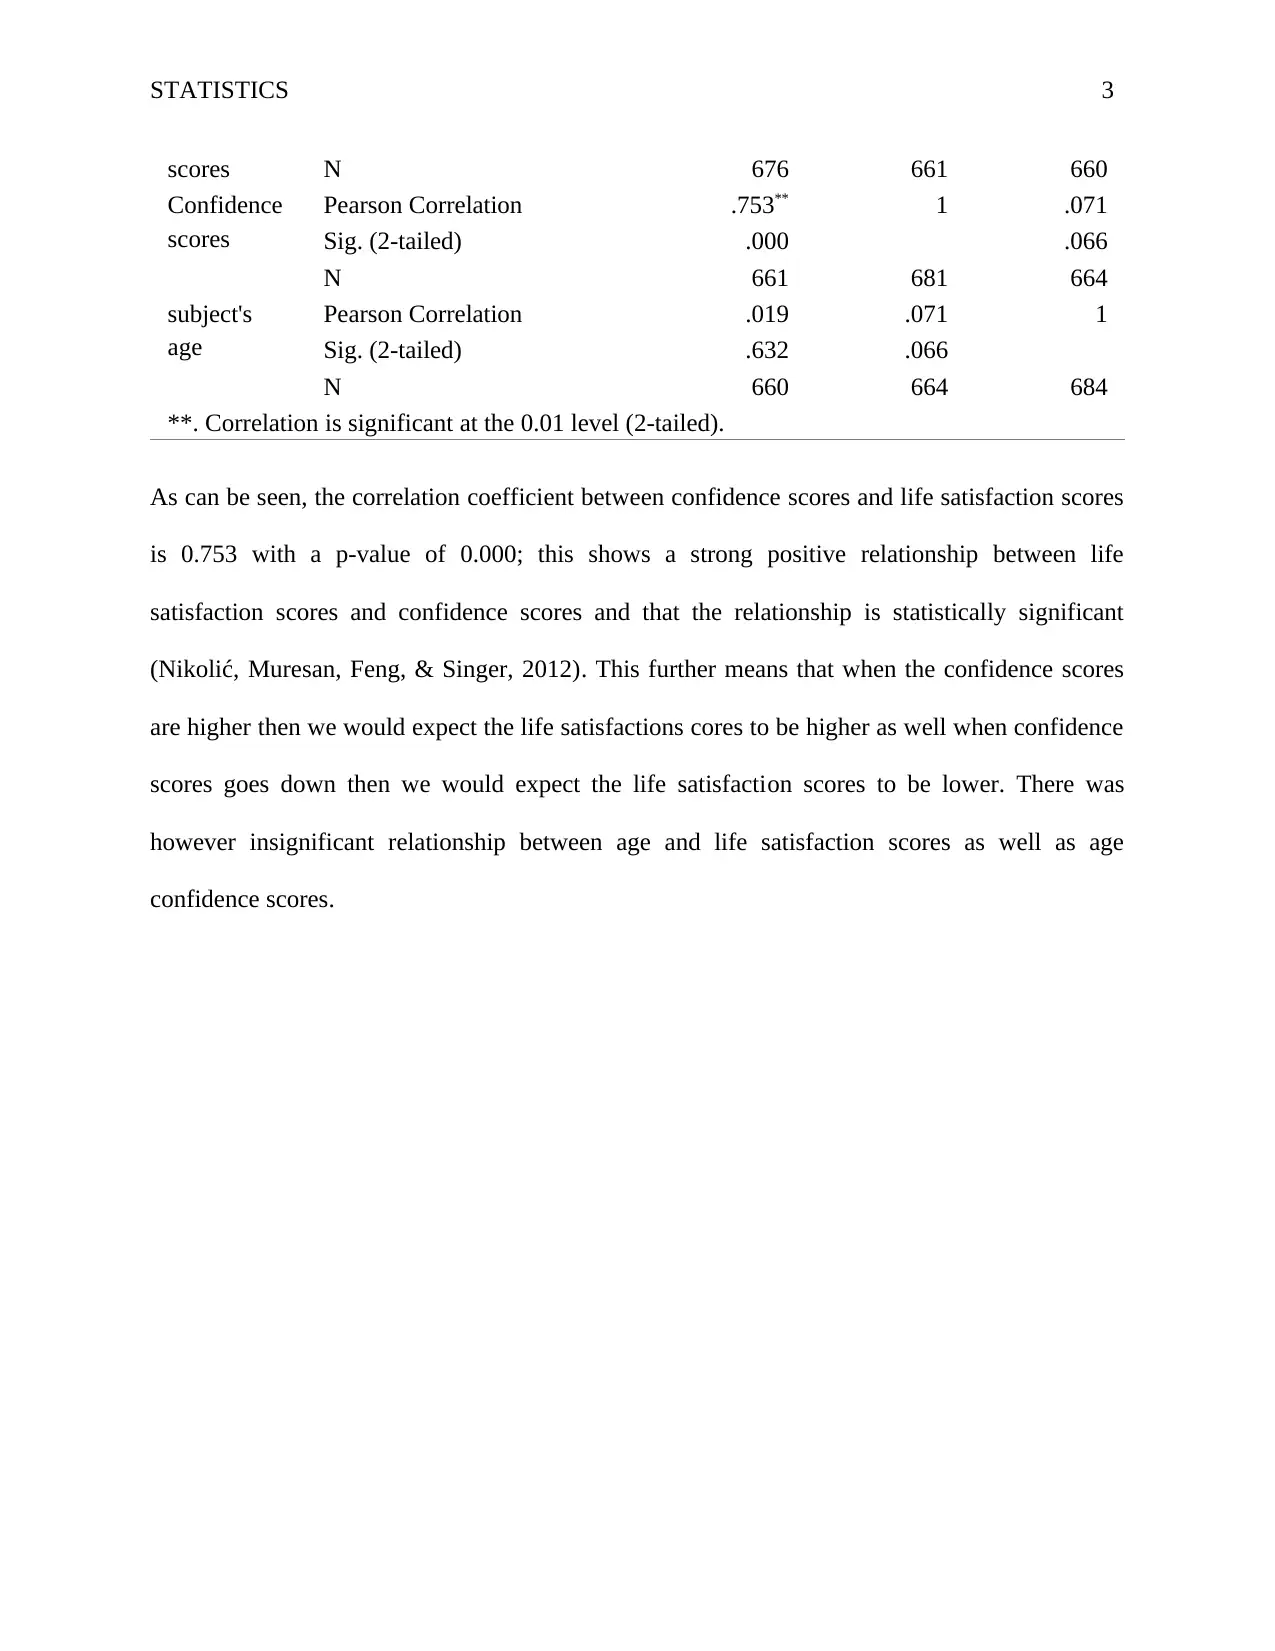
This report presents a correlation analysis of three variables: age, life satisfaction scores, and confidence scores. The analysis utilizes Pearson correlation to determine the strength and direction of relationships between the variables. The findings indicate a strong positive correlation between confidence scores and life satisfaction scores, with a statistically significant p-value of 0.000. This suggests that higher confidence scores are associated with higher life satisfaction scores, and vice versa. In contrast, the report reveals insignificant relationships between age and both life satisfaction and confidence scores. The report references the work of Nikolić et al. (2012) and Székely & Bakirov (2012) to support the methodology and interpretation of the correlation analysis. The report concludes by emphasizing the importance of understanding the relationships between variables and the implications of these relationships in various contexts.
Document Page
Running Head: STATISTICS 1
STATISTICS
Name:
Institution:
27th March 2018
tabler-icon-diamond-filled.svg

Paraphrase This Document

Need a fresh take? Get an instant paraphrase of this document with our AI Paraphraser
Document Page
STATISTICS 2
Question 1: Selected variables
This paper presents correlation analysis of three variables. Correlation analysis refers to the
analysis that seeks to find a relationship or a connection between two or more variables (Székely
& Bakirov, 2012). The strength and the magnitude of the relationship is based on the value of the
correlation coefficient that is obtained for any of the variables under investigation. As the value
approaches +1 then the relationship is regarded as strong positive while as it approaches -1 the
relationship is regarded as a strong negative relationship while a value that seems to be
approaching zero can be thought to either be weak negative or weak positive relationship
depending the sign value (Nikolić, Muresan, Feng, & Singer, 2012).
The selected variables for the correlation analysis are;
Age of the respondent,
The scores for life satisfaction
The confidence scores.
Question 2: Addressing correlation, significance, direction, and strength
In this analysis, three variables have been considered. We considered age of the respondent, the
scores for life satisfaction and the confidence scores. The aim is investigate the relationship
between the three variables (i.e. age of the respondent, confidence scores of the respondent and
the life satisfaction scores of the respondent). The results are given in table 1 below;
Table 1: Correlation matrix
Life satisfaction
scores
Confidence
score
subject's
age
Life
satisfaction
Pearson Correlation 1 .753** .019
Sig. (2-tailed) .000 .632
Document Page
STATISTICS 3
scores N 676 661 660
Confidence
scores
Pearson Correlation .753** 1 .071
Sig. (2-tailed) .000 .066
N 661 681 664
subject's
age
Pearson Correlation .019 .071 1
Sig. (2-tailed) .632 .066
N 660 664 684
**. Correlation is significant at the 0.01 level (2-tailed).
As can be seen, the correlation coefficient between confidence scores and life satisfaction scores
is 0.753 with a p-value of 0.000; this shows a strong positive relationship between life
satisfaction scores and confidence scores and that the relationship is statistically significant
(Nikolić, Muresan, Feng, & Singer, 2012). This further means that when the confidence scores
are higher then we would expect the life satisfactions cores to be higher as well when confidence
scores goes down then we would expect the life satisfaction scores to be lower. There was
however insignificant relationship between age and life satisfaction scores as well as age
confidence scores.
Document Page
STATISTICS 4
Works Cited
Nikolić, D., Muresan, R. C., Feng, W., & Singer, W. (2012). Scaled correlation analysis: a better
way to compute a cross-correlogram. European Journal of Neuroscience, 1-2.
Székely, G. J., & Bakirov, N. K. (2012). Measuring and testing independence by correlation of
distances. Annals of Statistics, 35(6), 2769–2794.
chevron_up_icon
1 out of 4
circle_padding
hide_on_mobile
zoom_out_icon
[object Object]