Statistics Coursework 1: Data Analysis and Interpretation

Verified

Added on  2023/01/11

|8
|742
|92
Homework Assignment
AI Summary
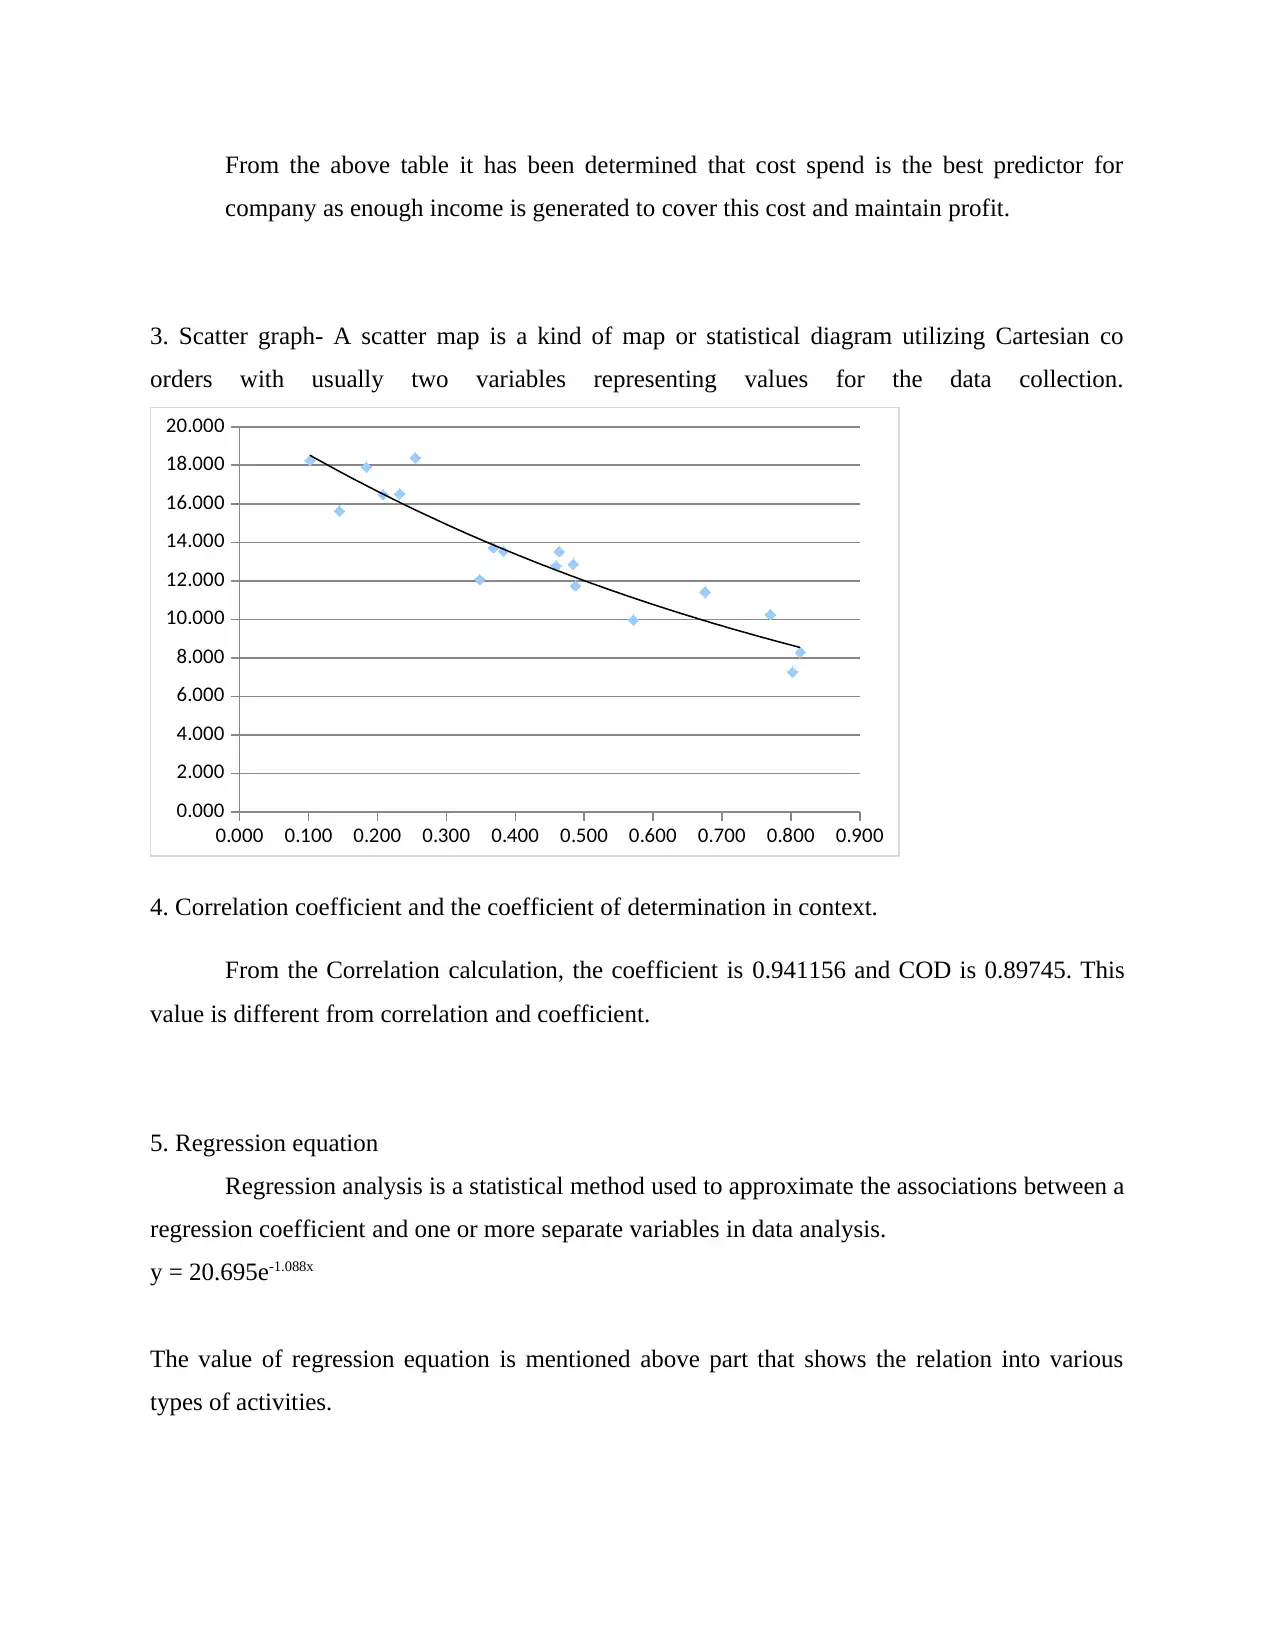
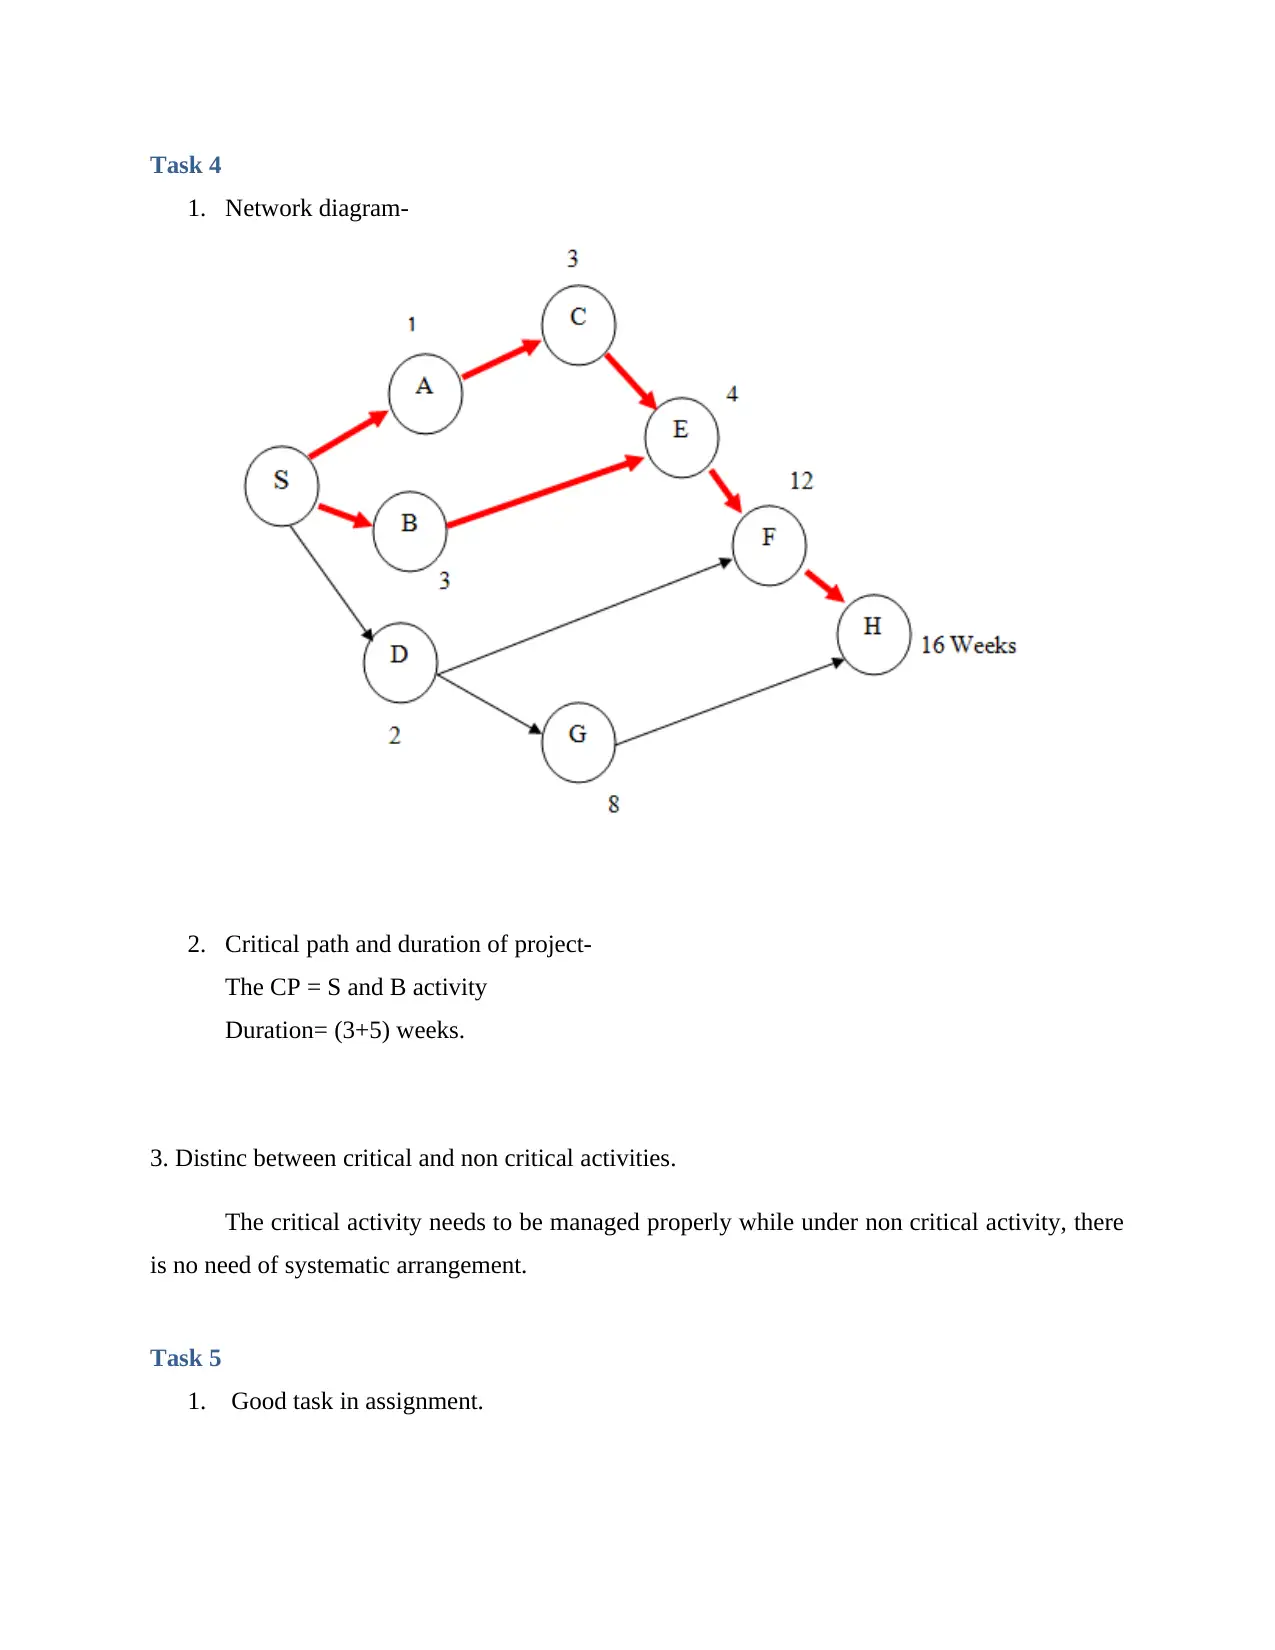
This document presents a solved statistics coursework assignment. The coursework covers various statistical concepts, including calculating mean, standard deviation, and coefficient of variance. It includes data analysis tasks, such as creating tables, calculating cumulative frequency, and constructing a correlation matrix. The assignment also involves identifying the best predictor, creating scatter graphs, and determining correlation coefficients and regression equations. Furthermore, the coursework touches upon project management techniques, including network diagrams and critical path analysis. Finally, the student reflects on the learning experience, identifying both the positive aspects and the challenges encountered during the assignment.
Document Page
Coursework one
tabler-icon-diamond-filled.svg

Paraphrase This Document

Need a fresh take? Get an instant paraphrase of this document with our AI Paraphraser
Document Page
Contents
Main body...................................................................................................................................................2
Task 1..........................................................................................................................................................2
Comparison of the mean and the median values and comment of the distribution of the data.................2
Task 2..........................................................................................................................................................2
Task 3..........................................................................................................................................................4
Task 4..........................................................................................................................................................6
Task 5..........................................................................................................................................................6
Document Page
Main body
Task 1
1. Calculation of the mean, standard deviation and coefficient of variation.
Mean- On the basis of above table, this can be found out that value of mean is 149.2. This
is indicating that average of 149 minutes time is spent by people on social media among
123 people.
Standard deviation- On the basis of done calculation, this can be stated that value of
standard deviation is of 237.3.
Coefficient of variance- The value of coefficient of variance is of 159.11% of above
mentioned data series.
Comparison of the mean and the median values and comment of the distribution of the
data.
Mean Standard deviation Coefficient of variance
149 237.3 159.11%
This table shows that value of mean, standard deviation and coefficient of variance is
different. Such as value of mean is of 149, standard deviation is of 237.3 and coefficient of
variance is of 159.11%.
Task 2
1. Tables
Table 1
Document Page
Table 2
2.
Mean SD
Task 1 149 237.3
Task 2 1865.19 6073.87
The values in task 2 do not seem realistic. Thus, mean and SD of ungrouped data is correct.
3.
tabler-icon-diamond-filled.svg

Paraphrase This Document

Need a fresh take? Get an instant paraphrase of this document with our AI Paraphraser
Document Page
1 2 3 4 5 6 7 8
0
20
40
60
80
100
120
140
10
26
40
60
84
101
113
123
Cumulative frequency
Average time-84 minutes.
Task 3
1. Correlation matrix of pre-tax profit
A matrix of correlation is a table of coefficients of correlation of variables. The
association between two variables is shown in every cell in the graph.
Colum
n 1
Column
2
Colum
n 3
Colum
n 1 1
Colum
n 2
-
0.8974
5 1
Colum
n 3
-
0.9276
1
0.94115
6 1
2. ‘best’ predictor
Document Page
From the above table it has been determined that cost spend is the best predictor for
company as enough income is generated to cover this cost and maintain profit.
3. Scatter graph- A scatter map is a kind of map or statistical diagram utilizing Cartesian co
orders with usually two variables representing values for the data collection.
0.000 0.100 0.200 0.300 0.400 0.500 0.600 0.700 0.800 0.900
0.000
2.000
4.000
6.000
8.000
10.000
12.000
14.000
16.000
18.000
20.000
4. Correlation coefficient and the coefficient of determination in context.
From the Correlation calculation, the coefficient is 0.941156 and COD is 0.89745. This
value is different from correlation and coefficient.
5. Regression equation
Regression analysis is a statistical method used to approximate the associations between a
regression coefficient and one or more separate variables in data analysis.
y = 20.695e-1.088x
The value of regression equation is mentioned above part that shows the relation into various
types of activities.
Document Page
Task 4
1. Network diagram-
2. Critical path and duration of project-
The CP = S and B activity
Duration= (3+5) weeks.
3. Distinc between critical and non critical activities.
The critical activity needs to be managed properly while under non critical activity, there
is no need of systematic arrangement.
Task 5
1. Good task in assignment.
tabler-icon-diamond-filled.svg

Paraphrase This Document

Need a fresh take? Get an instant paraphrase of this document with our AI Paraphraser
Document Page
During completing this assignment I learnt lot of new concepts of statistics such as %
cumulative frequency and its mean and standard deviation. As well as I was able to do
any complex task in an ease manner.
2. Challenging aspect of course work.
I faced some challenges also during my course work as some tasks were difficult to
understand for me. Such as calculation of correlation and diagram creation was tough for
me. Due to this, I spent too much time of some tasks.
3. Aspects for next time.
On the basis of above done tasks, I learnt lot of new things and faced lot of challenges.
For next time, I will focus on those tasks which are complex in nature and difficult to
understand. By doing so, I will be able to solve my task in quick time.
chevron_up_icon
1 out of 8
circle_padding
hide_on_mobile
zoom_out_icon
[object Object]